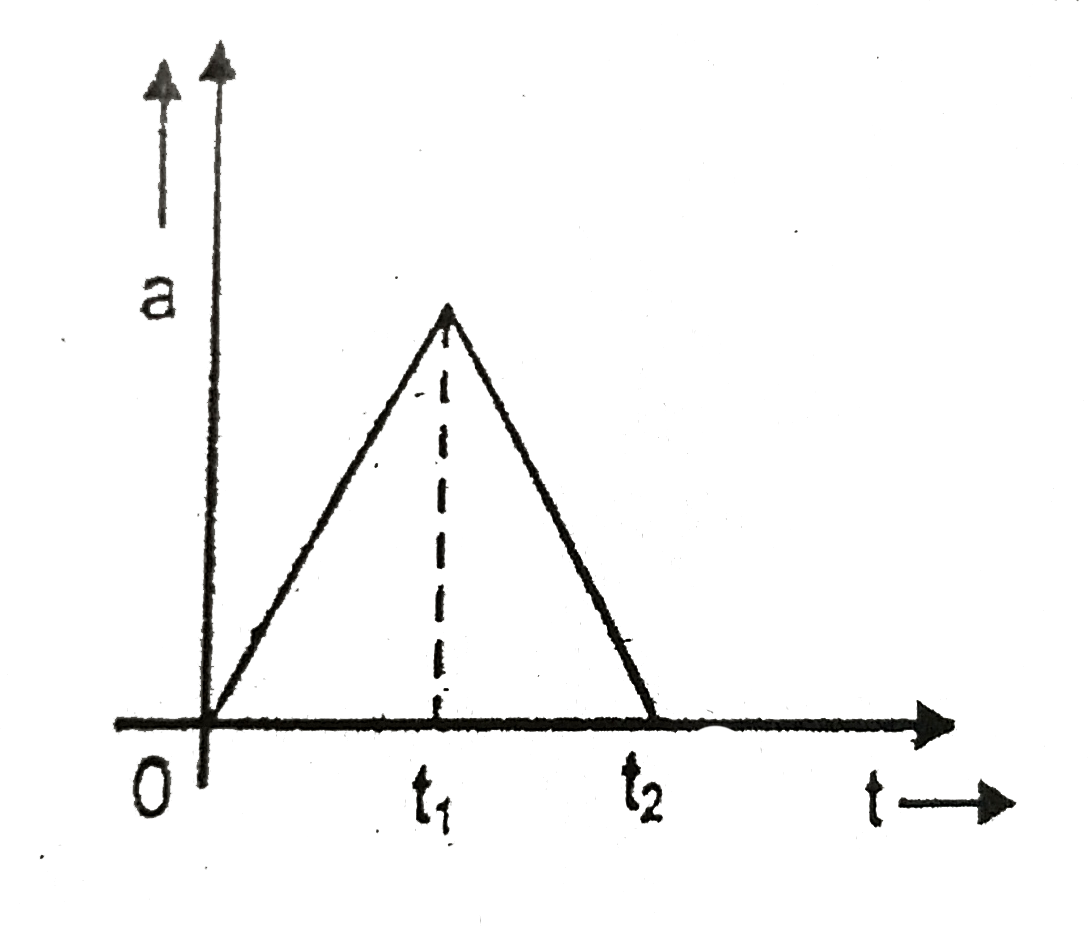
Figure shows the acceleration-time graphs of a particle. Which of the following represents the corresponding velocity -time graph? 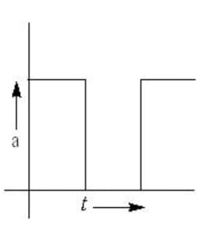
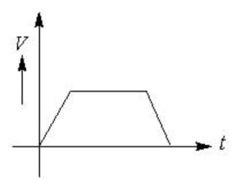
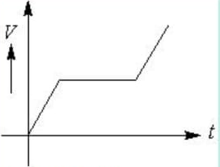
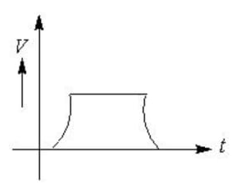
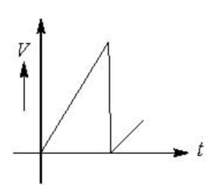
The correct Answer is:B
Step by step video, text & image solution for Figure shows the acceleration-time graphs of a particle. Which of the following represents the corresponding velocity -time graph? by Physics experts to help you in doubts & scoring excellent marks in Class 12 exams.
Topper's Solved these Questions
Similar Questions
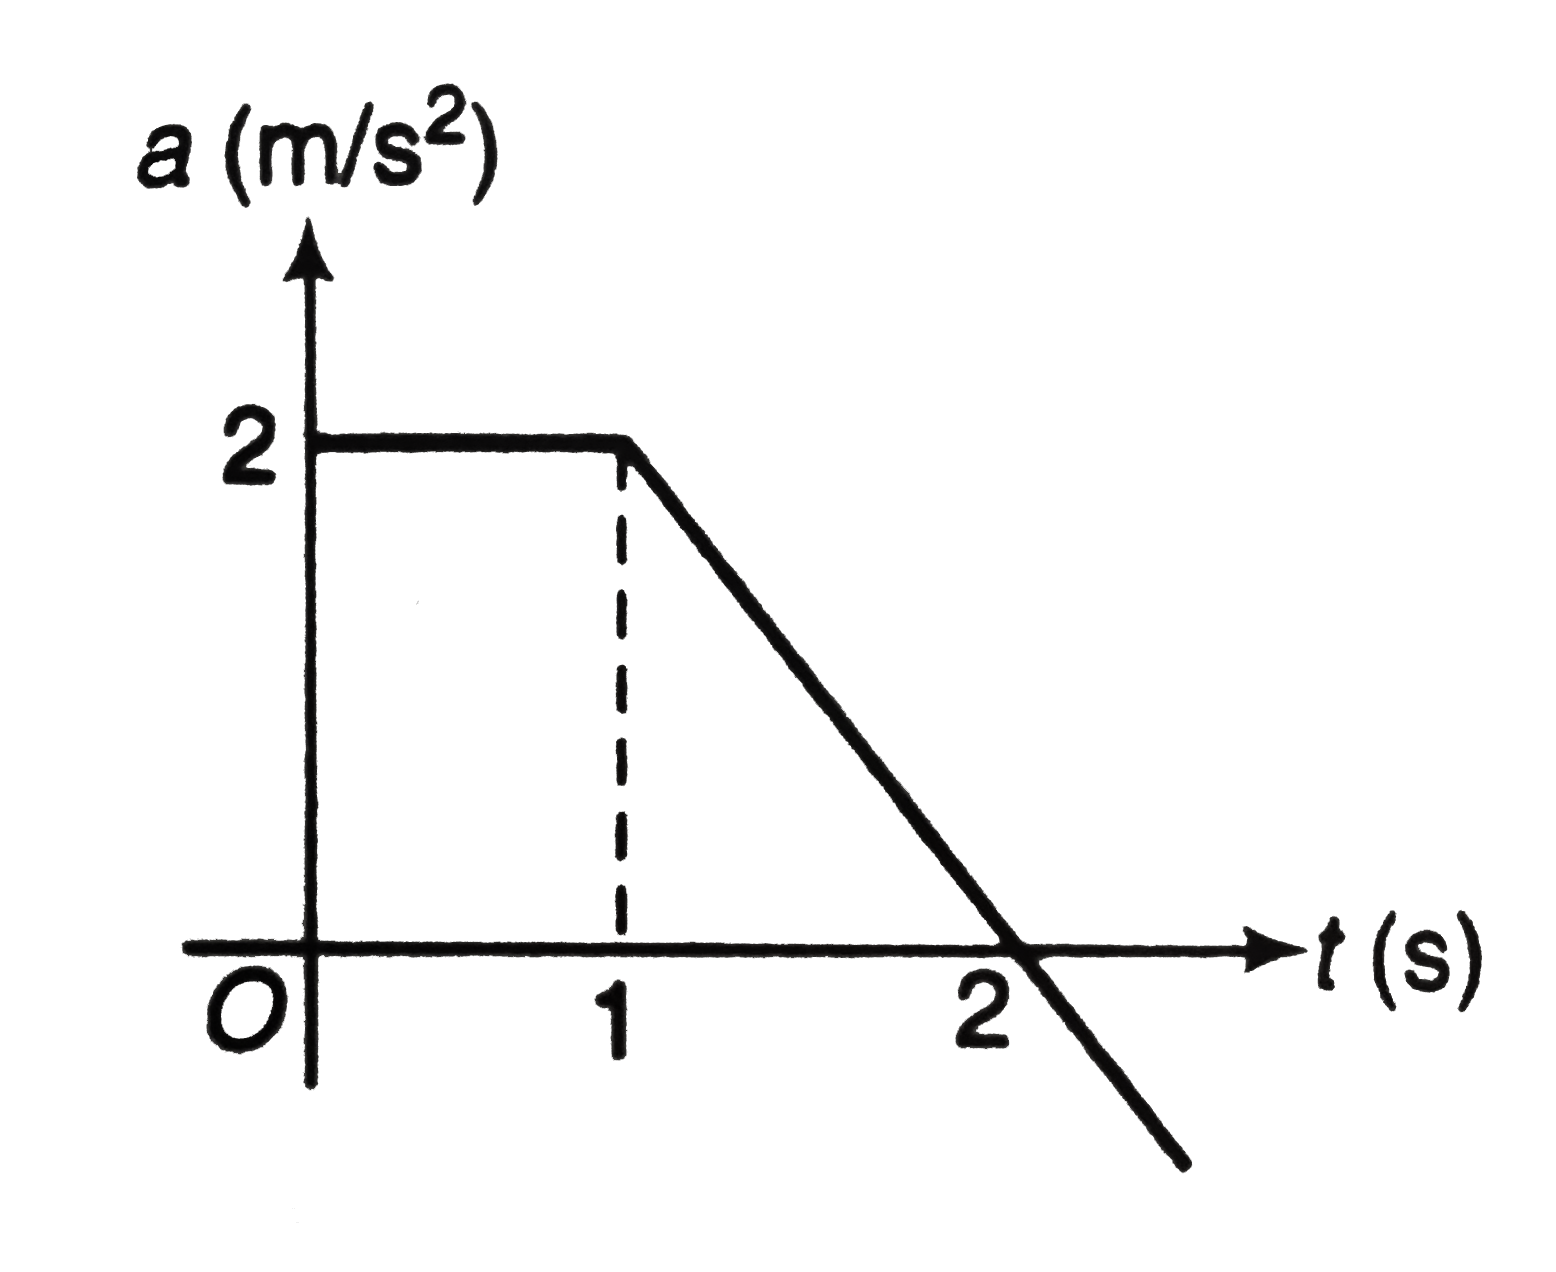
Figure shows the acceleration-time graph of a particle moving along a straight line. After what time the particle acquires its initial velocity?
 View Solution
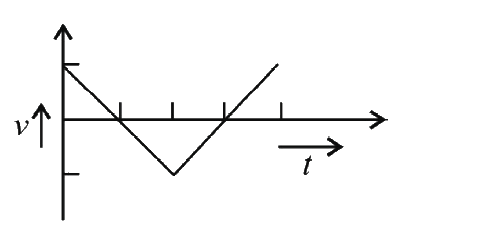
The graph in figure shows the velocity v versus time t for a body. Which of the graphs shown in figure represents the corresponding acceleration versus time graphs ?
 View Solution
Knowledge Check
- Question 1 - Select One
The graph below shws the velocity versus time graph for a body
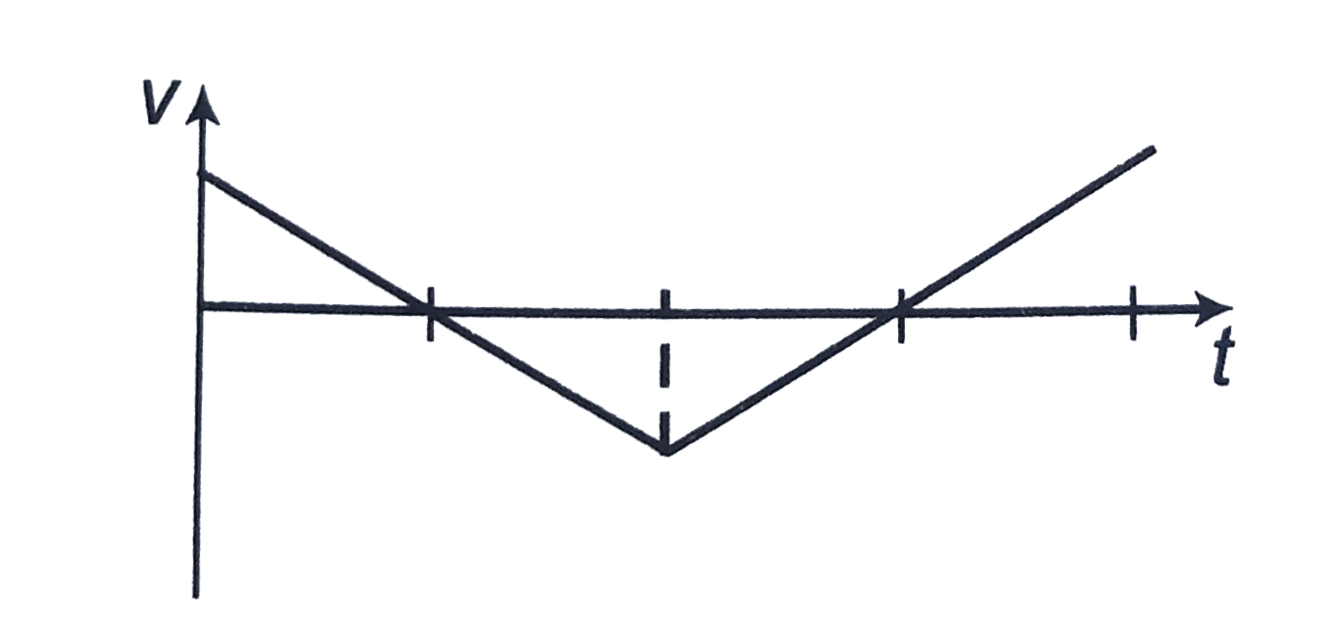
Which of the following graph represents the corresponding acceleration v//s time graph?A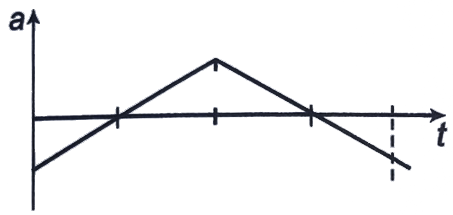 B
B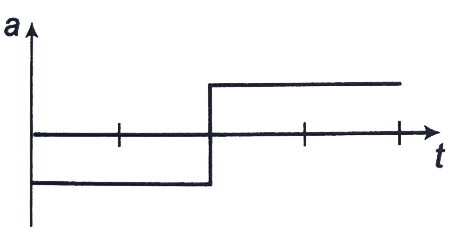 C
C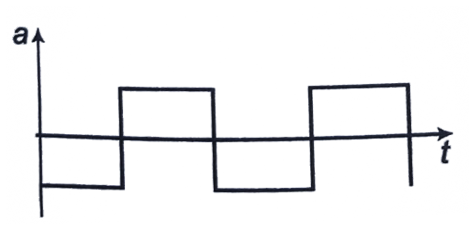 D
D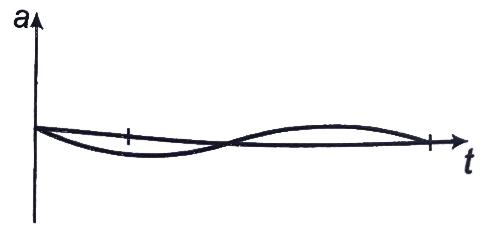
- Question 2 - Select One
The given acceleration-time graph represents which of the following physical situation?
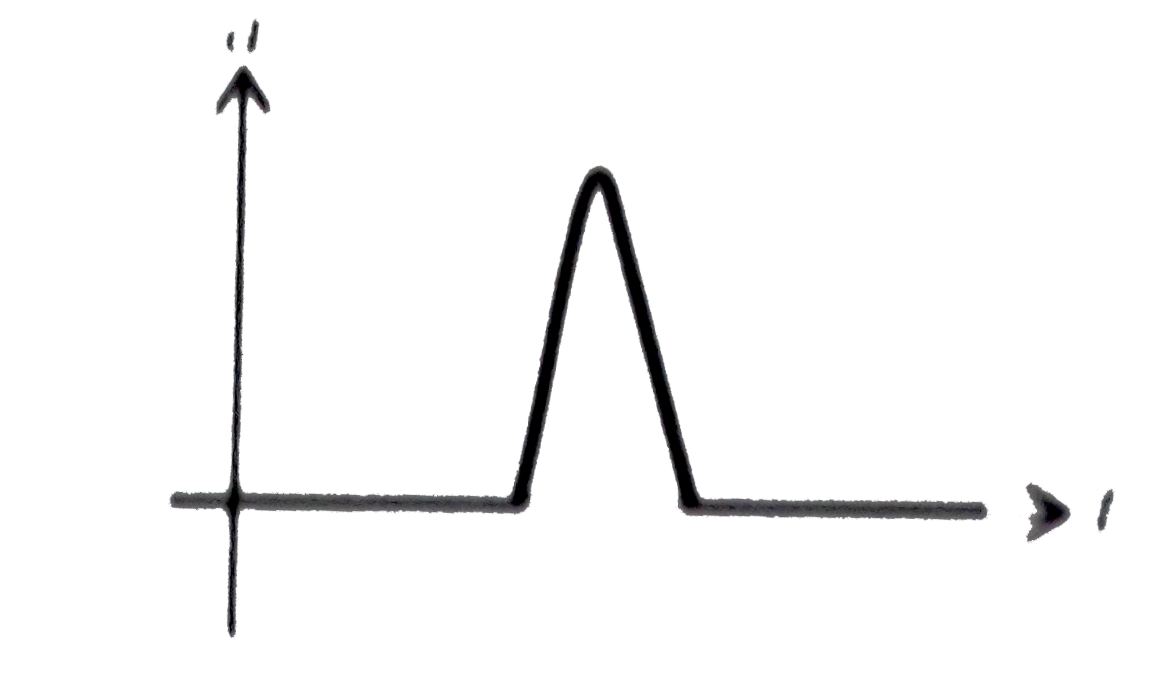 AA cricket ball moving with a uniform speed is hit with a bat for a very short time interval.BA ball is falling freely from the top of a tower.CA car moving with constant velocity on a straight road.DA football is kicked into the air vertically upwards.
 - Question 3 - Select One
A particle starts to move along a straight line. The acceleration versus time graph of particle is as shown in figure. The correct velocity versus time graph is :
 A
A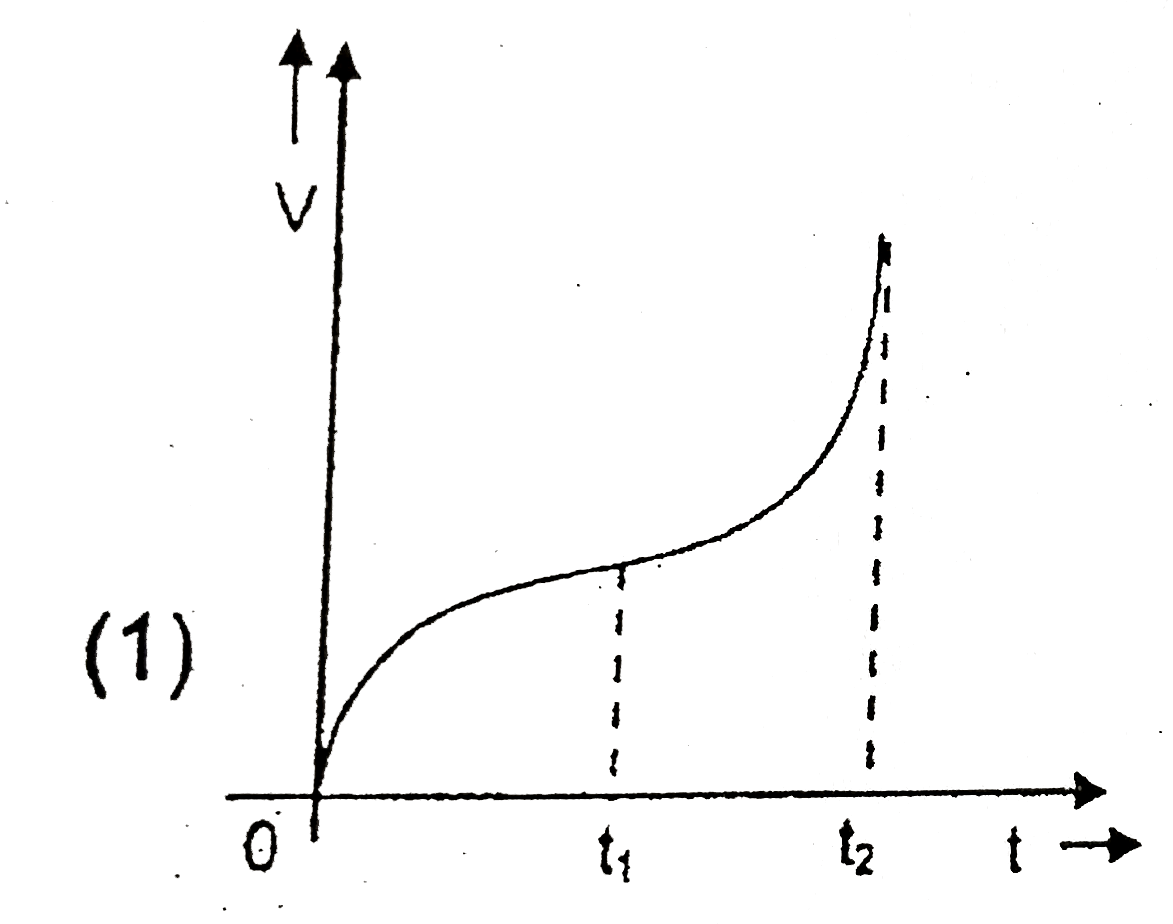 B
B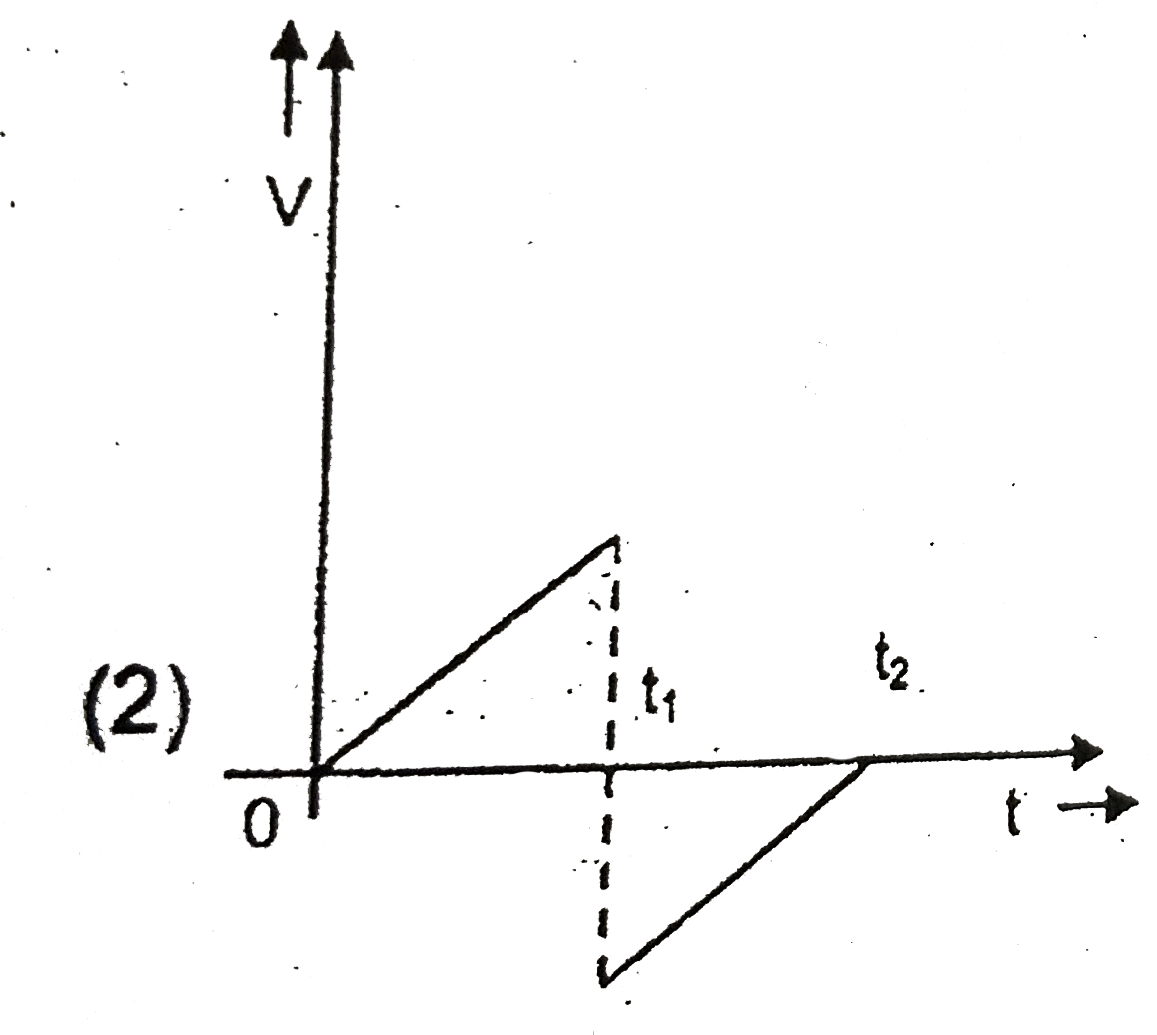 C
C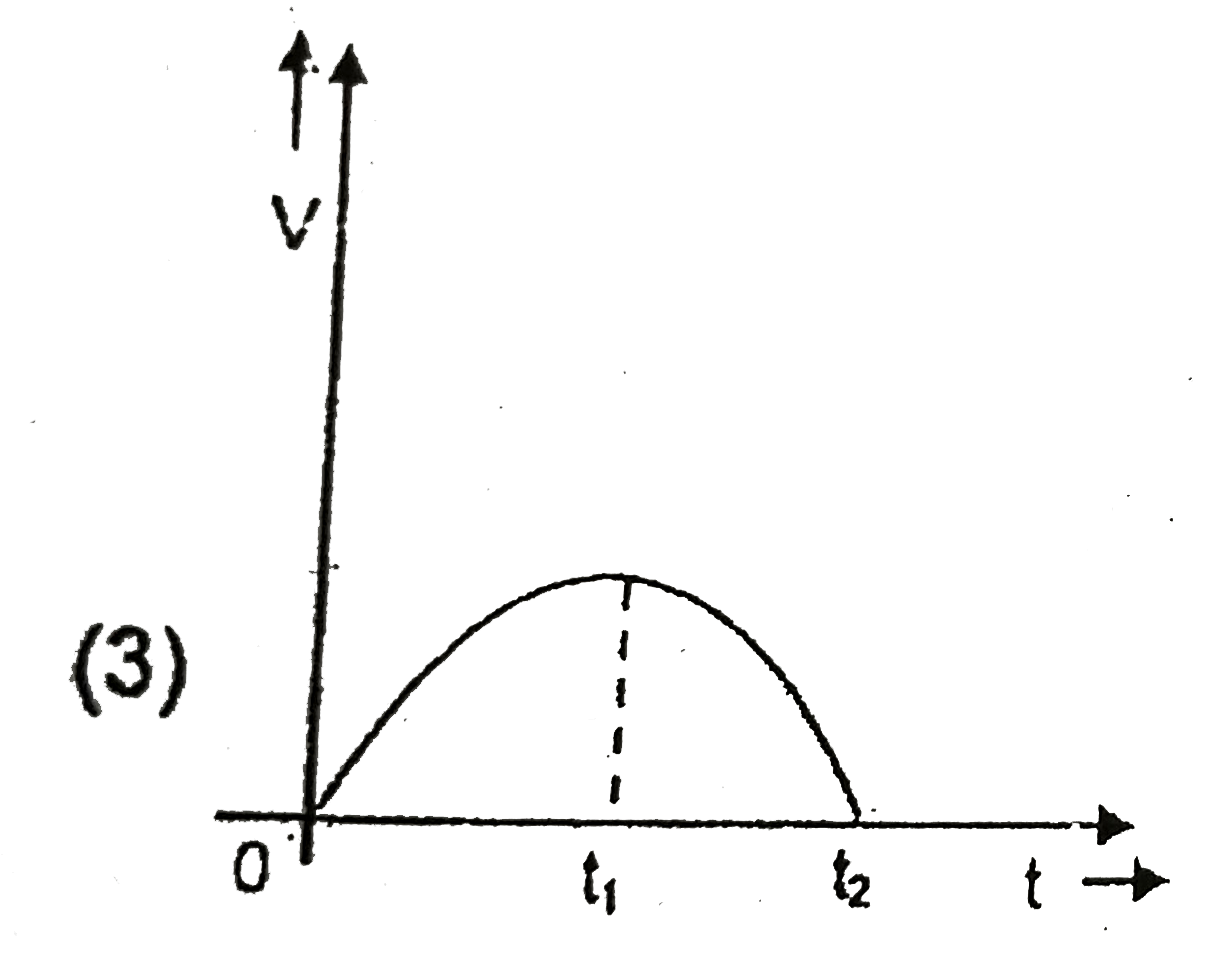 D
D
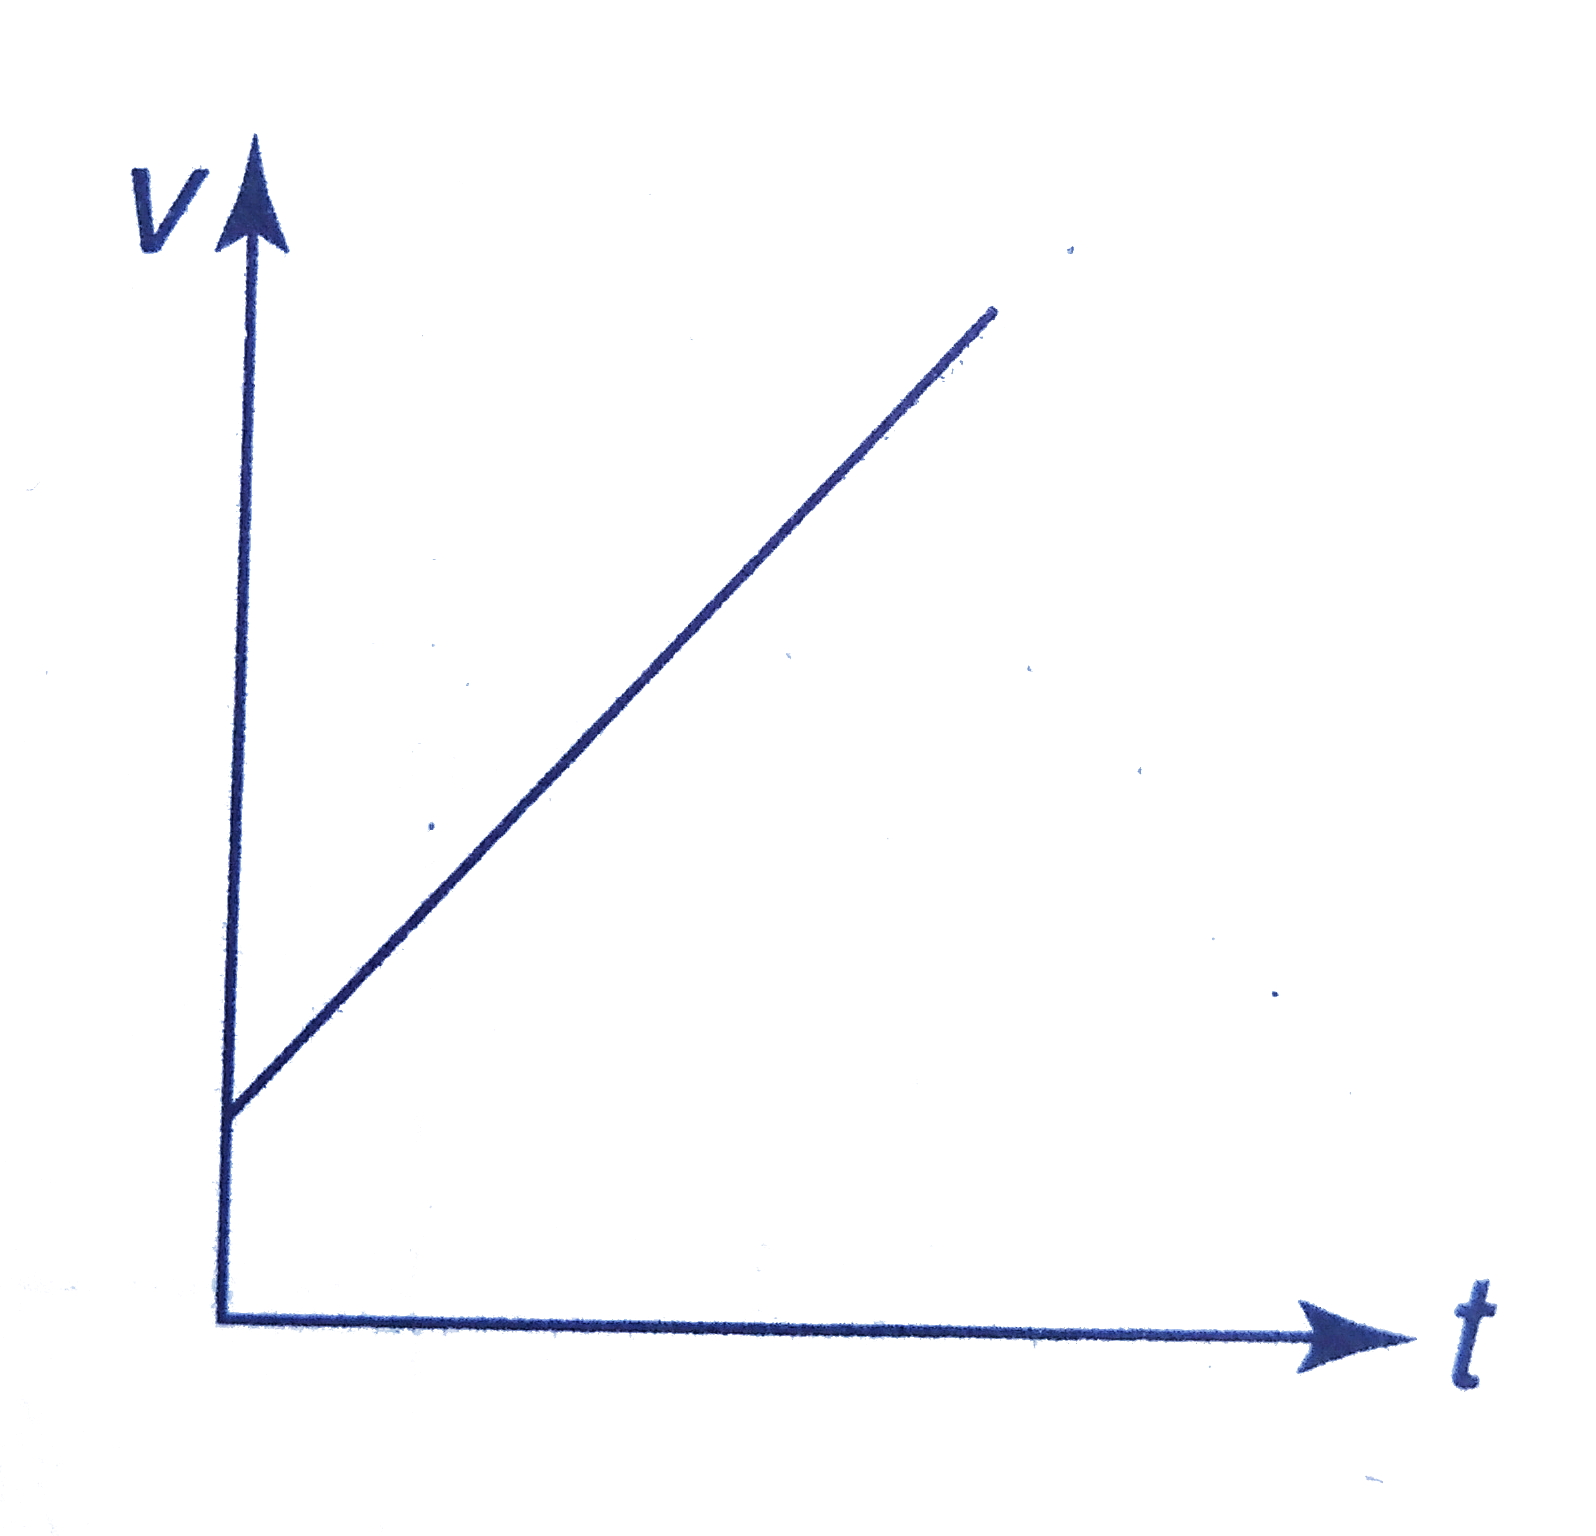
Figure shows a velocity-time graph. This shows that.
 View Solution
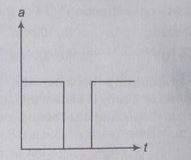
Acceleration time graph of a body is shown below the corresponding velocity time graph of the same body is
 View Solution
Acceleration time graph of a body is shown below the corresponding velocity time graph of the same body is
 View Solution
The velocity − time graph of a particle is as shown in figure
 View Solution
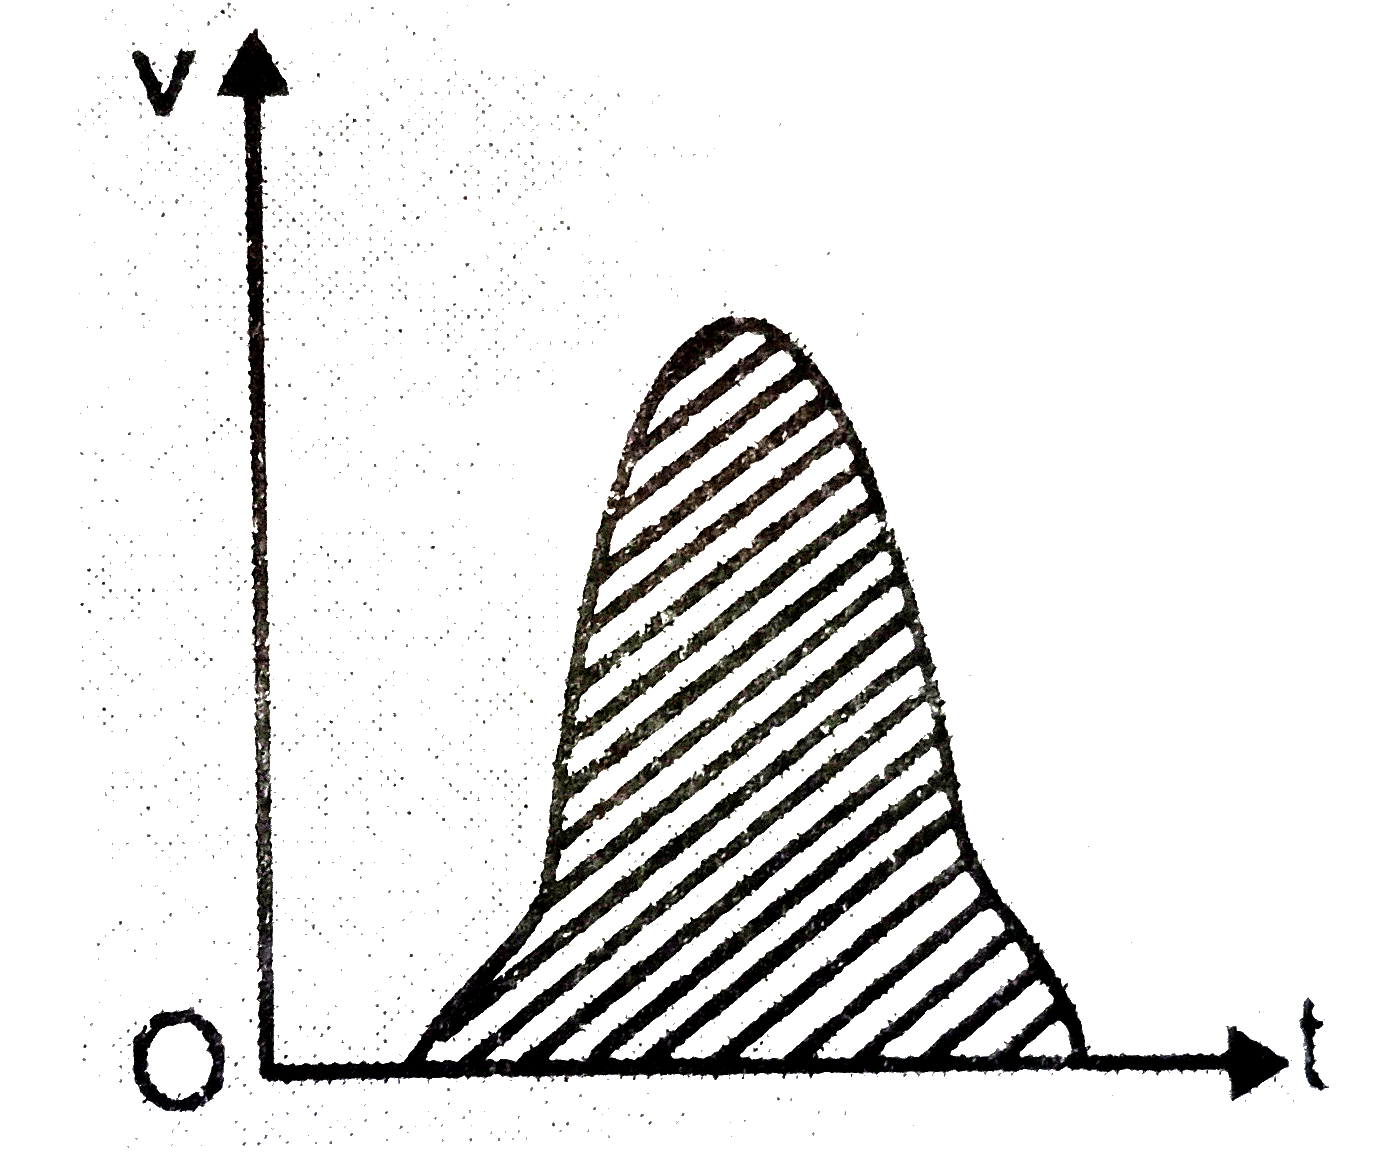
Figure below shows the velocity-time graph of a one dimensional motion. Which of the following characteristic of the particle is represented by the shaded area?
 View Solution

