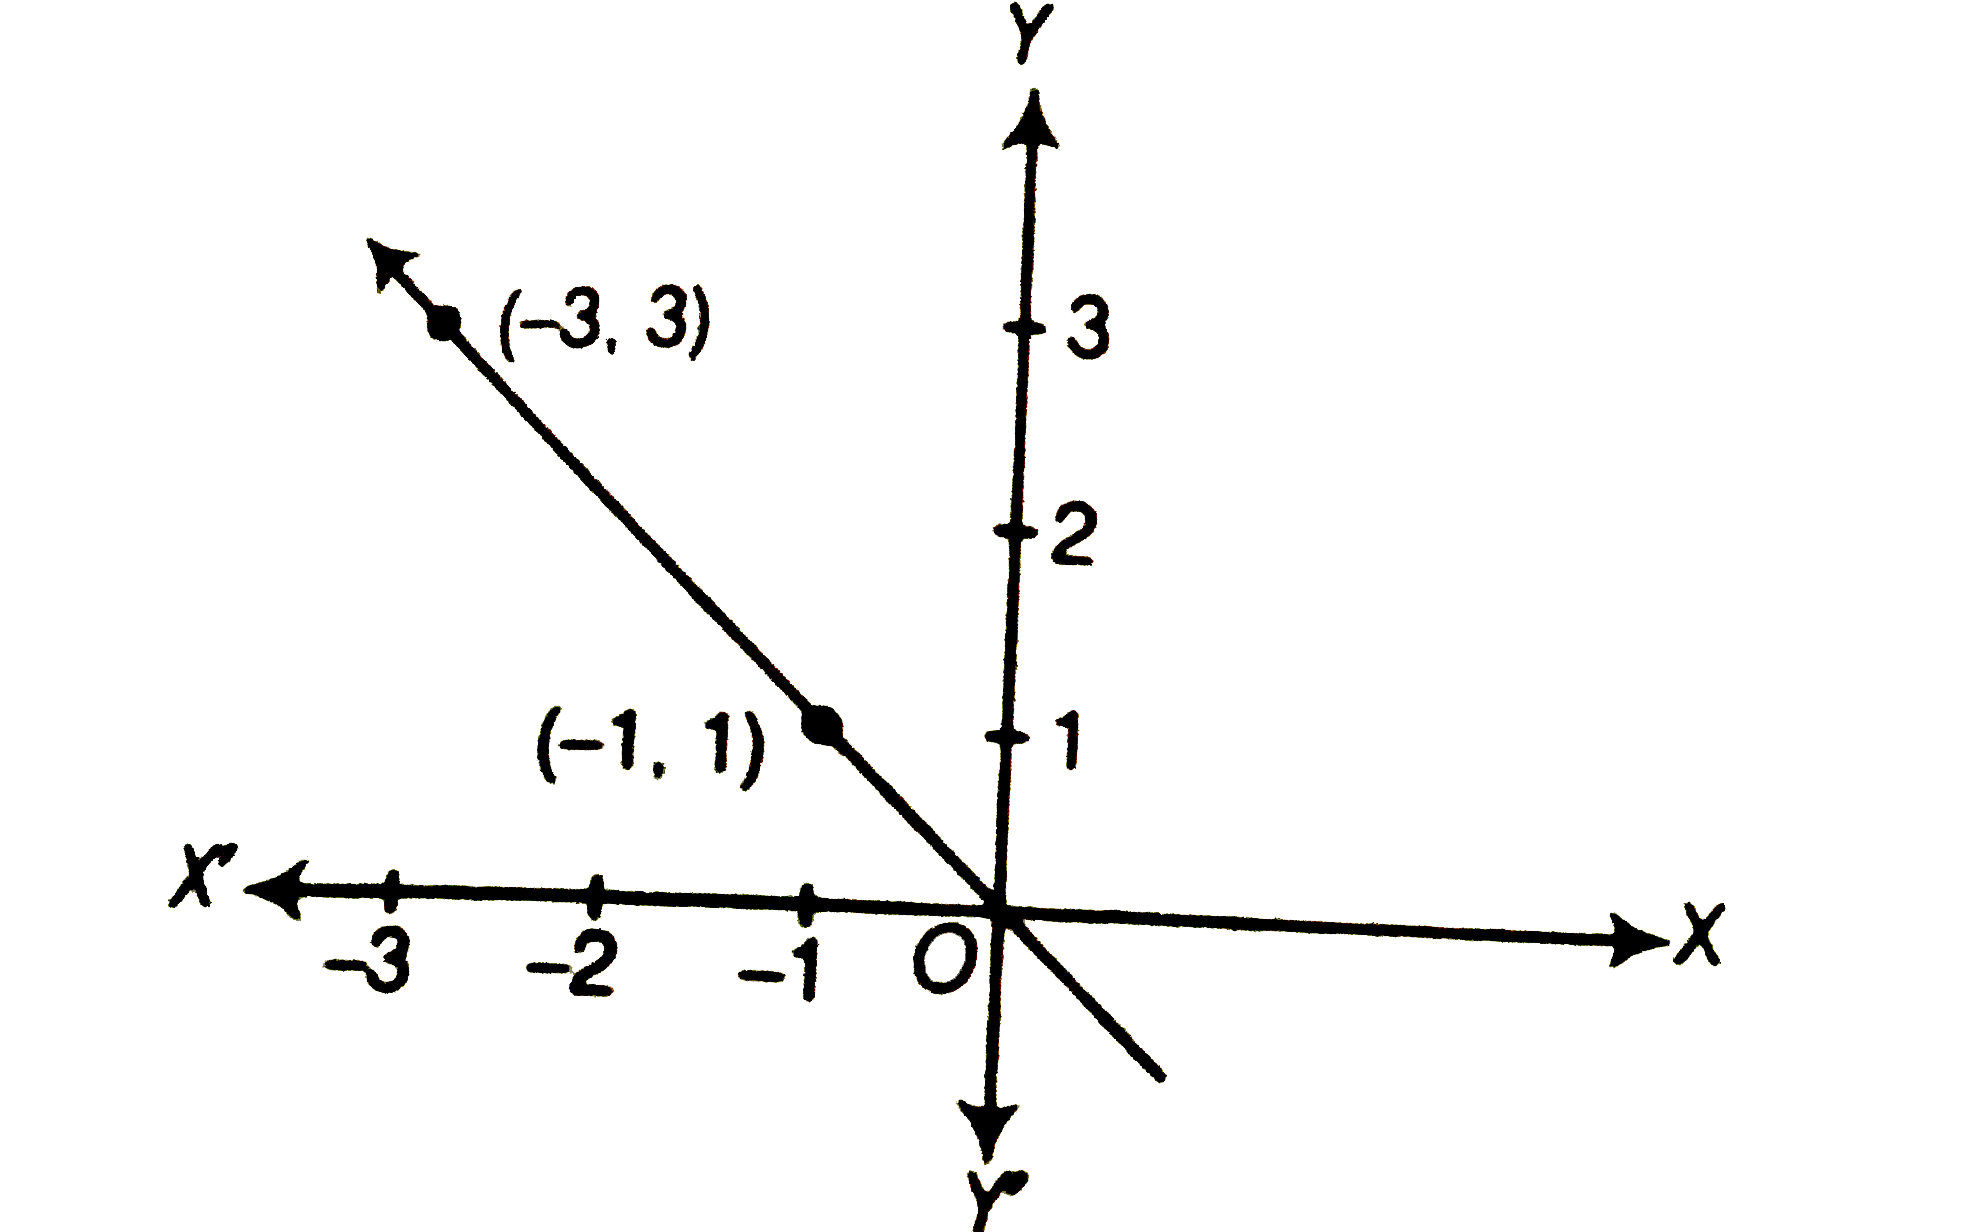
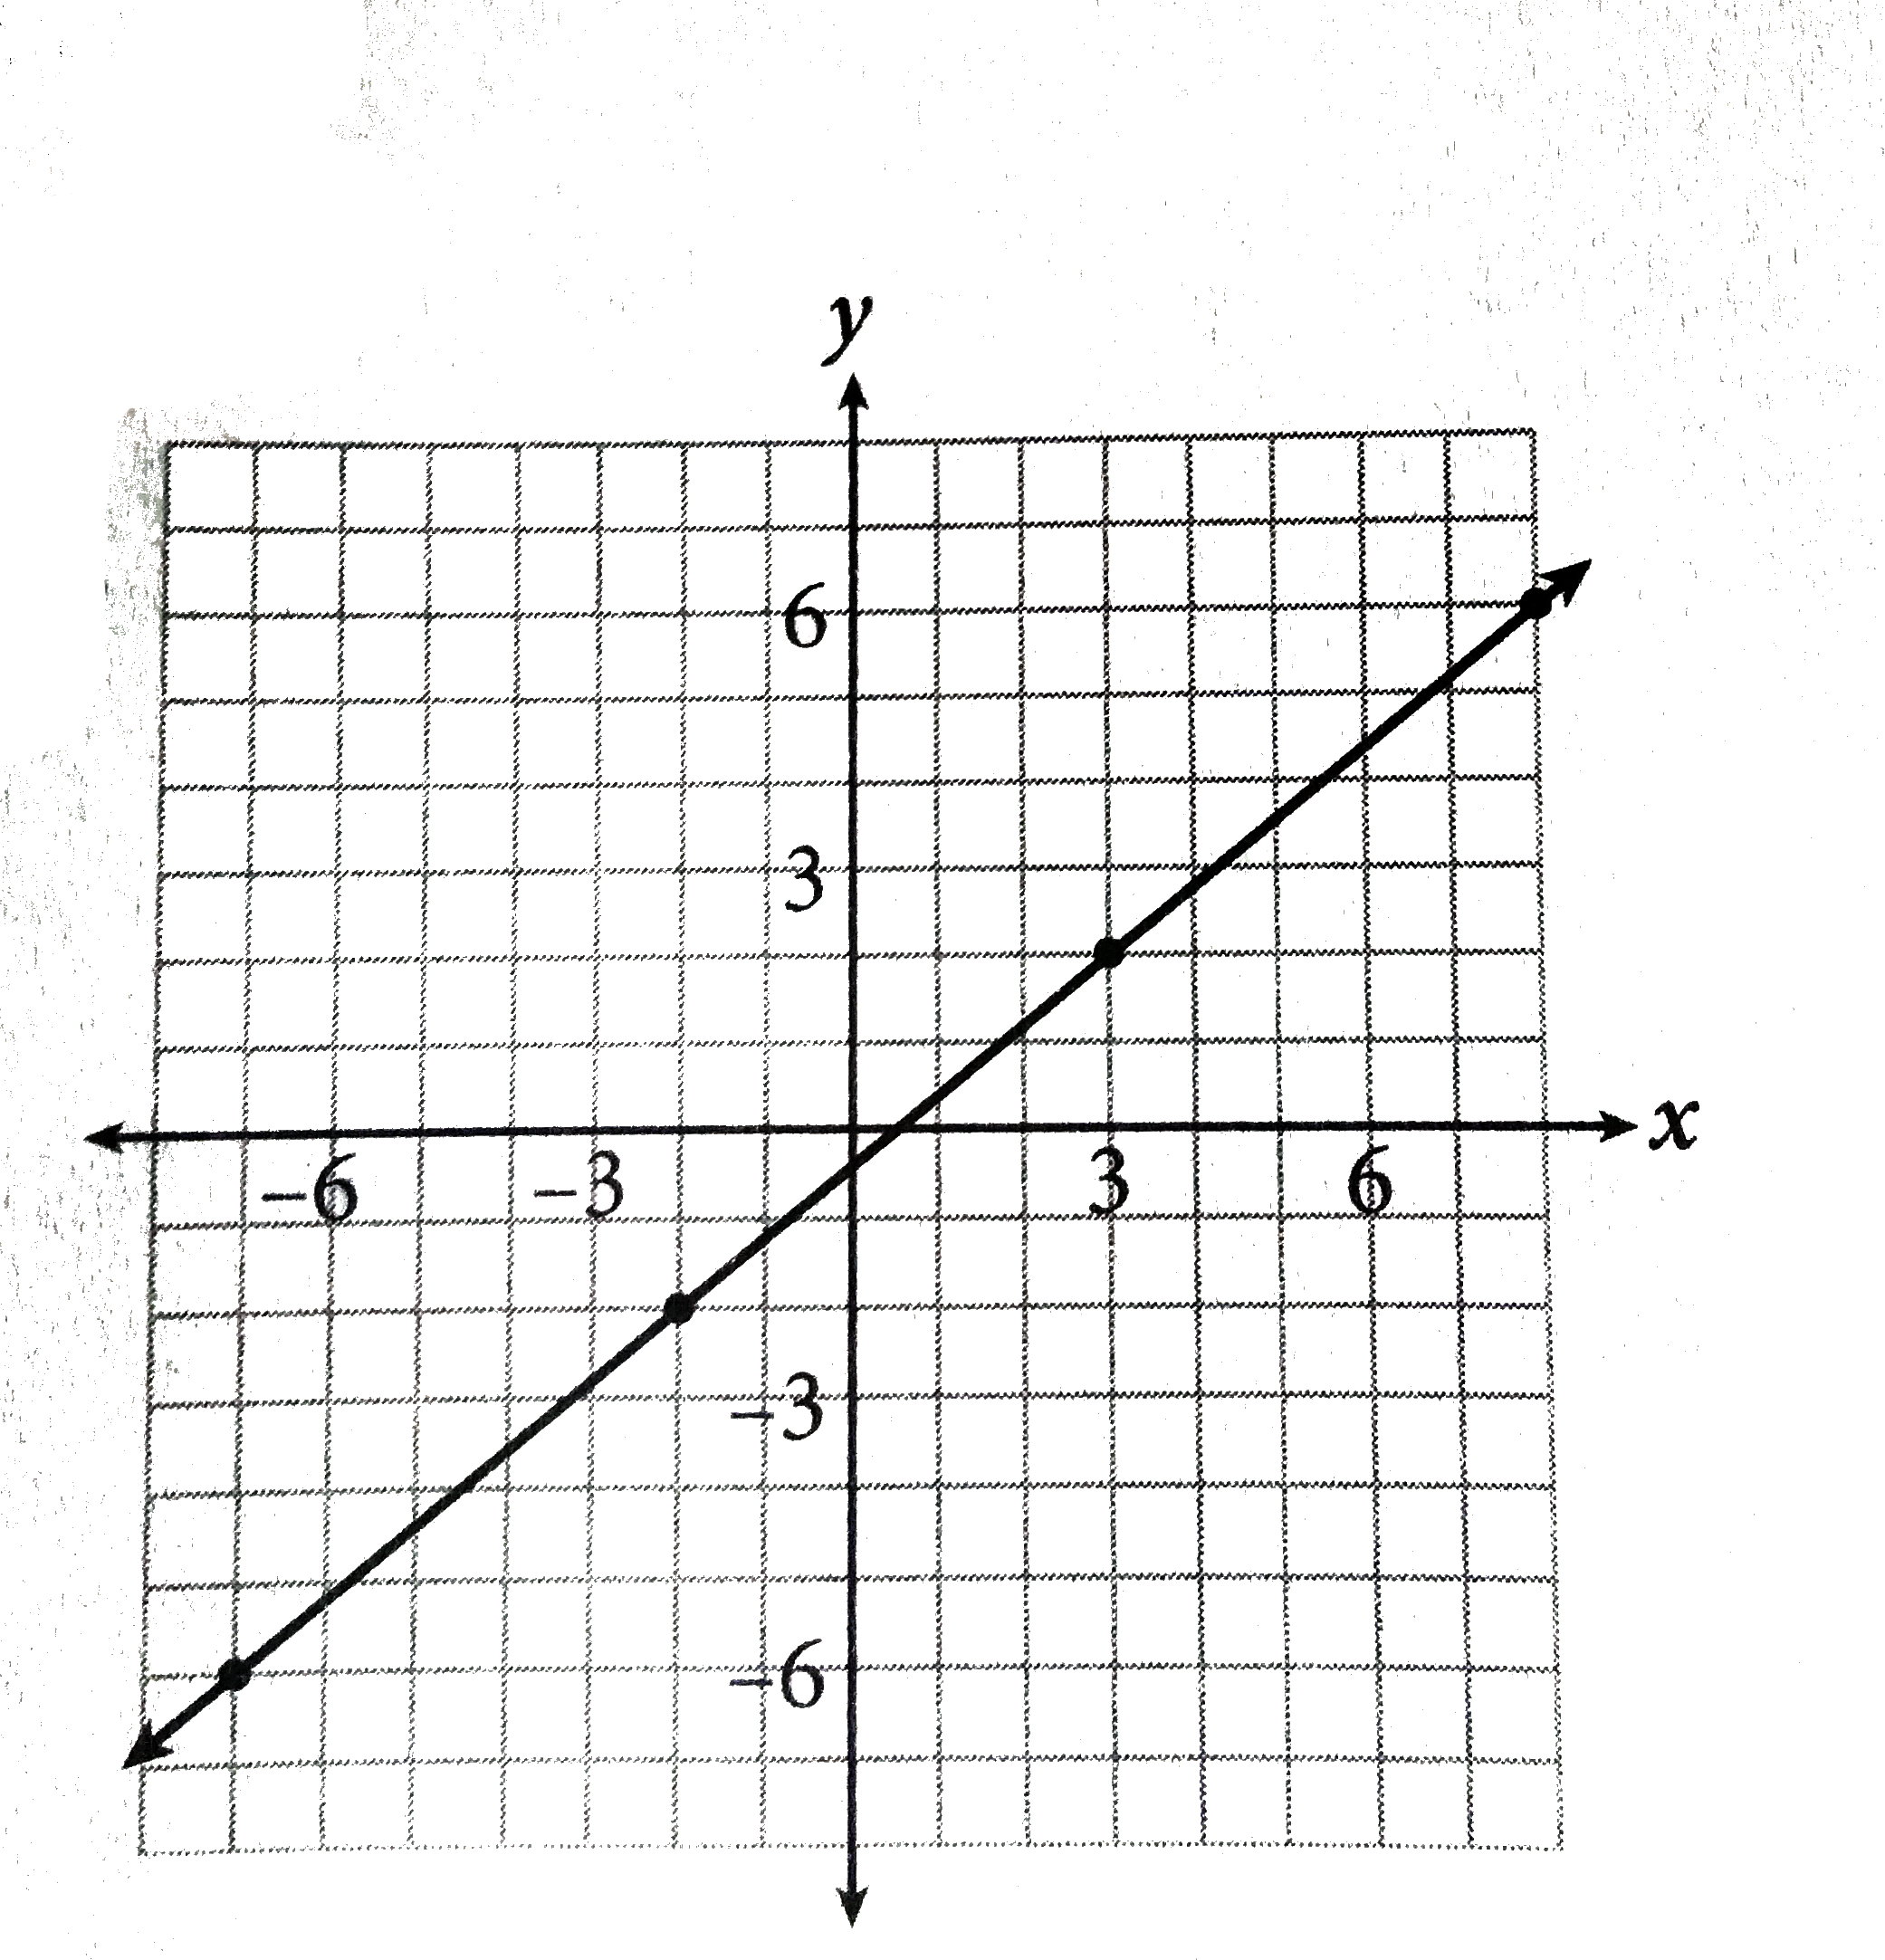
When graphing a linear equation that is written in the form y=mx+b, the variable m represents the slope of the line and b represents the y-intercept. Assuming that b>0, which of the following best describes how reversing the sign of b will affect the graph ?
The new line will be shifted down b units.
The new line will be shifted down 2b units.
the new line will be perfect reflection across the x-axis.
The new line will be a perfect reflection across the y-axis.
The correct Answer is:B
To solve the problem, we need to analyze how reversing the sign of the y-intercept b in the linear equation y=mx+b affects the graph of the line.
1. Understand the Original Equation:
The original equation is given as y=mx+b, where m is the slope and b is the y-intercept. The y-intercept is the point where the line crosses the y-axis.
2. Identify the Y-Intercept:
Since b>0, the line crosses the y-axis above the origin (0,0). This means the point (0, b) is above the x-axis.
3. Reversing the Sign of b:
When we reverse the sign of b, we replace it with −b. The new equation becomes y=mx−b.
4. Determine the New Y-Intercept:
In the new equation y=mx−b, the y-intercept is now at the point (0, -b). Since b is positive, −b will be negative, indicating that the new line crosses the y-axis below the origin.
5. Visualize the Shift:
The original line was at (0, b), and now it has moved to (0, -b). This represents a downward shift of 2b units from the original position because it moves from b (above the x-axis) to −b (below the x-axis).
6. Conclusion:
Therefore, the graph of the line shifts down by 2b units when the sign of b is reversed.
Final Answer:
The new line will be shifted down 2b units.
The original equation is given as y=mx+b, where m is the slope and b is the y-intercept. The y-intercept is the point where the line crosses the y-axis.
Since b>0, the line crosses the y-axis above the origin (0,0). This means the point (0, b) is above the x-axis.
When we reverse the sign of b, we replace it with −b. The new equation becomes y=mx−b.
In the new equation y=mx−b, the y-intercept is now at the point (0, -b). Since b is positive, −b will be negative, indicating that the new line crosses the y-axis below the origin.
The original line was at (0, b), and now it has moved to (0, -b). This represents a downward shift of 2b units from the original position because it moves from b (above the x-axis) to −b (below the x-axis).
Therefore, the graph of the line shifts down by 2b units when the sign of b is reversed.
The new line will be shifted down 2b units.
Topper's Solved these Questions
- BOOK - KAPLANCHAPTER - LINEAR EQUATIONS AND GRAPHSEXERCISE - SOLVING EQUATIONS1videos
LINEAR EQUATIONS AND GRAPHS
- BOOK - KAPLANCHAPTER - LINEAR EQUATIONS AND GRAPHSEXERCISE - WORD PROBLEMS1videos
LINEAR EQUATIONS AND GRAPHS
- BOOK - KAPLANCHAPTER - LINEAR EQUATIONS AND GRAPHSEXERCISE - LINEAR GRAPH1videos
LINEAR EQUATIONS AND GRAPHS
- BOOK - KAPLANCHAPTER - INEQUALITIESEXERCISE - MODELING REAL-LIFE SITUATIONS WITH INEQUALITIES1videos
INEQUALITIES
- BOOK - KAPLANCHAPTER - PAIRED PASSAGES AND PRIMARY SOURCE PASSAGES EXERCISE - HOW MUCH HAVE YOU LEARNED11videos
PAIRED PASSAGES AND PRIMARY SOURCE PASSAGES
Similar Questions
Knowledge Check
- Question 1 - Select One
Which of the following graphs represents the soution set for 5x−10y>6 ?
A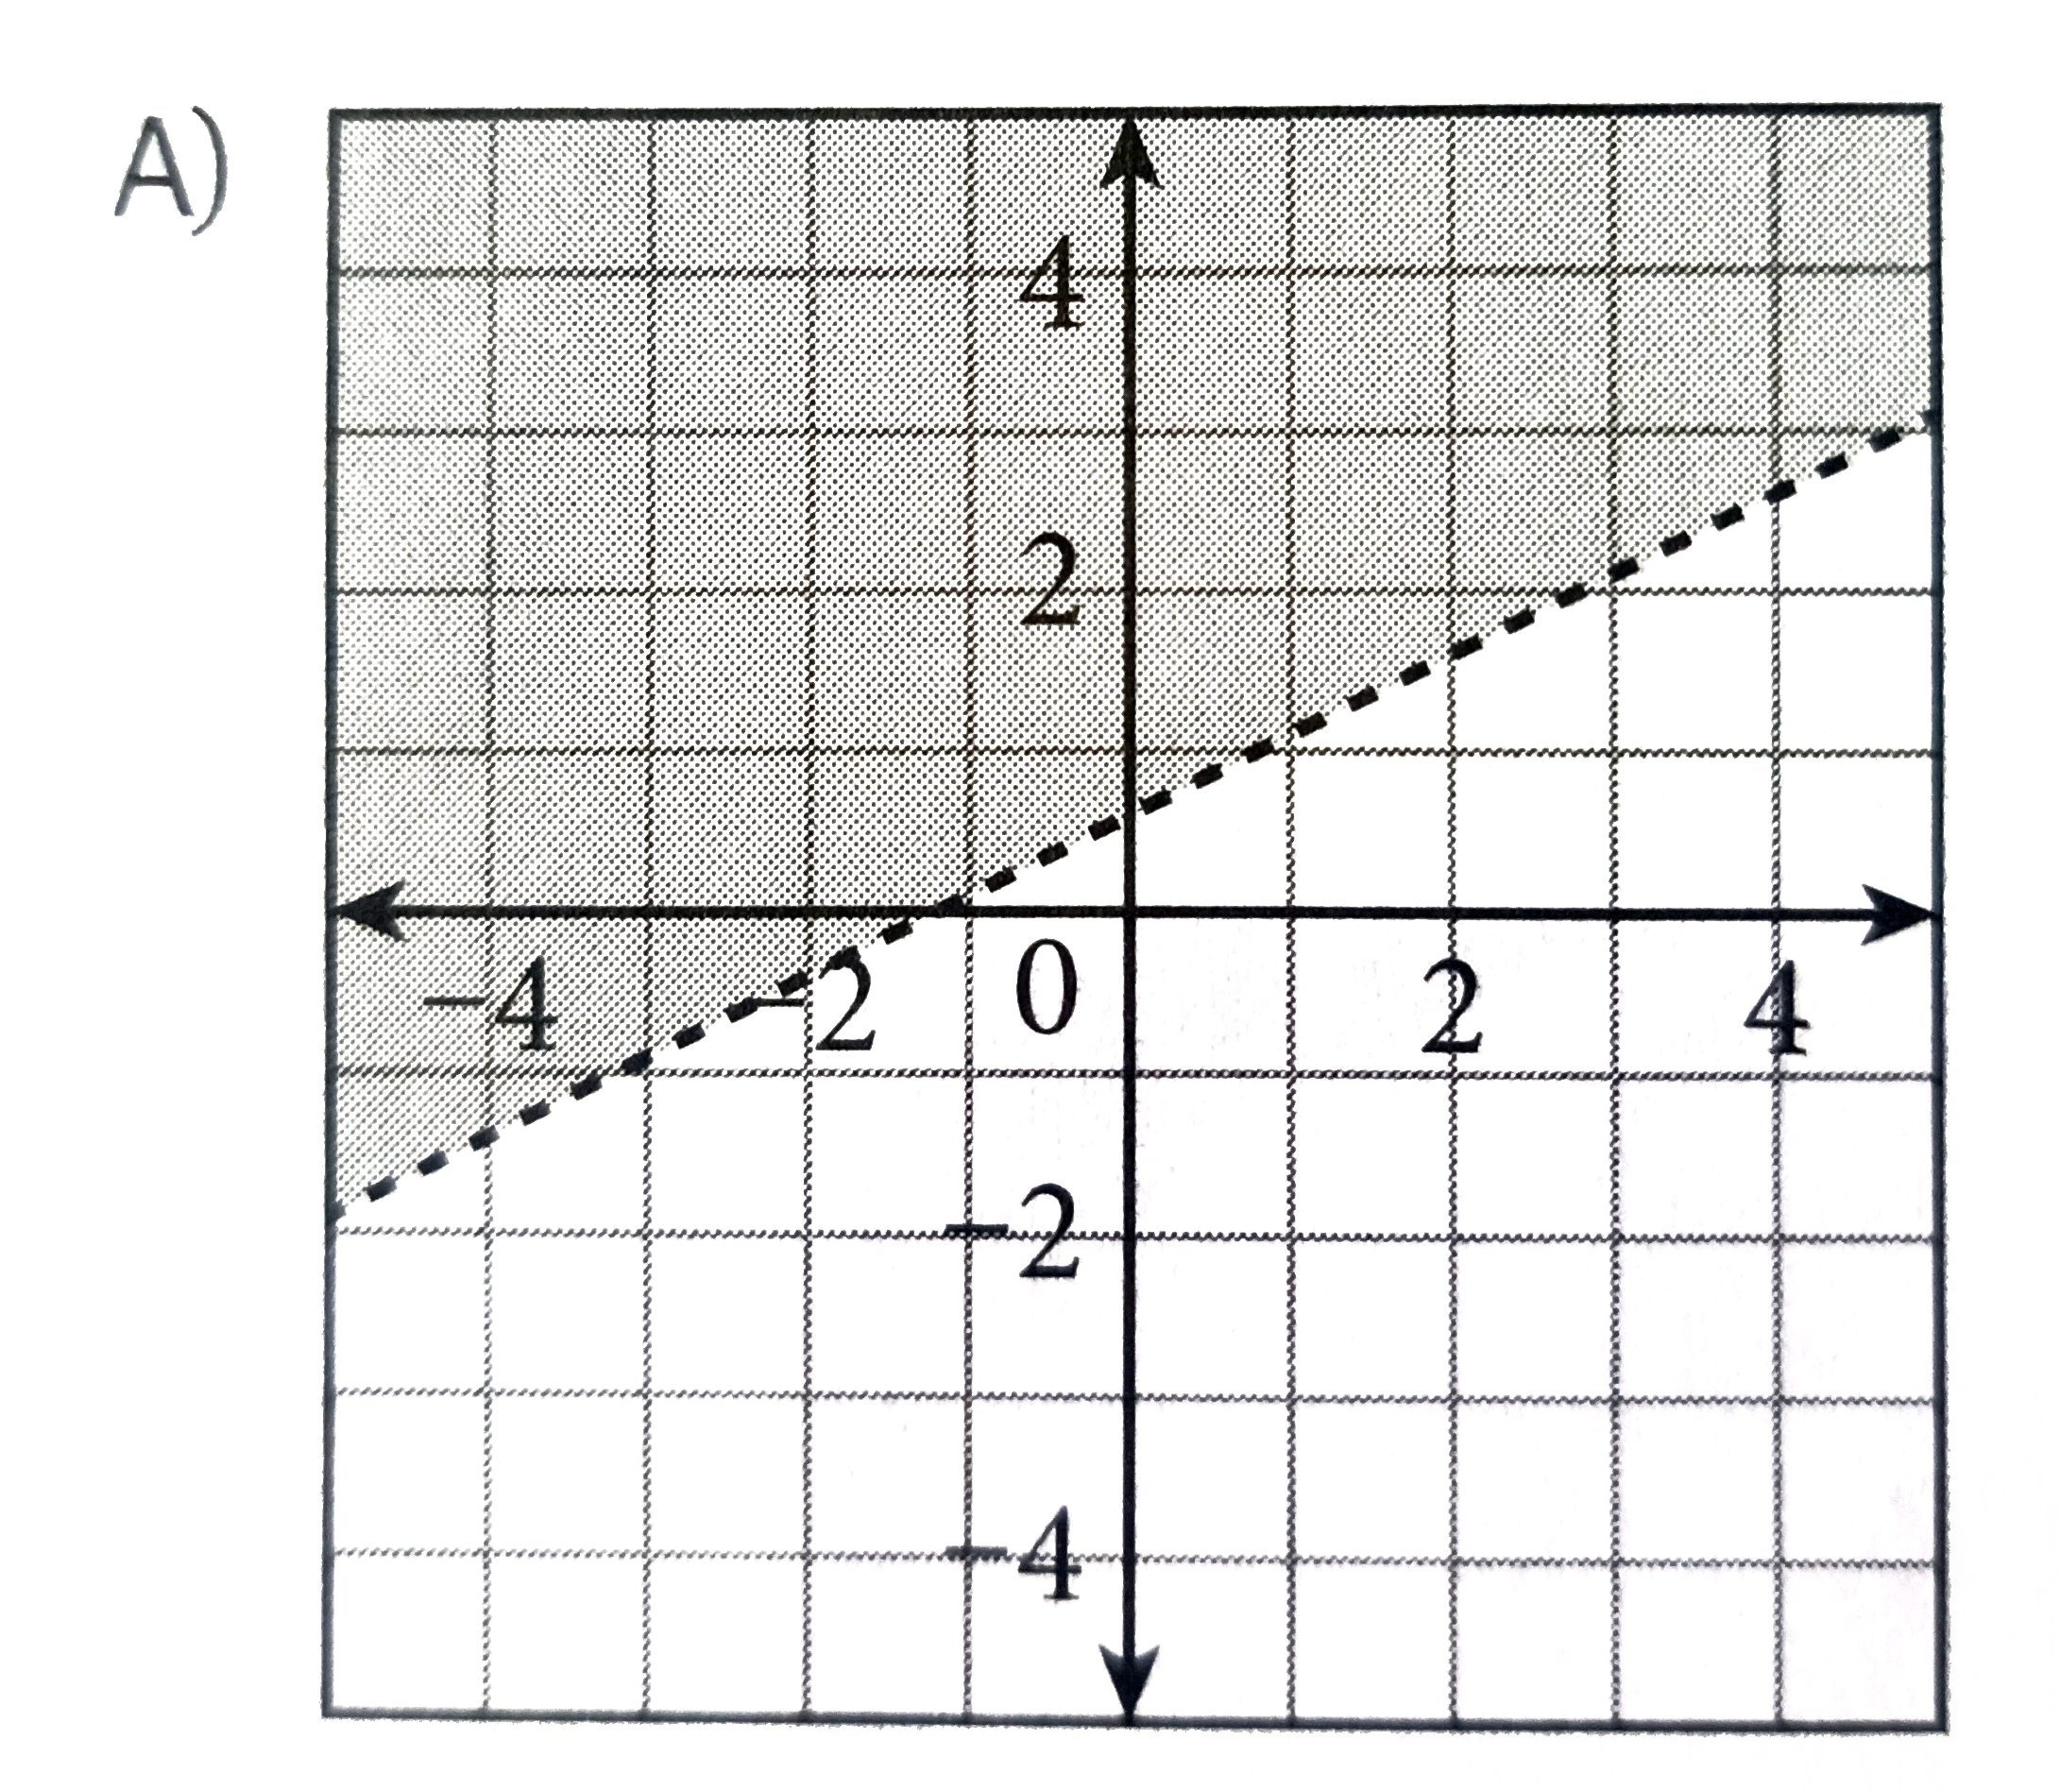 B
B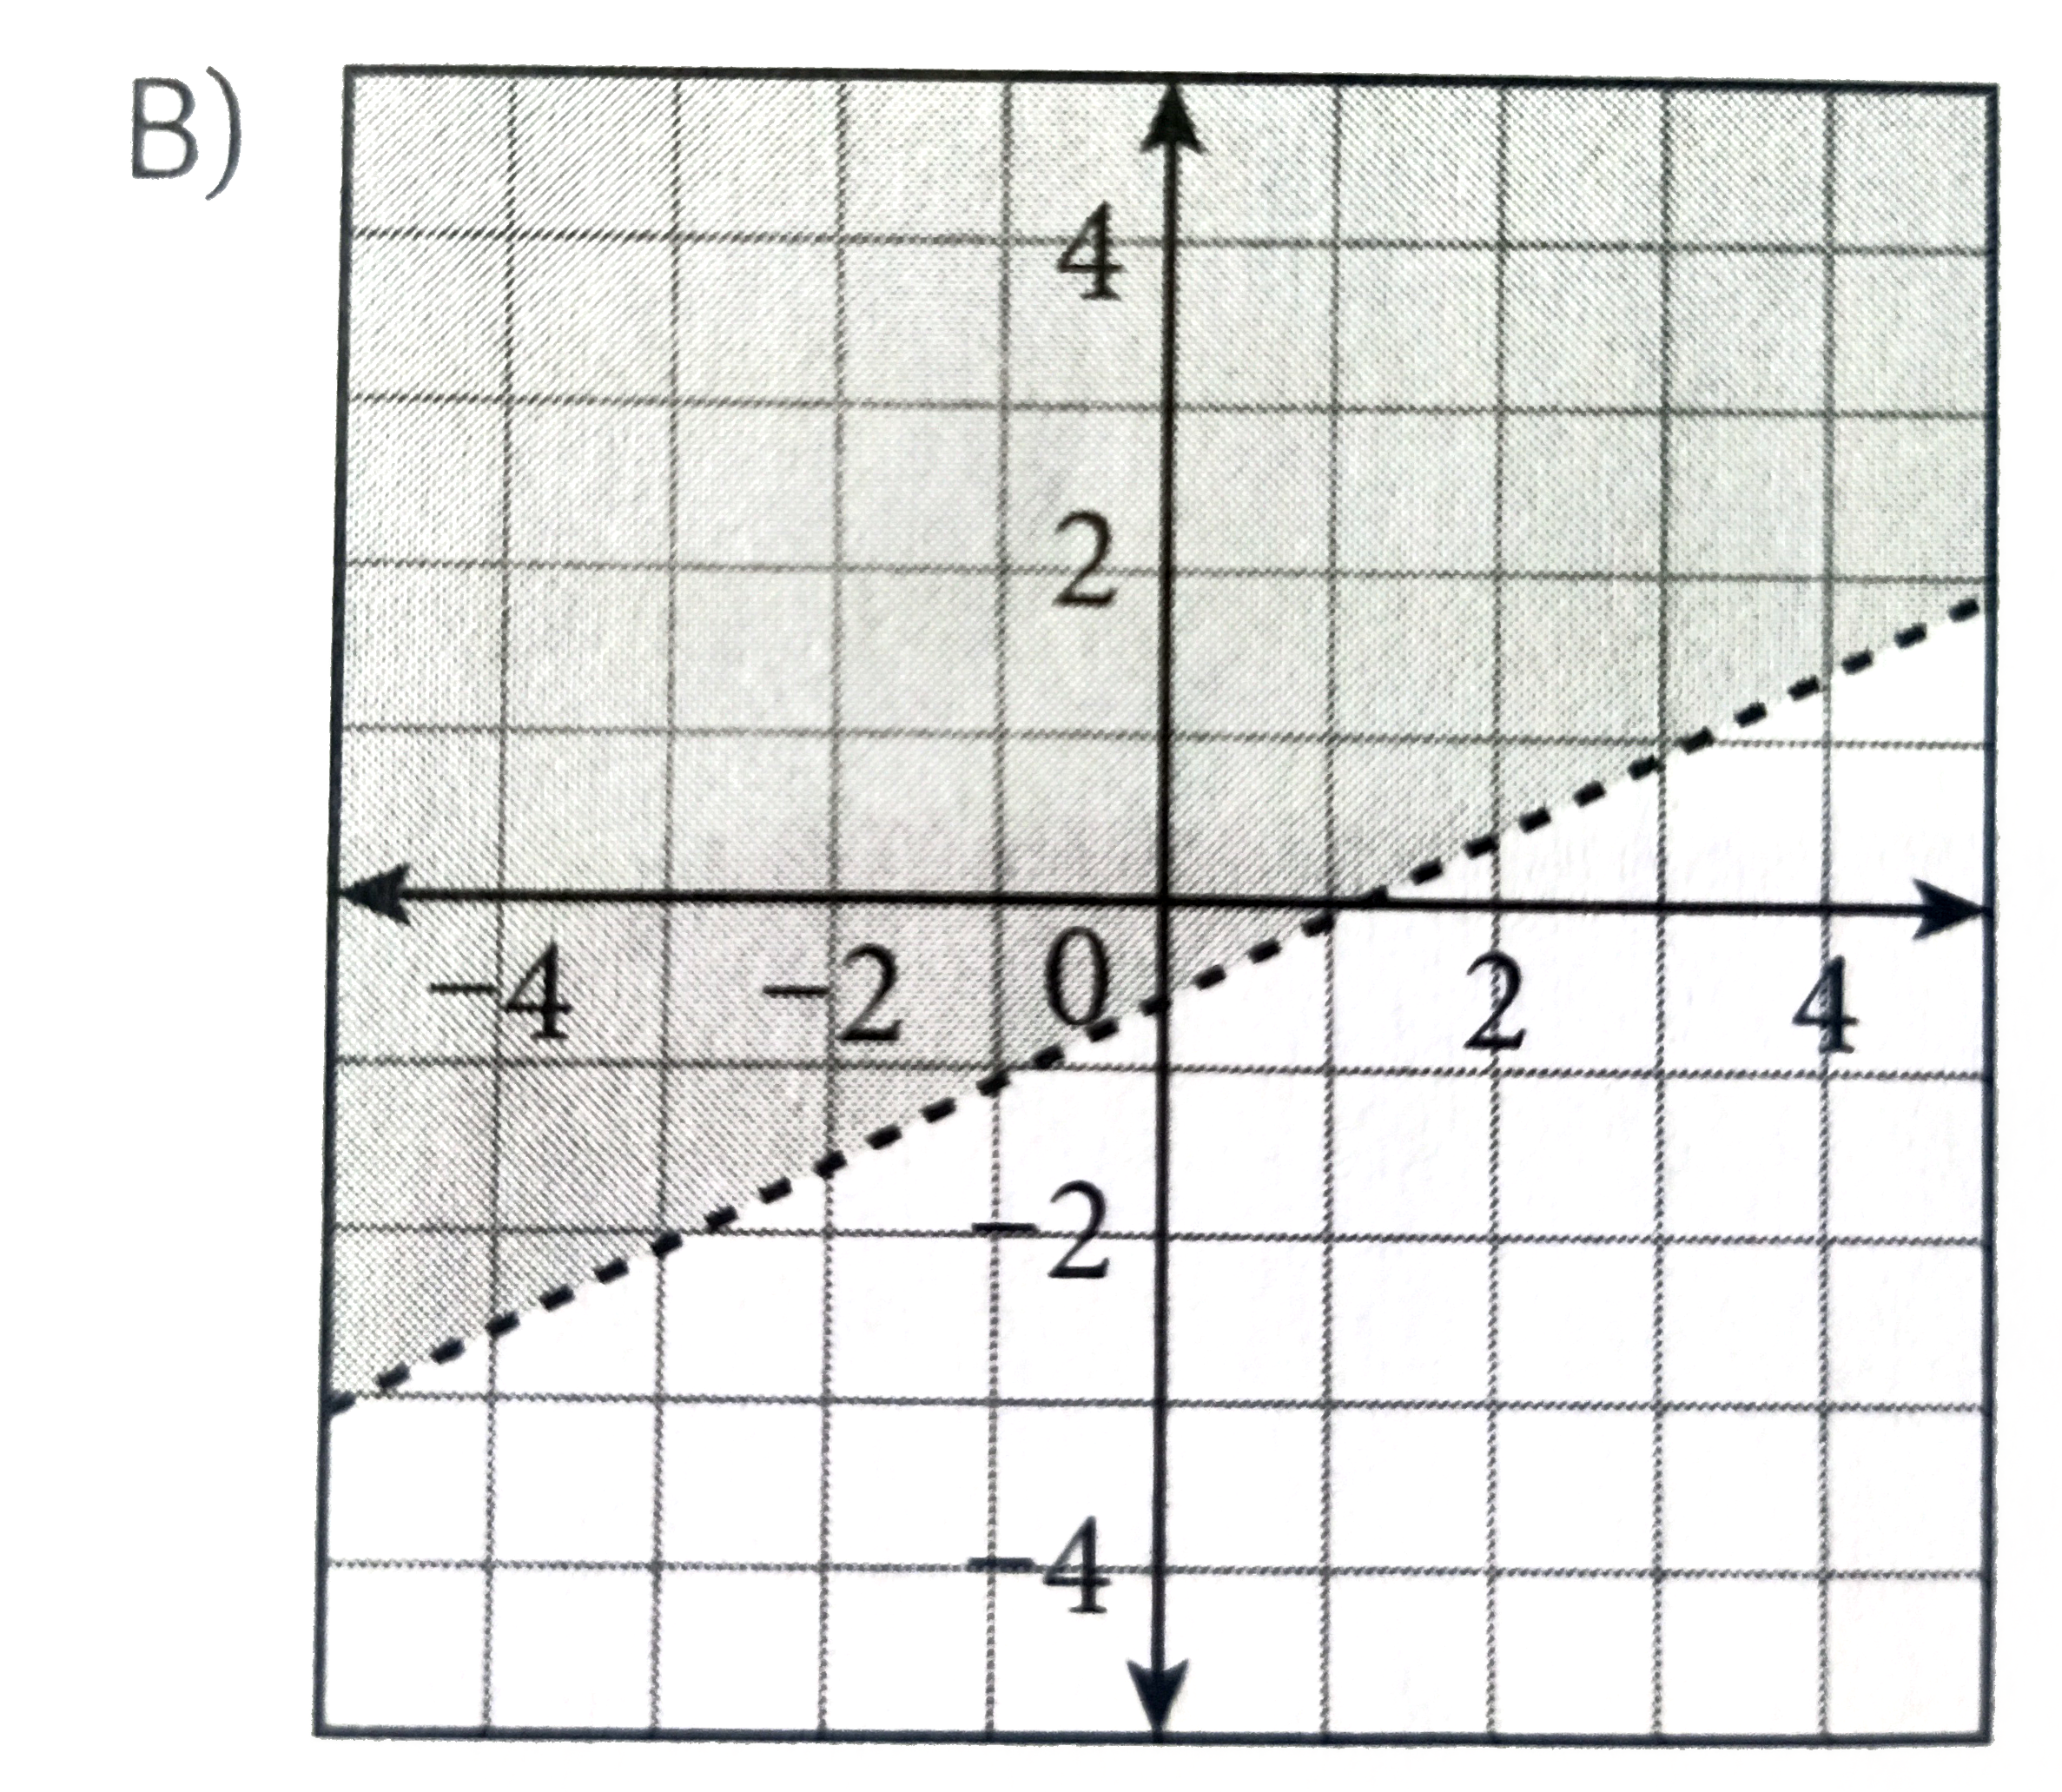 C
C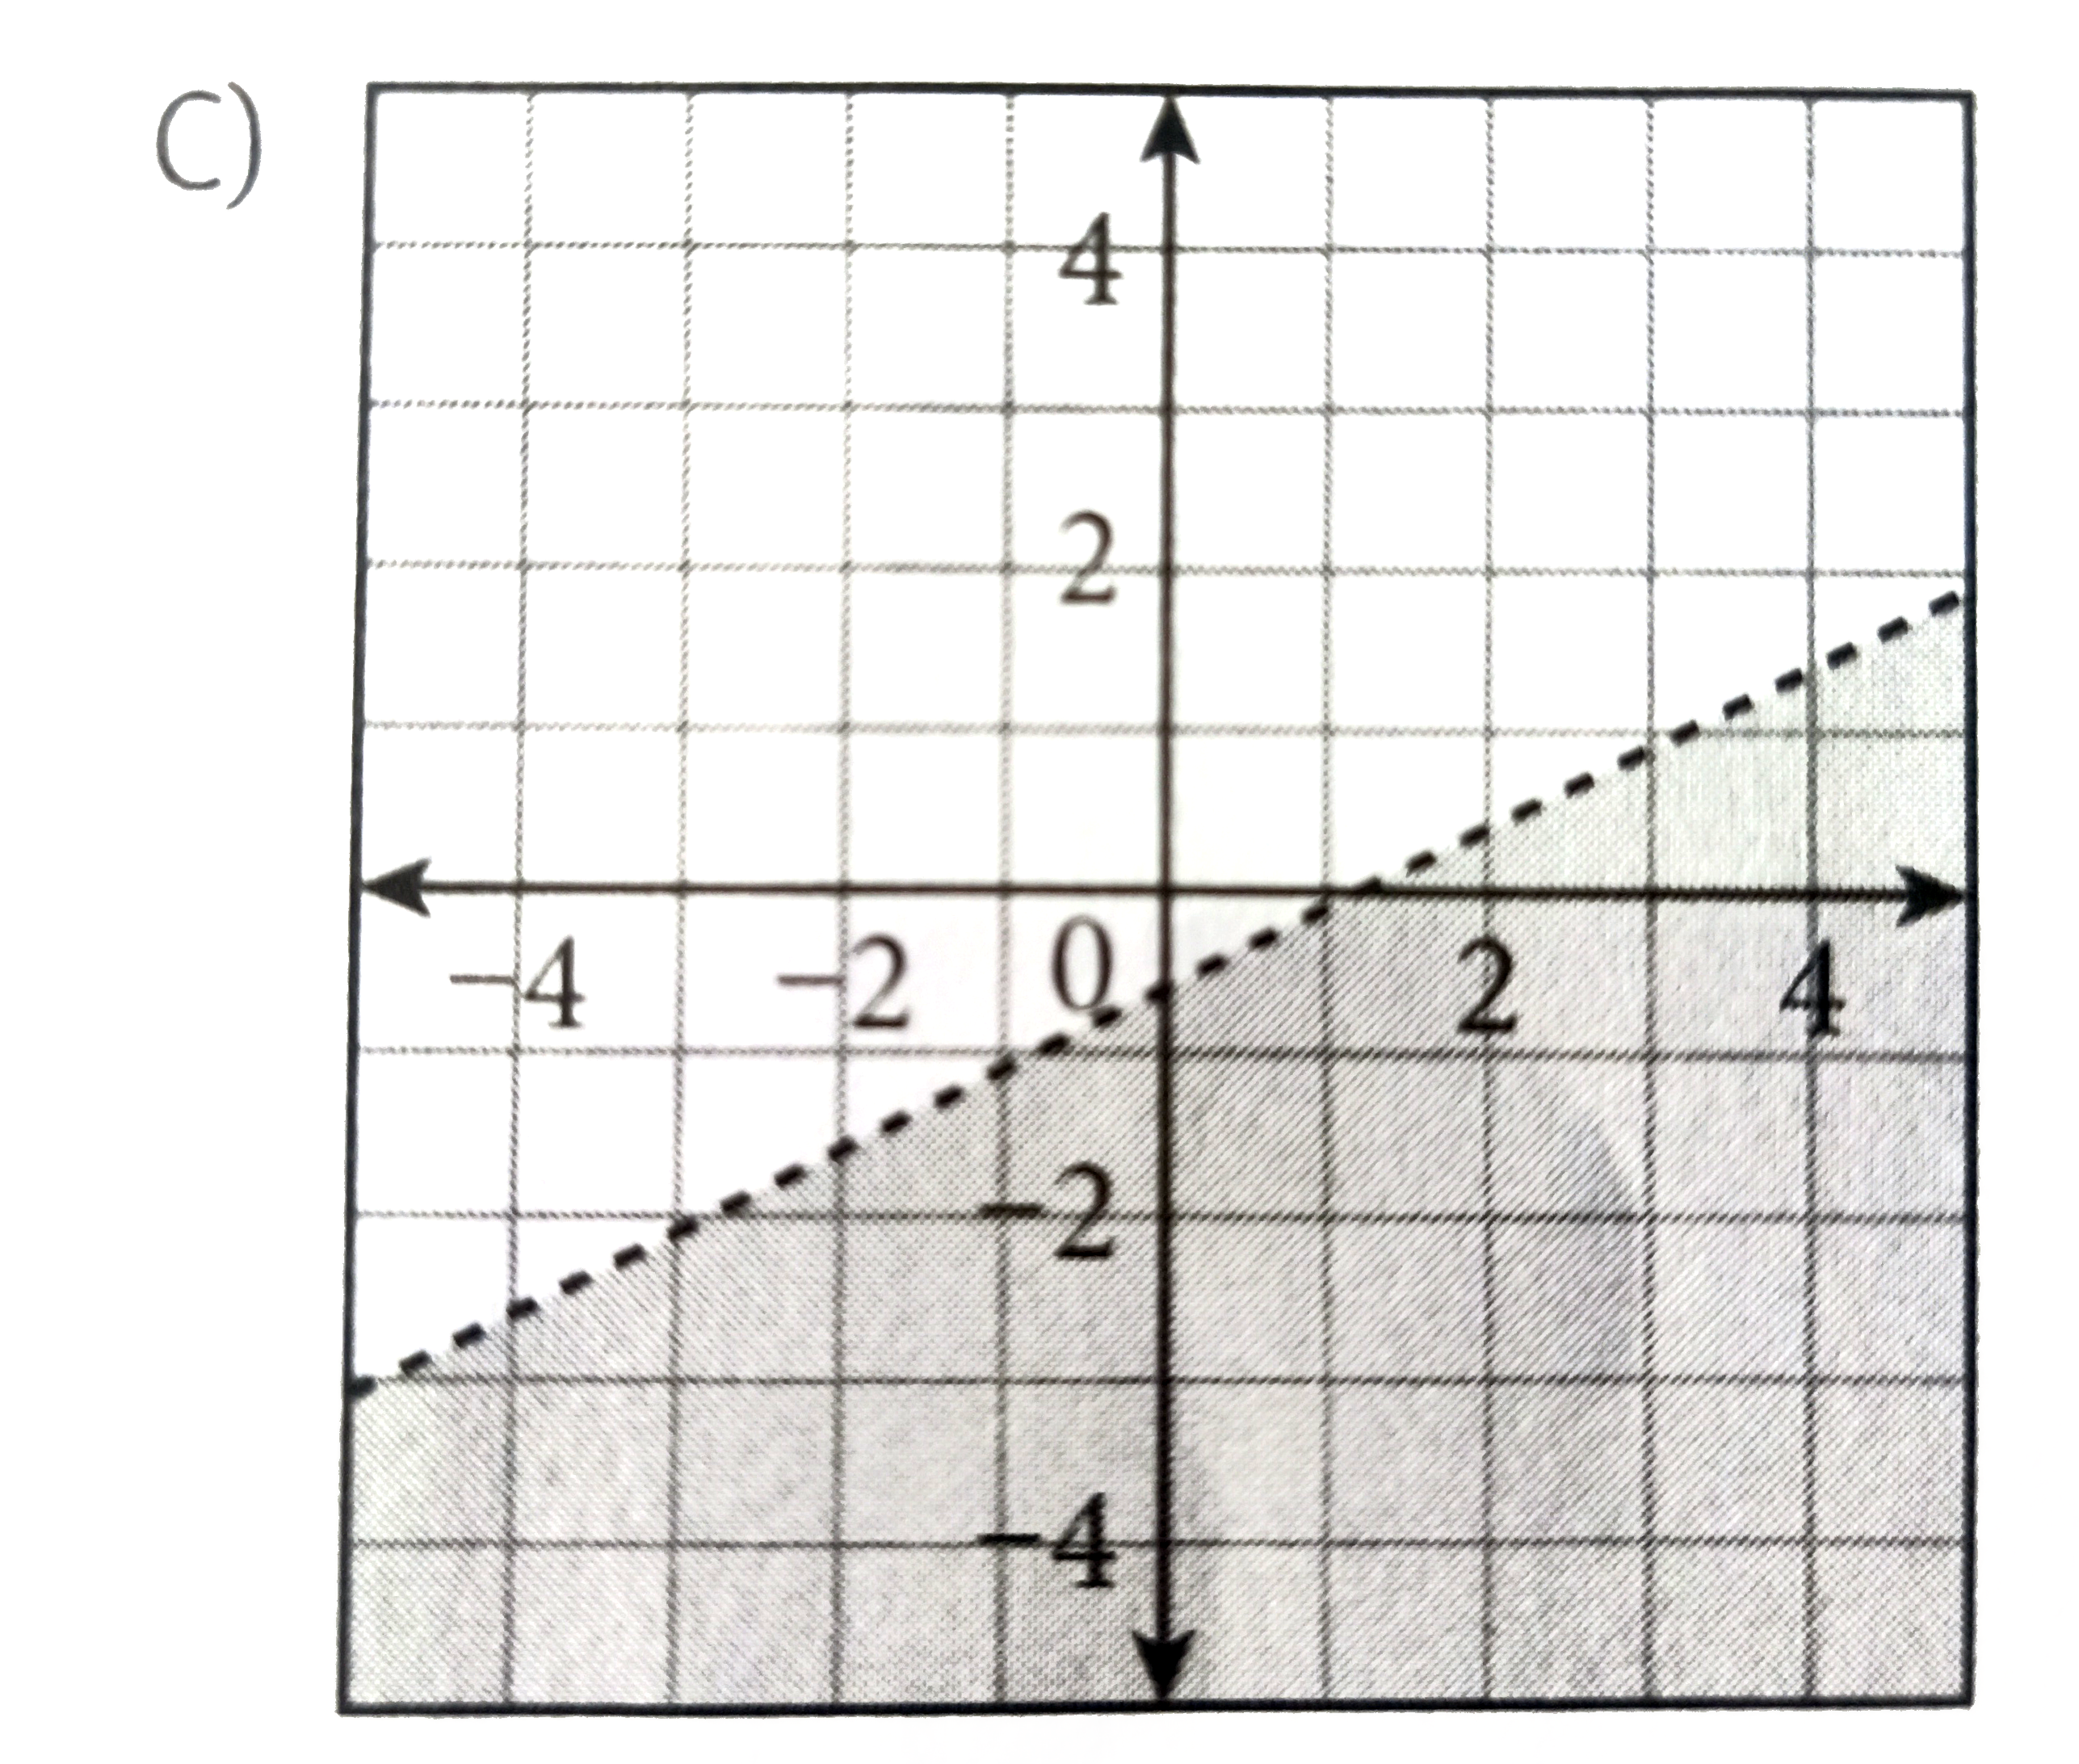 D
D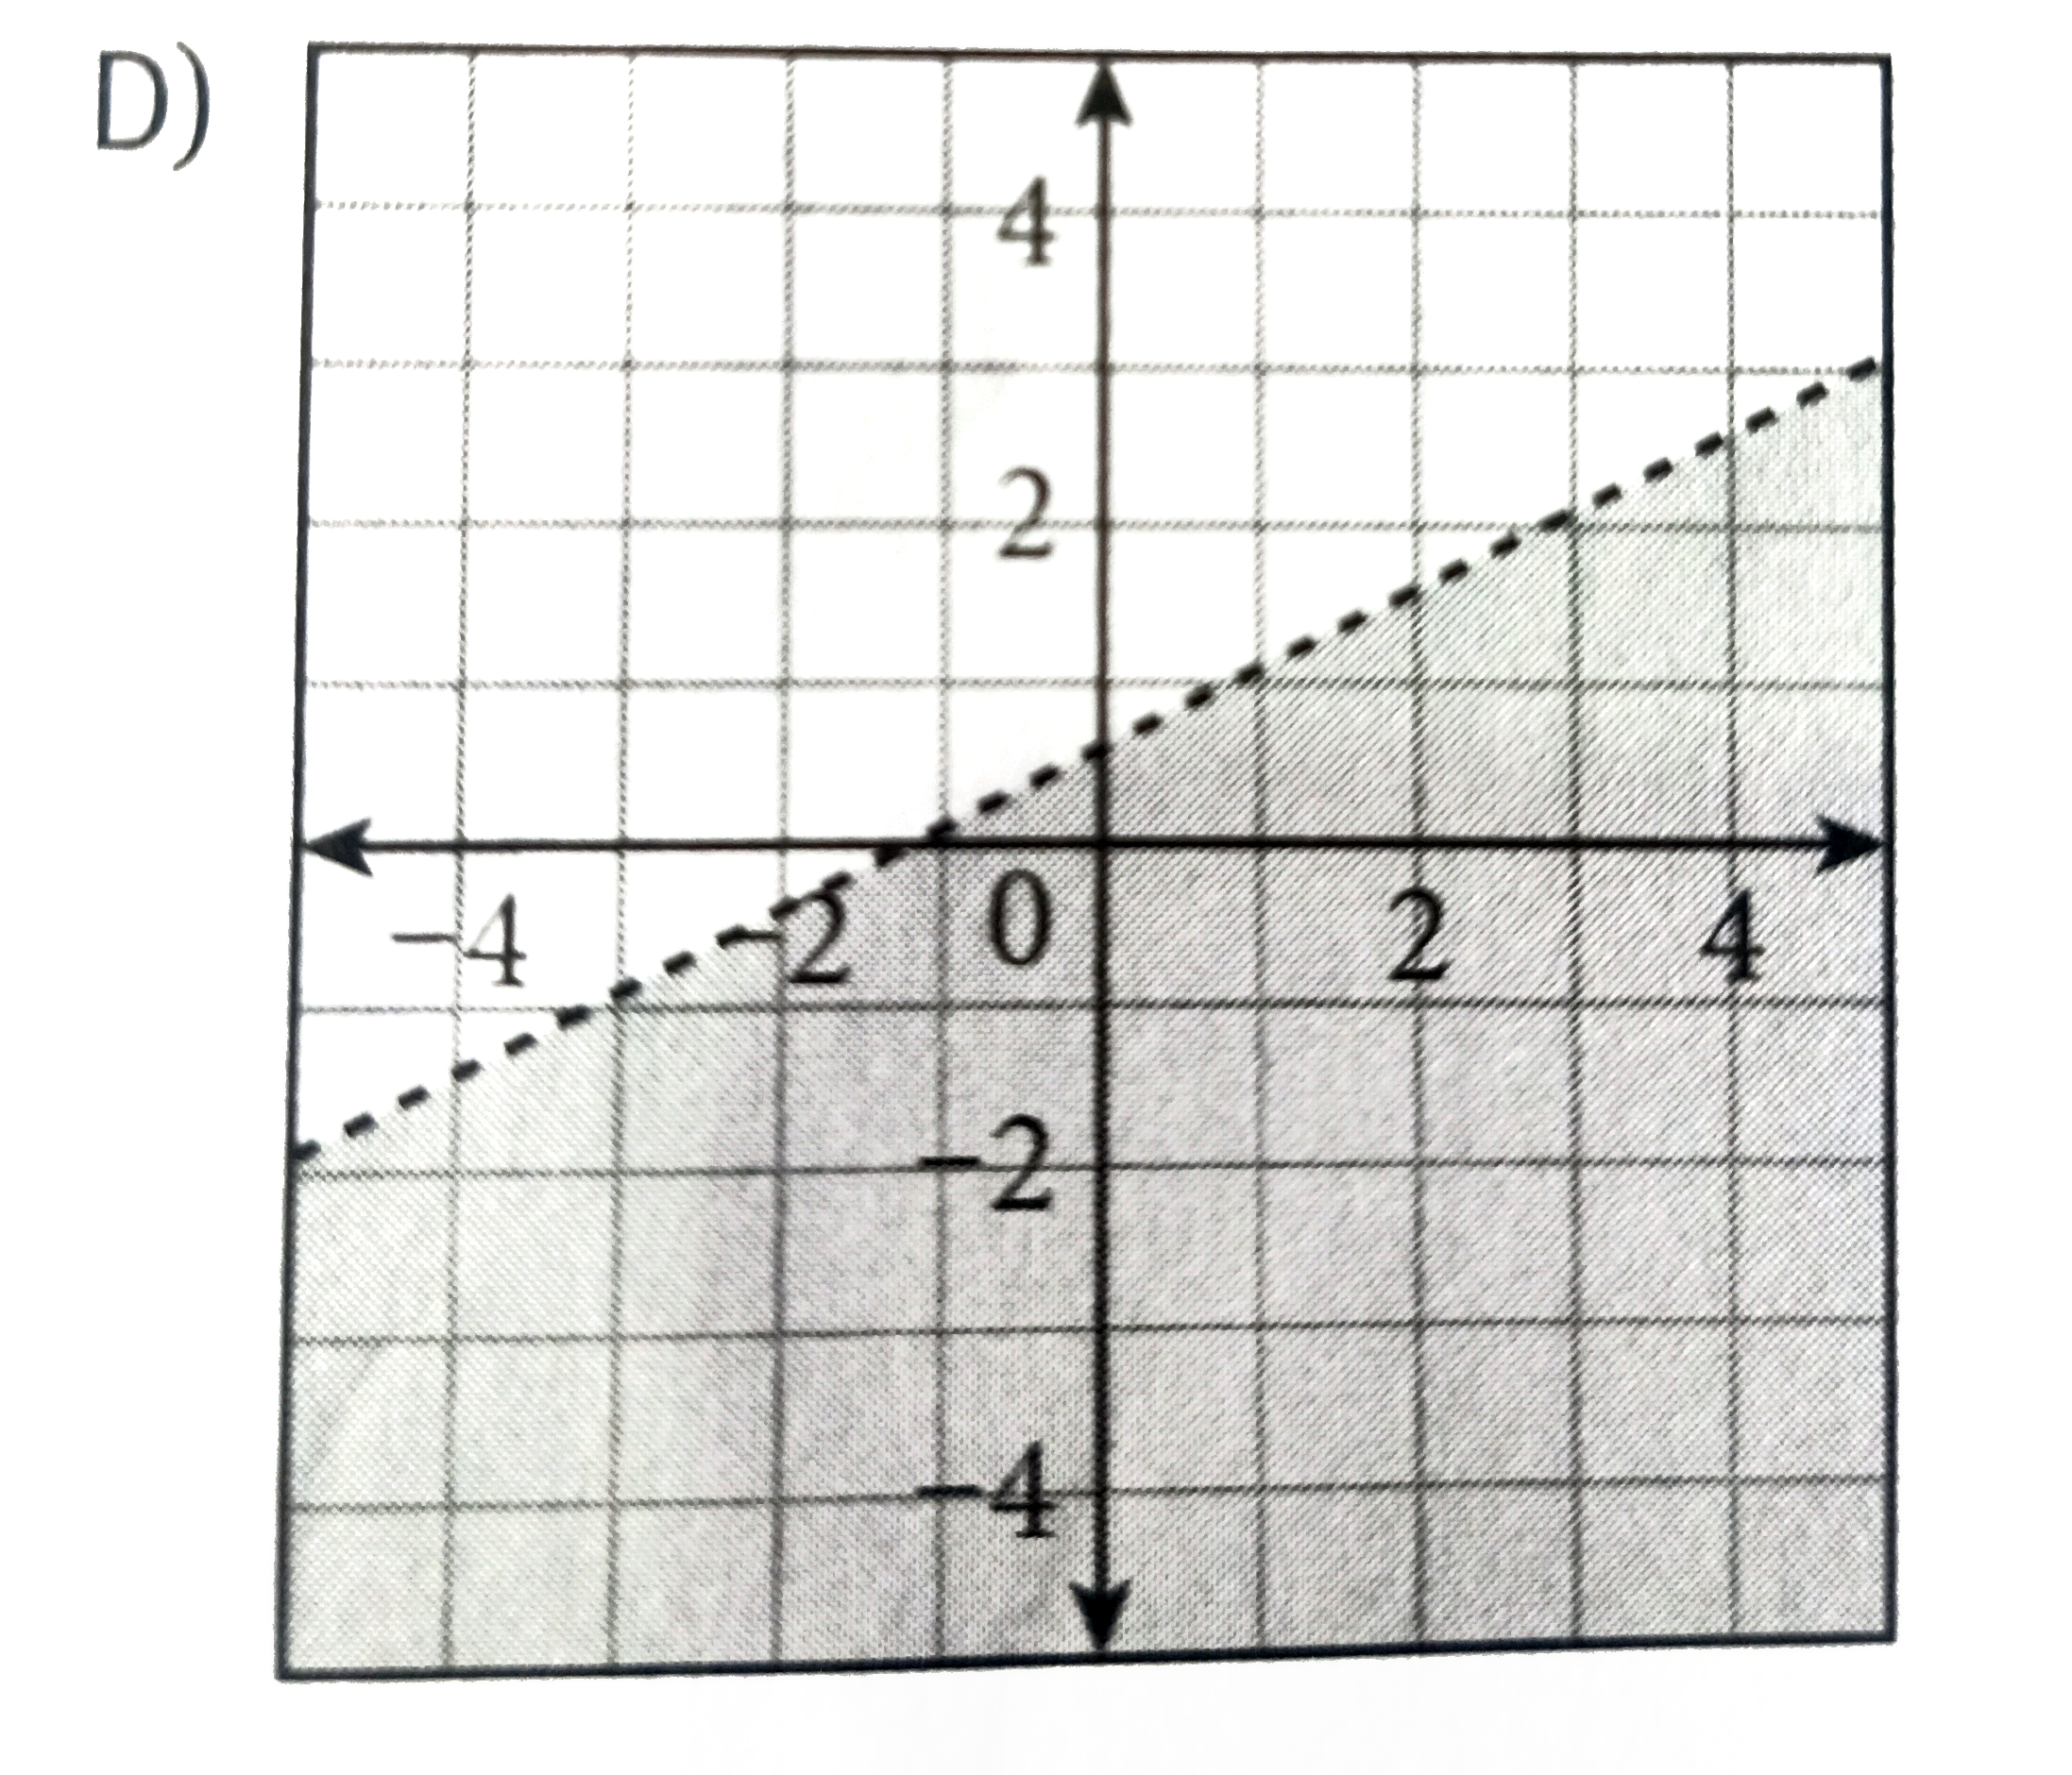
- Question 2 - Select One
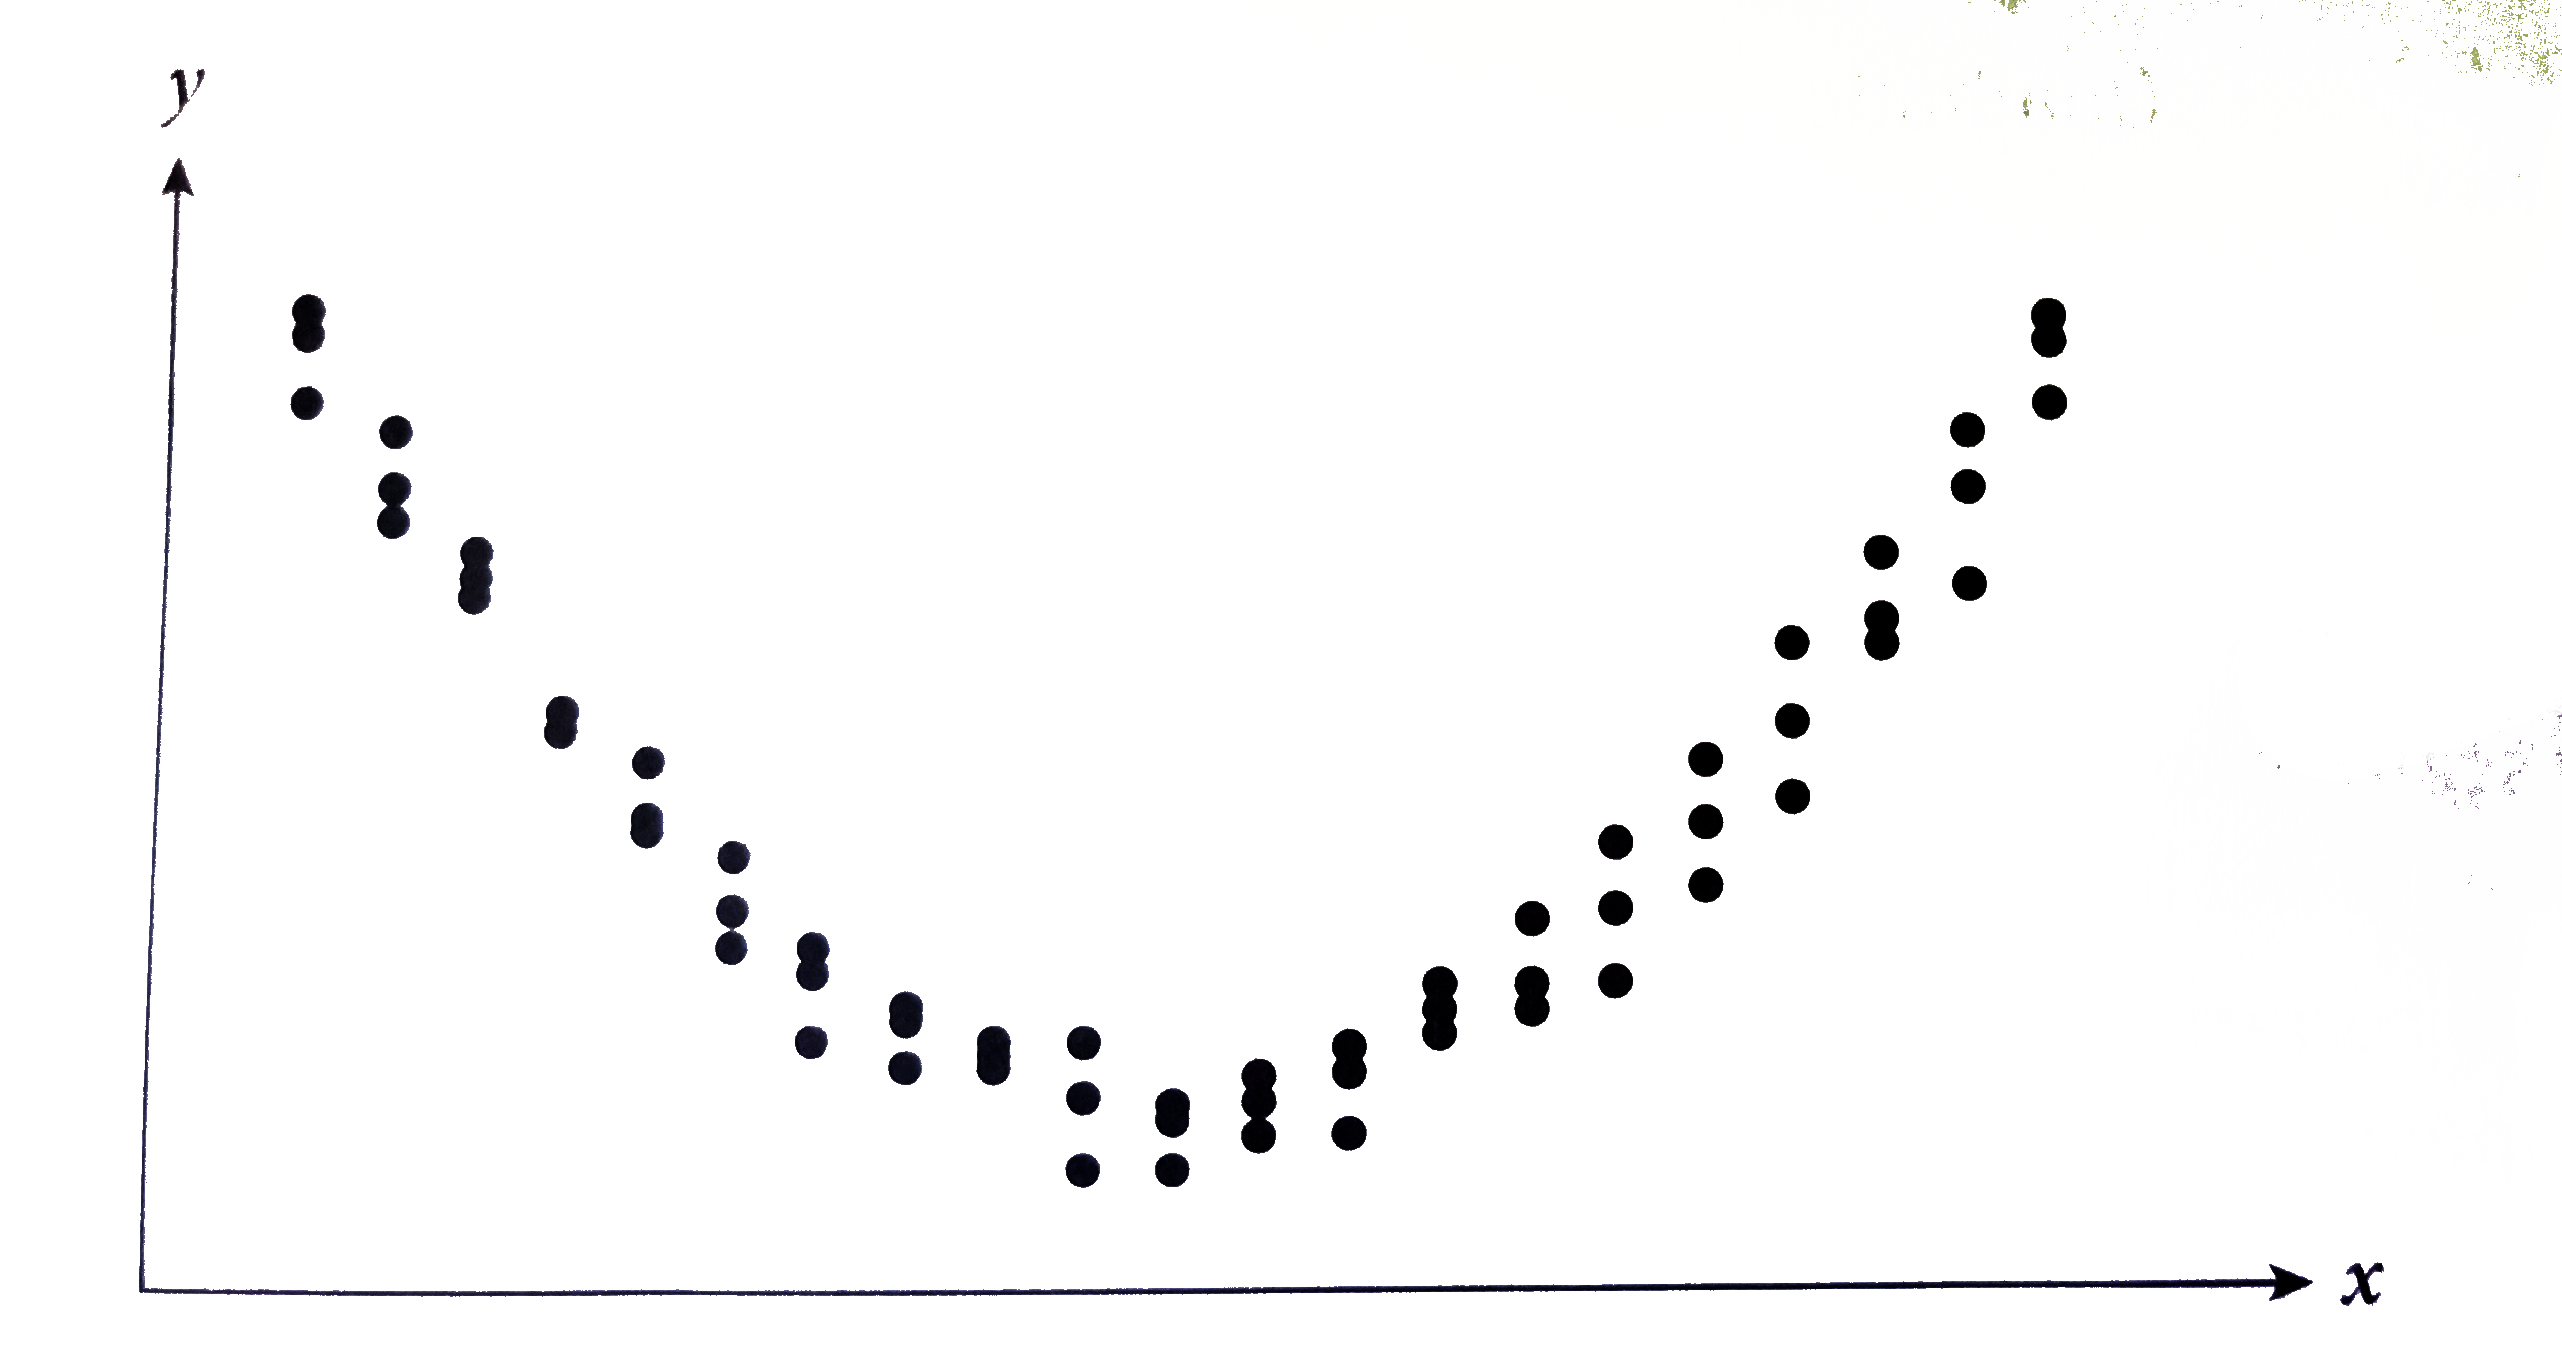
Given that a,b, and c are constants and that a>0, which of the following is the equation for the line of best fit for the above scatterplot ?Ay=ax+bBy=abxCy=−ax2+bx+cDy=ax2+bx+c - Question 3 - Select One
Which of the following is best modeled using a linear regression equation, y=ax+b, where a<0?
A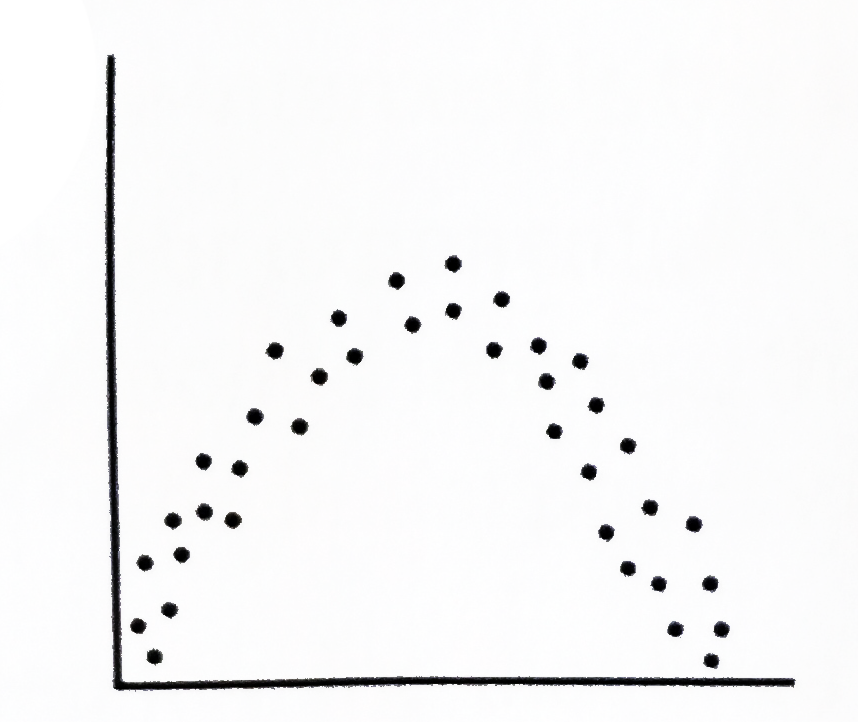 B
B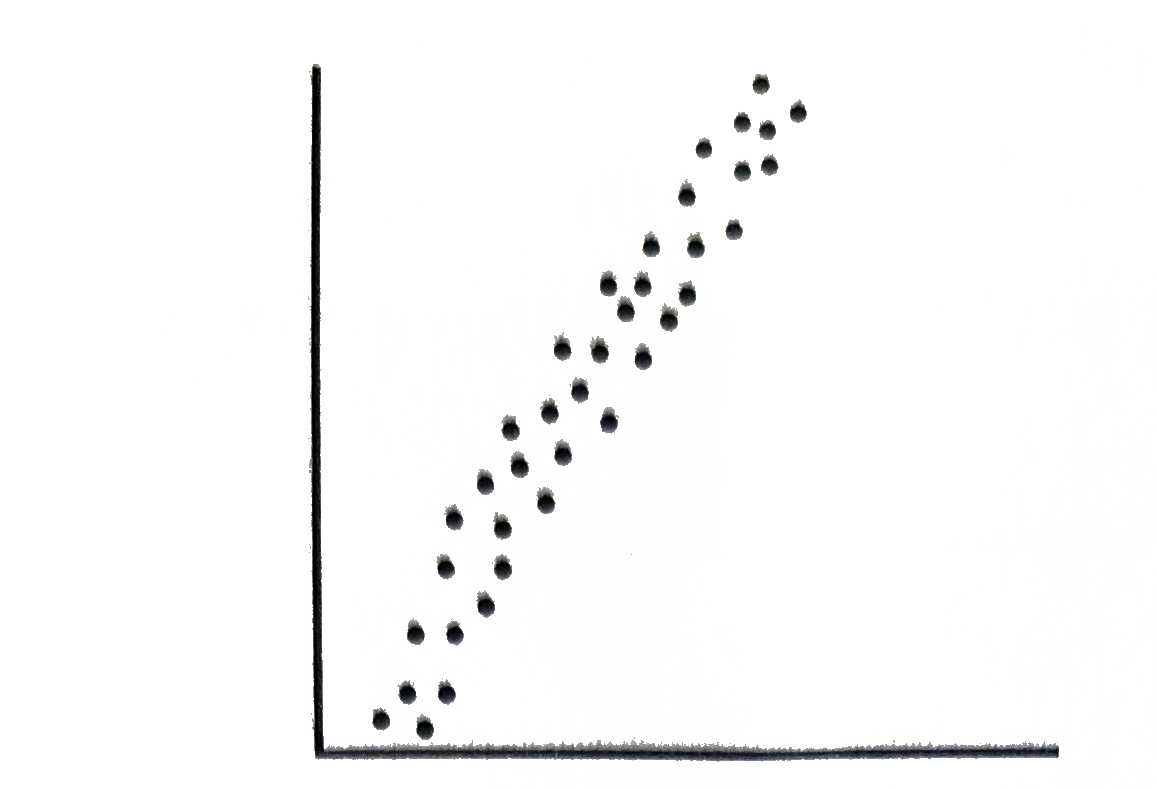 C
C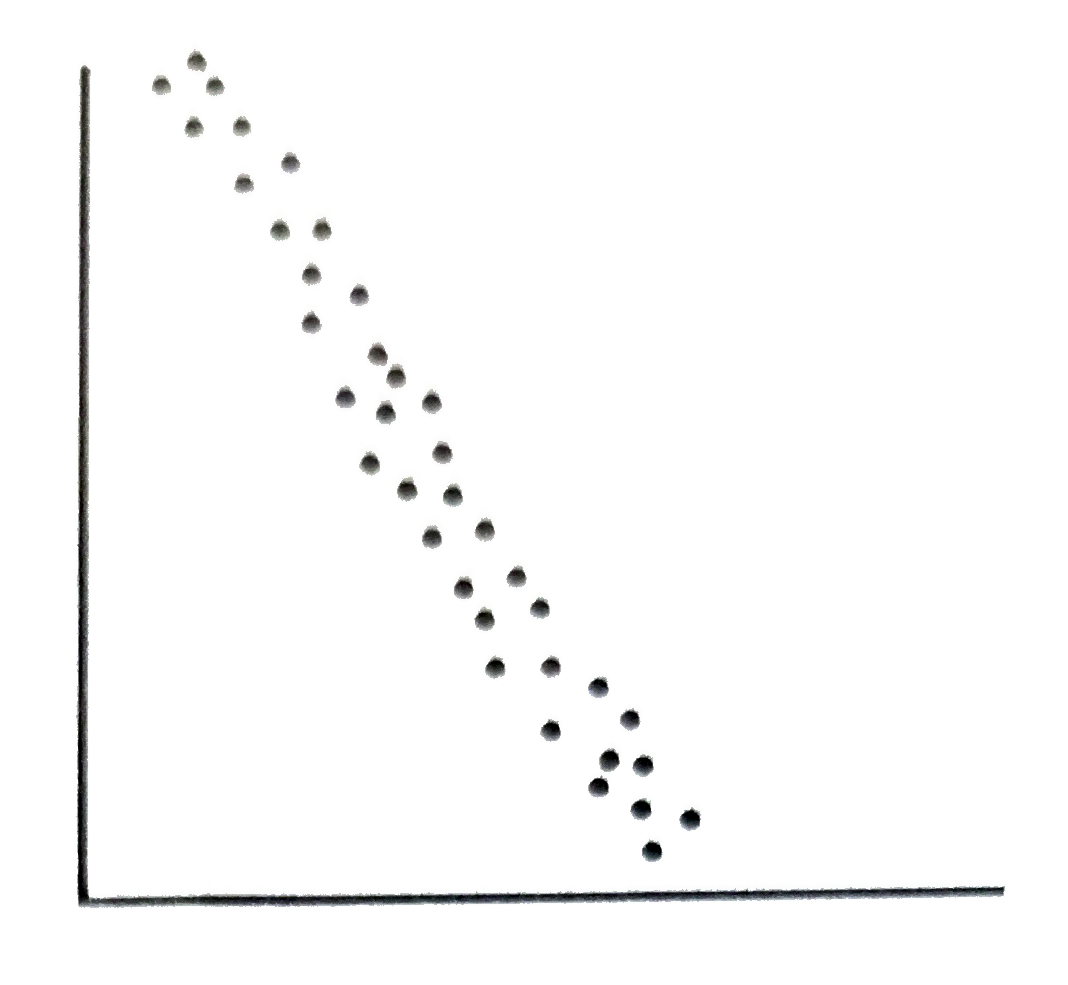 D
D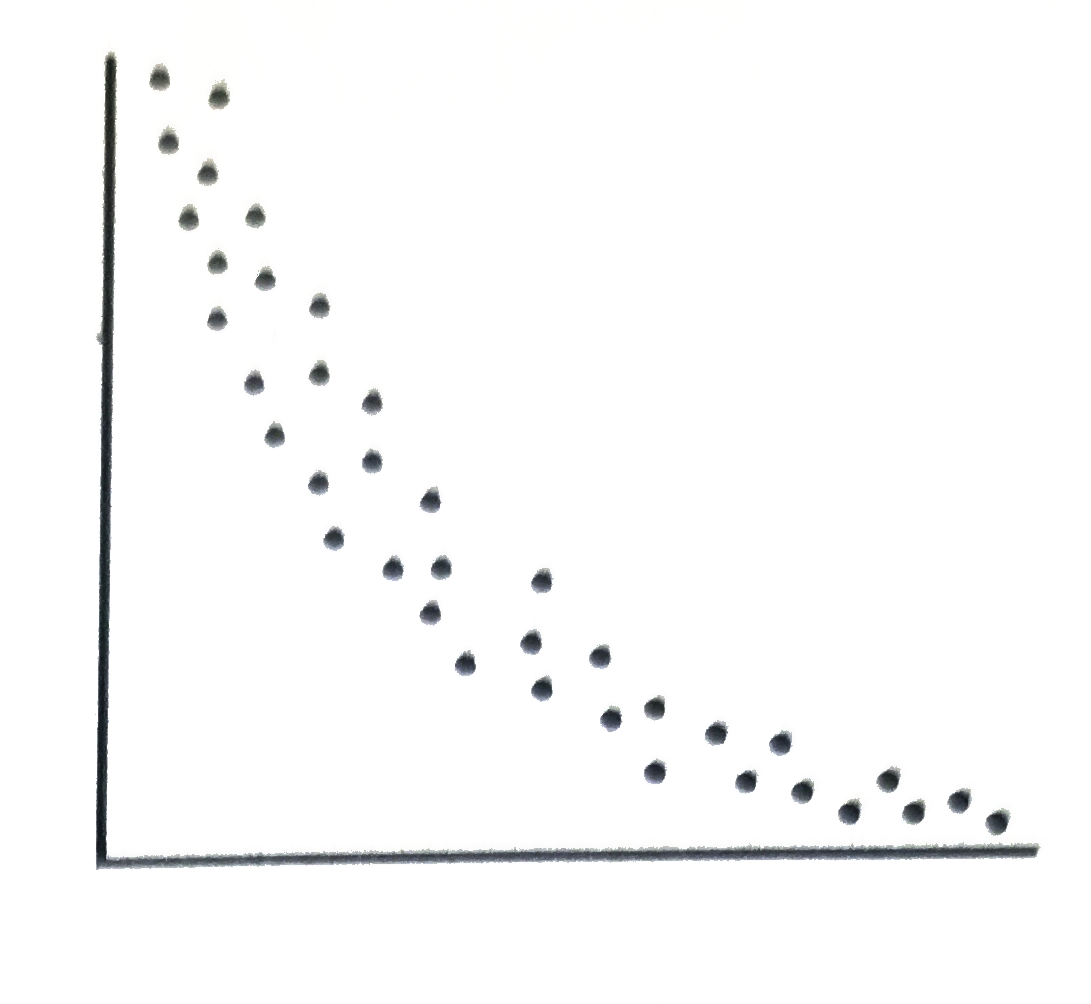
Put the equation xa+yb=1 to the slope intercept form and find its slope and y-intercept
View SolutionThe ratio of velocities represented by lines A and B in the graph below is
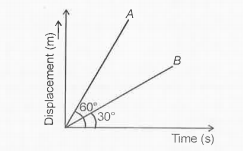 View Solution
Whenever a>0 , which of the following number line graphs represents the solutions for x to the inequality |x−a|≤3 ?
View SolutionThe graph of the linear function f has intercepts at (a,0) and (0, b) in the xy-plane. If a+b=0 and a≠b, which of the following is true about the slope of the graph of f ?
View SolutionWhen graphed in the standard (x, y) coordinate plane, which of the following equations does NOT represent a line?
View Solution


