The formation of the oxide MxOyper mole of O2 cinsumed is written a 2xyM(S)+O2(g)→2yMxOy the free energy change of the reaction is given by ?G=?H-T?S.
if the ethalpychange?H and ethropy change ?S are assumed to be indendent of temperature the plot of ?G versus T is liner such as shown in th efollowing figure known as Ellingham diagram Figure known a sEllingham diagram Figure is widely used to discuss th priciple ionvolves in the extraction of metal from its oxide.
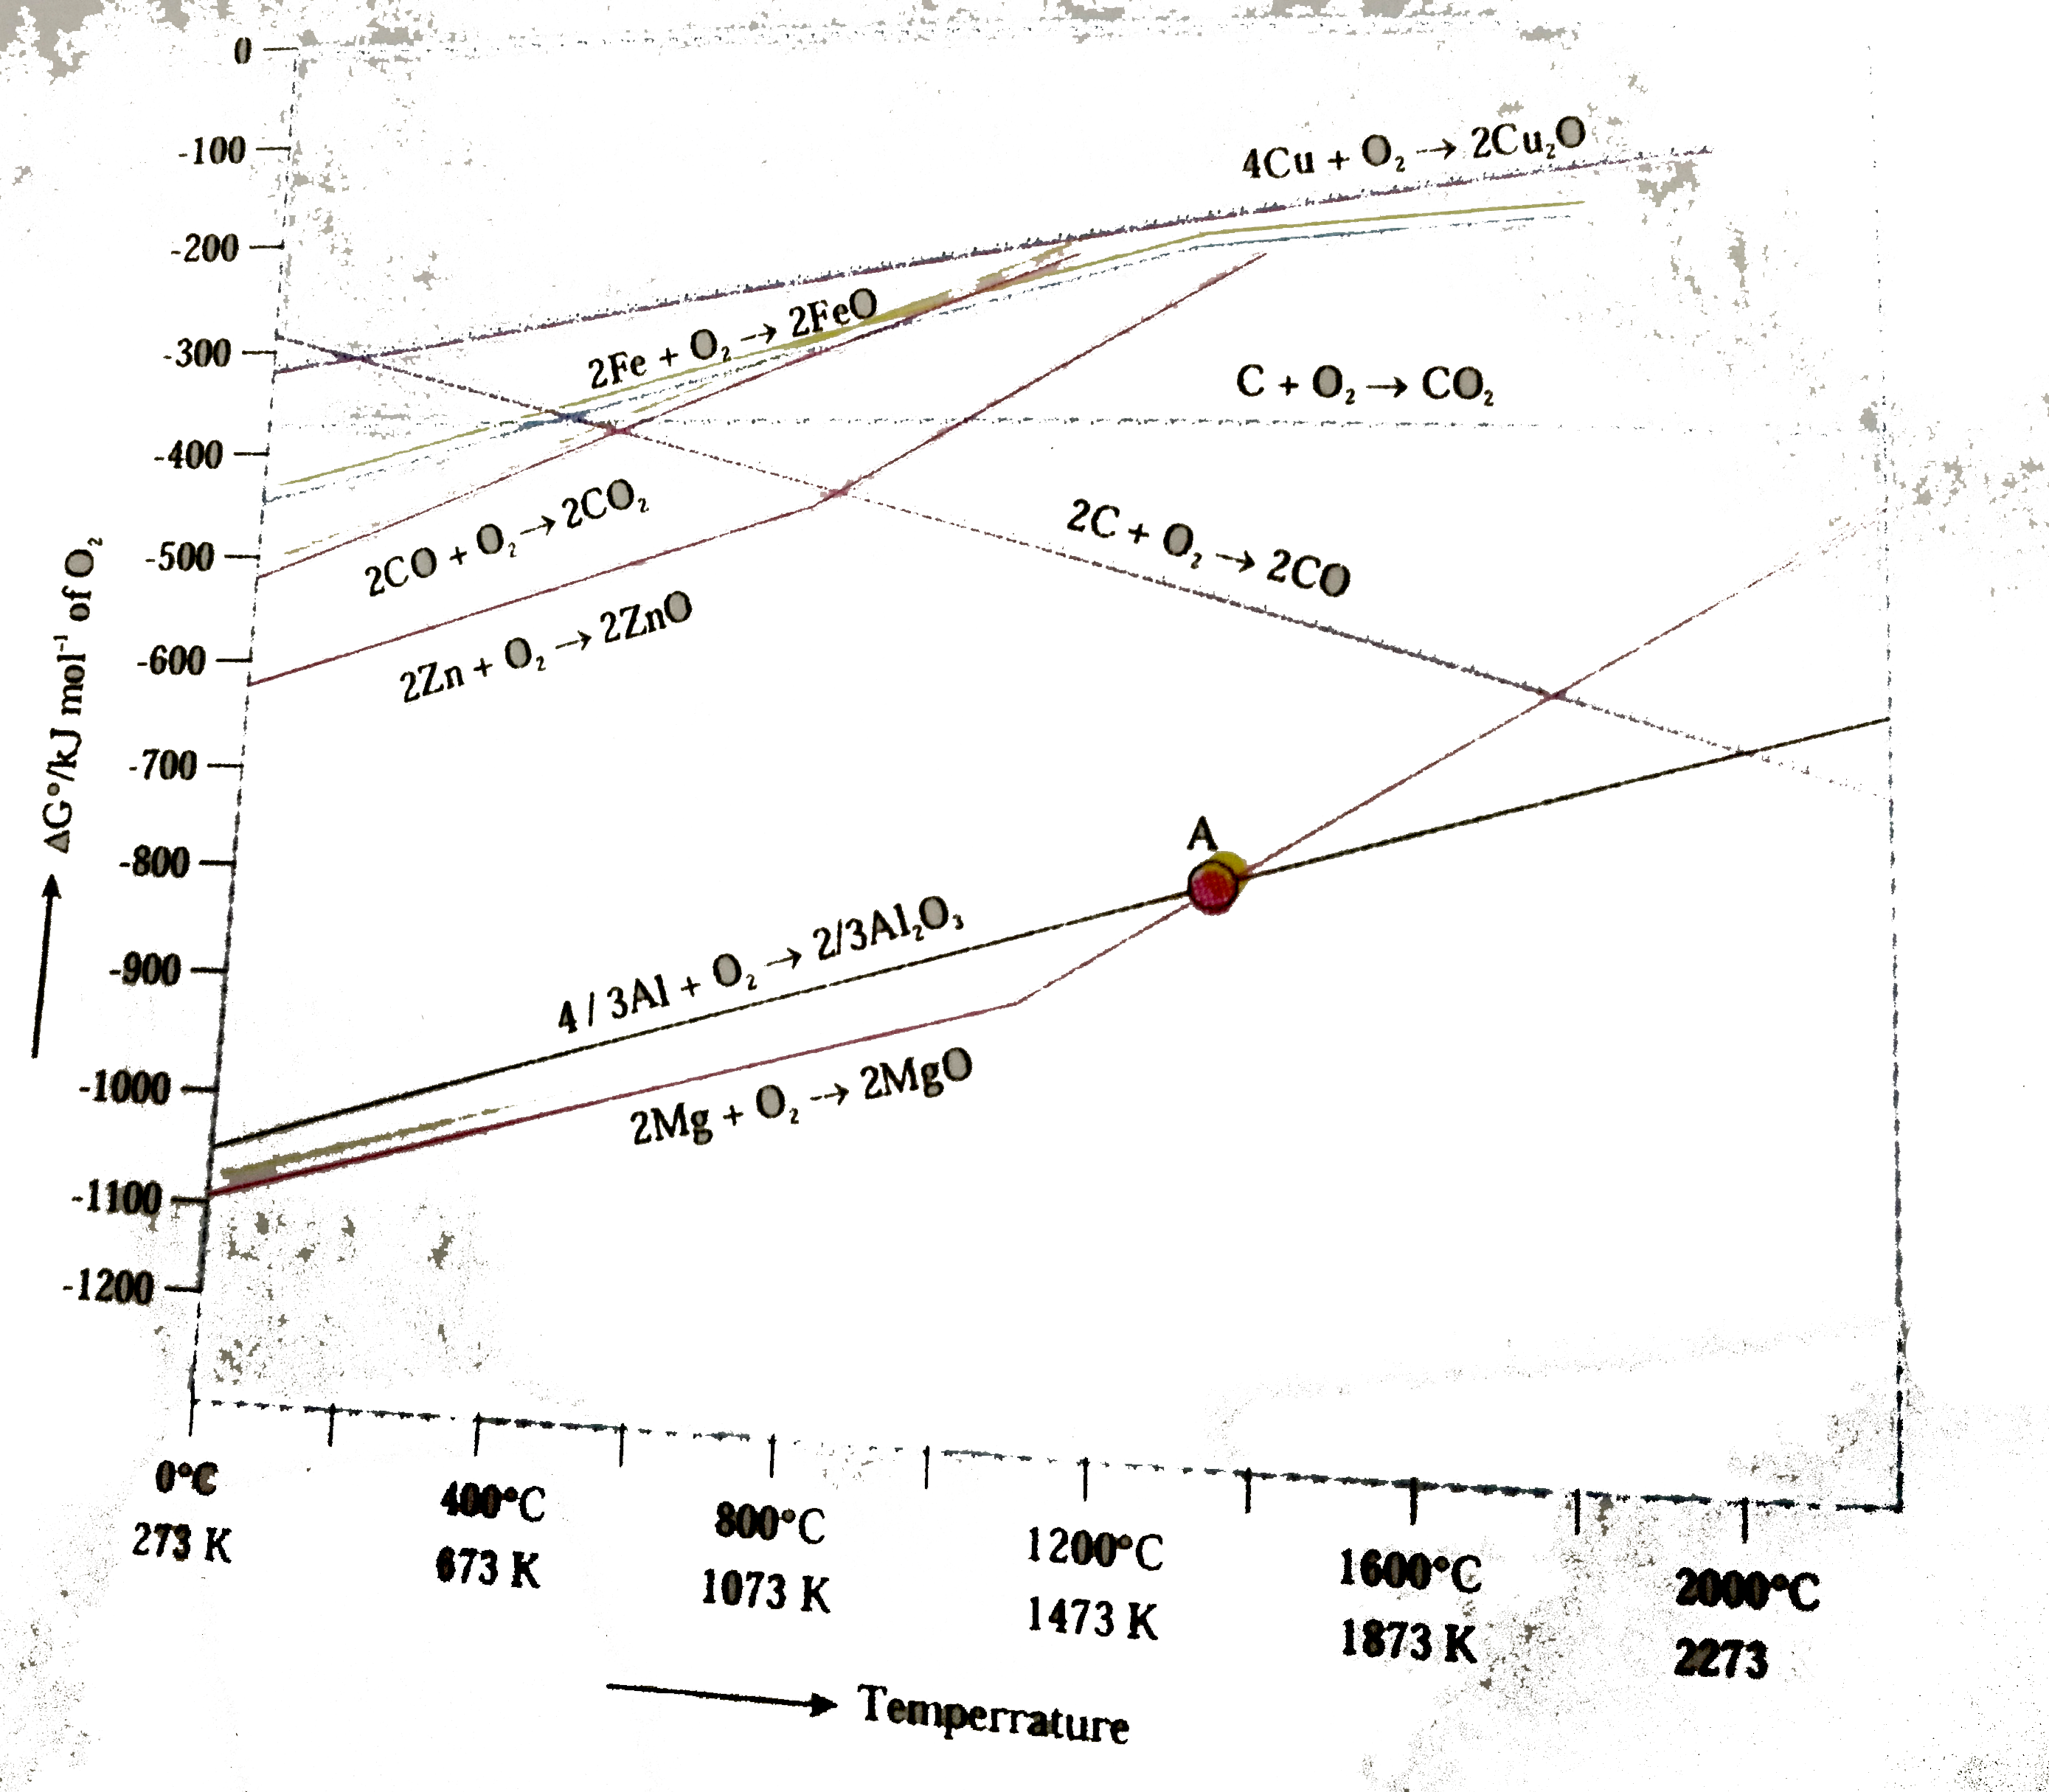
The reduction of by carbon at may be repesented as the free energy of this raction can be obtained from the following two reactions.
Choose the correct statement
The correct Answer is:a
Similar Questions
Knowledge Check
The formation of the oxide MxOyper mole of O2 cinsumed is written a 2xyM(S)+O2(g)→2yMxOy the free energy change of the reaction is given by ?G=?H-T?S.
if the ethalpychange?H and ethropy change ?S are assumed to be indendent of temperature the plot of ?G versus T is liner such as shown in th efollowing figure known as Ellingham diagram Figure known a sEllingham diagram Figure is widely used to discuss th priciple ionvolves in the extraction of metal from its oxide.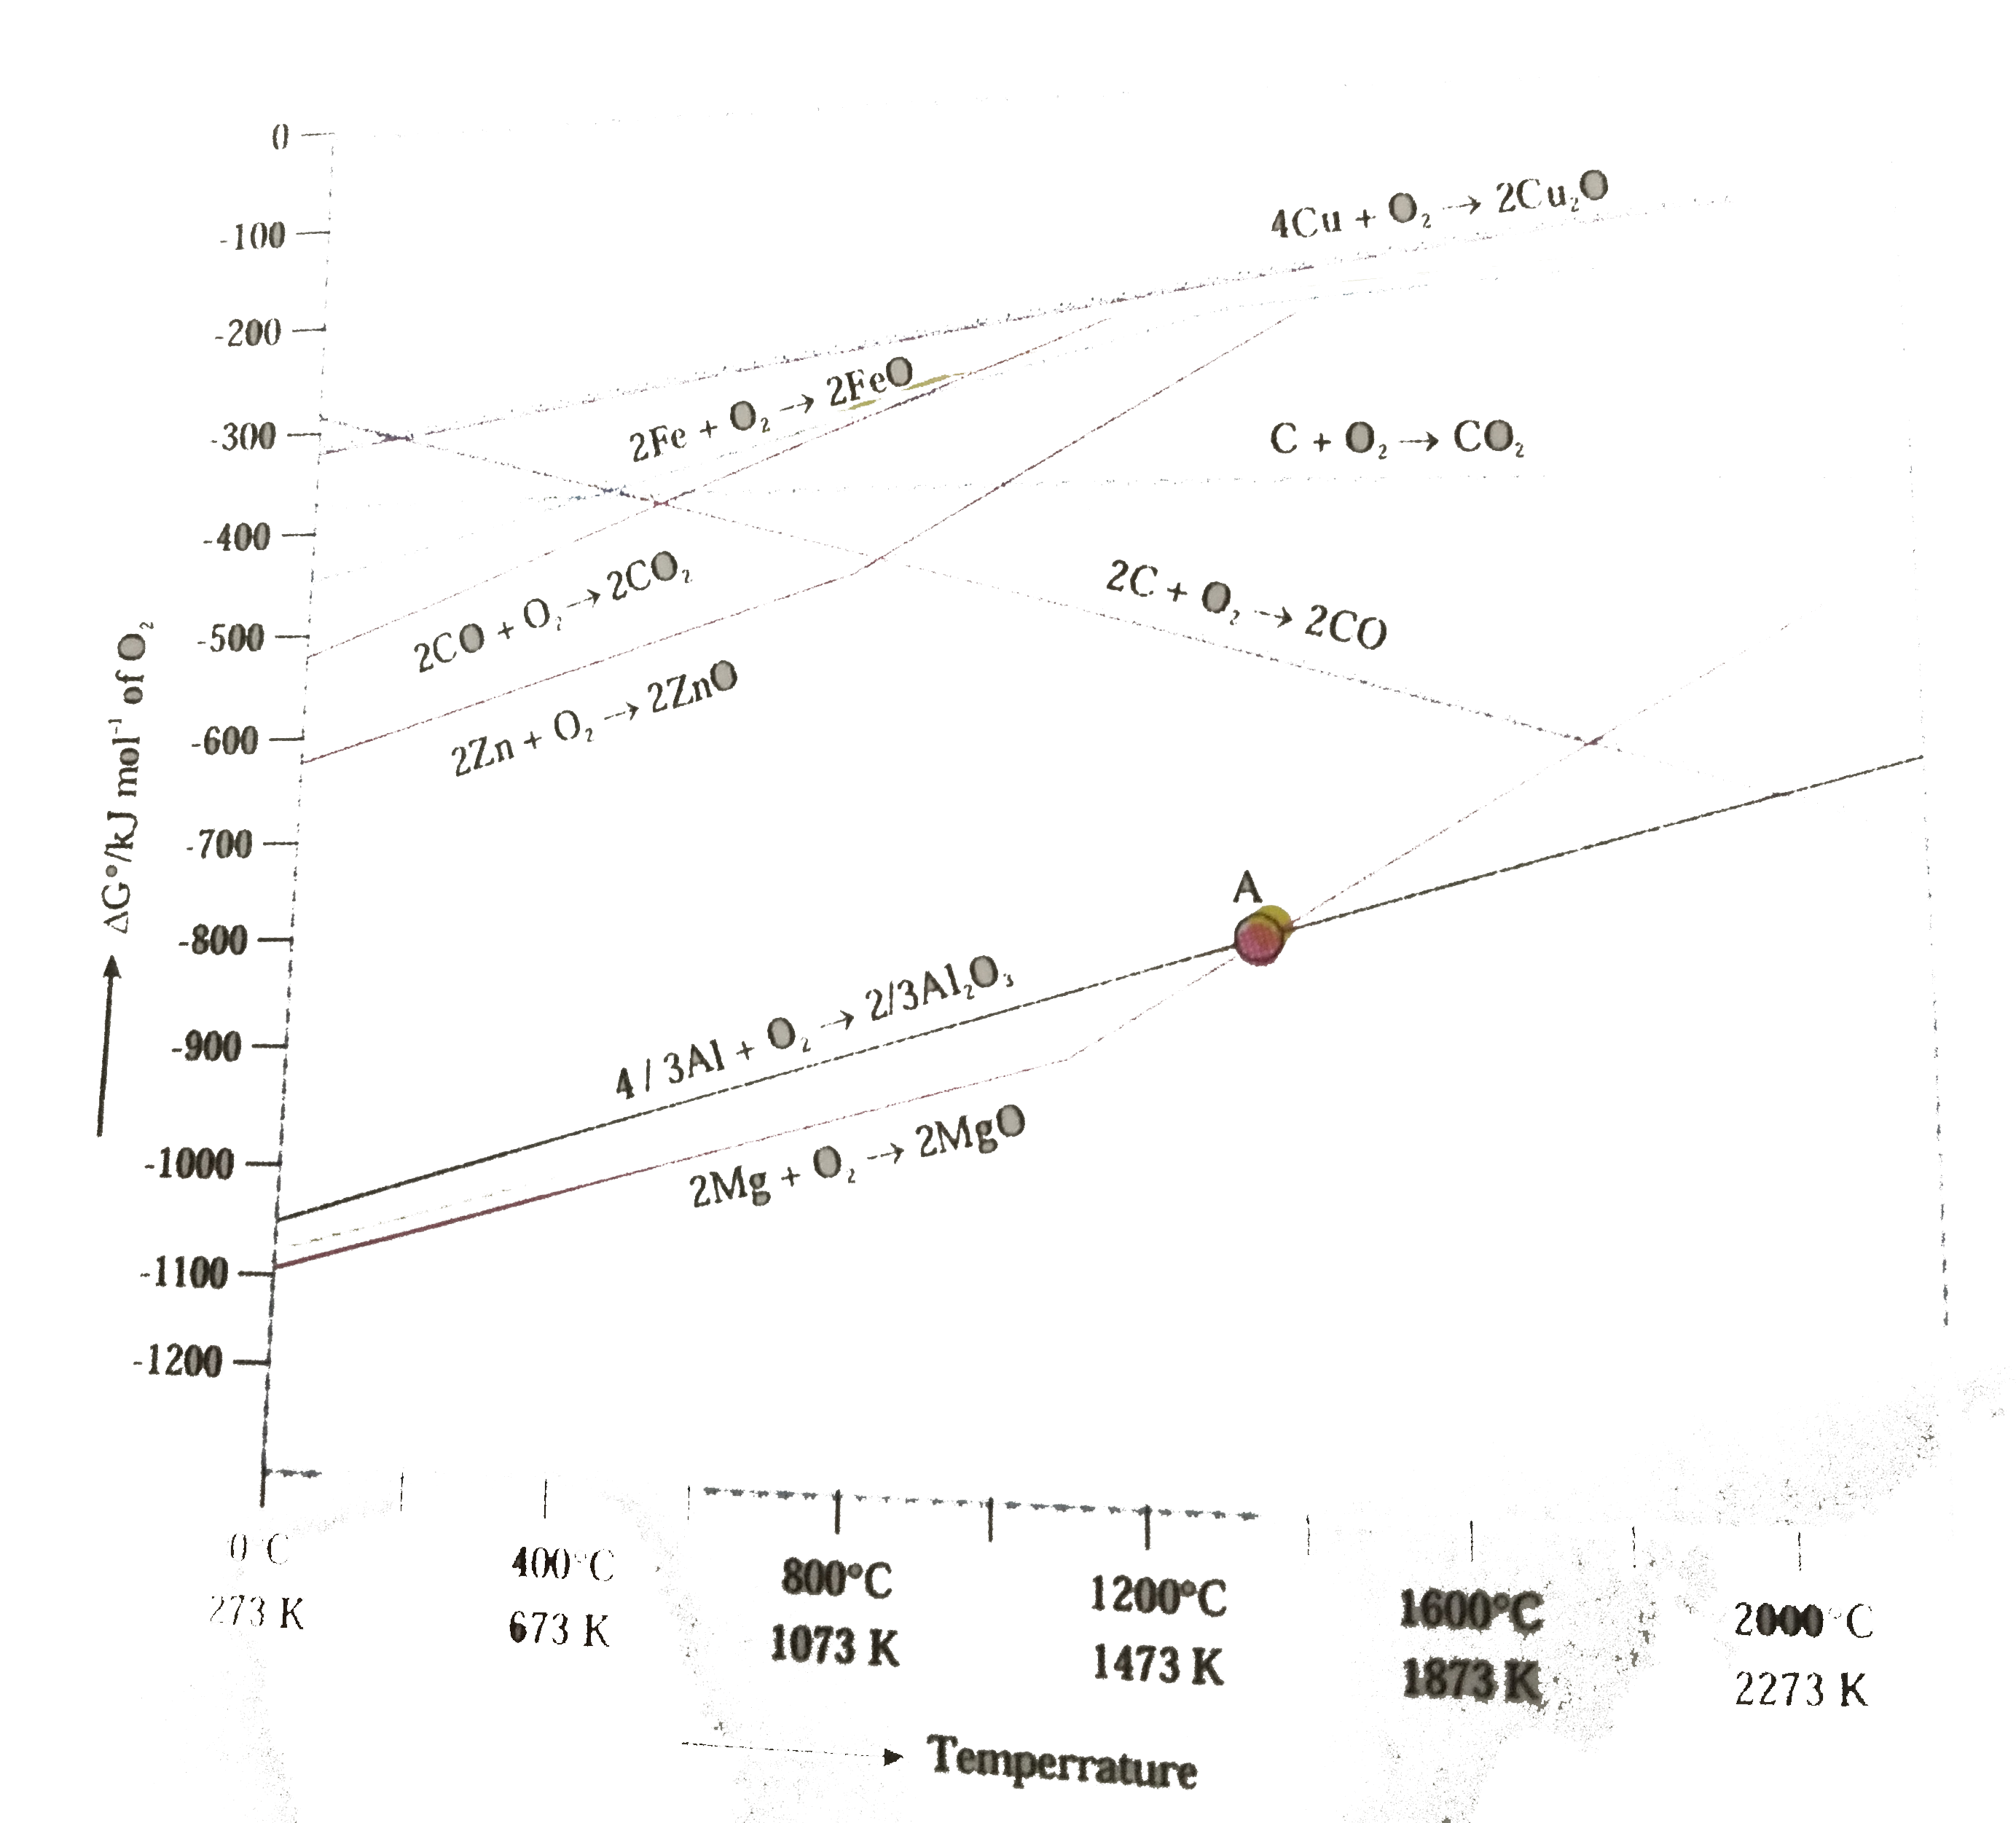
choose correct statement from the following StaementsAThe slope of linear plot of
ΔG versus T is positive for MXOywith the excepitio when 'M' is carbon.BThe slope of linear plot of ΔG vercus T is nagative for CO2Cthe slope of plots of ΔG Versus T is positive for CODThe slope of plats of ΔG cversus to T for the varouos oxides formed from M(S)(or)M(l) are nagativeThe formation of the oxide MxOyper mole of O2 cinsumed is written a 2xyM(S)+O2(g)→2yMxOy the free energy change of the reaction is given by ?G=?H-T?S.
if the ethalpychange?H and ethropy change ?S are assumed to be indendent of temperature the plot of ?G versus T is liner such as shown in th efollowing figure known as Ellingham diagram Figure known a sEllingham diagram Figure is widely used to discuss th priciple ionvolves in the extraction of metal from its oxide.
choose correct statement from the following StaementsAThe slope of linear plot of
ΔG versus T is positive for MXOywith the excepitio when 'M' is carbon.BThe slope of linear plot of ΔG vercus T is nagative for CO2Cthe slope of plots of ΔG Versus T is positive for CODThe slope of plats of ΔG cversus to T for the varouos oxides formed from M(S)(or)M(l) are nagativeThe formation of the oxide MxOyper mole of O2 cinsumed is written a 2xyM(S)+O2(g)→2yMxOy the free energy change of the reaction is given by ?G=?H-T?S.
if the ethalpychange?H and ethropy change ?S are assumed to be indendent of temperature the plot of ?G versus T is liner such as shown in th efollowing figure known as Ellingham diagram Figure known a sEllingham diagram Figure is widely used to discuss th priciple ionvolves in the extraction of metal from its oxide.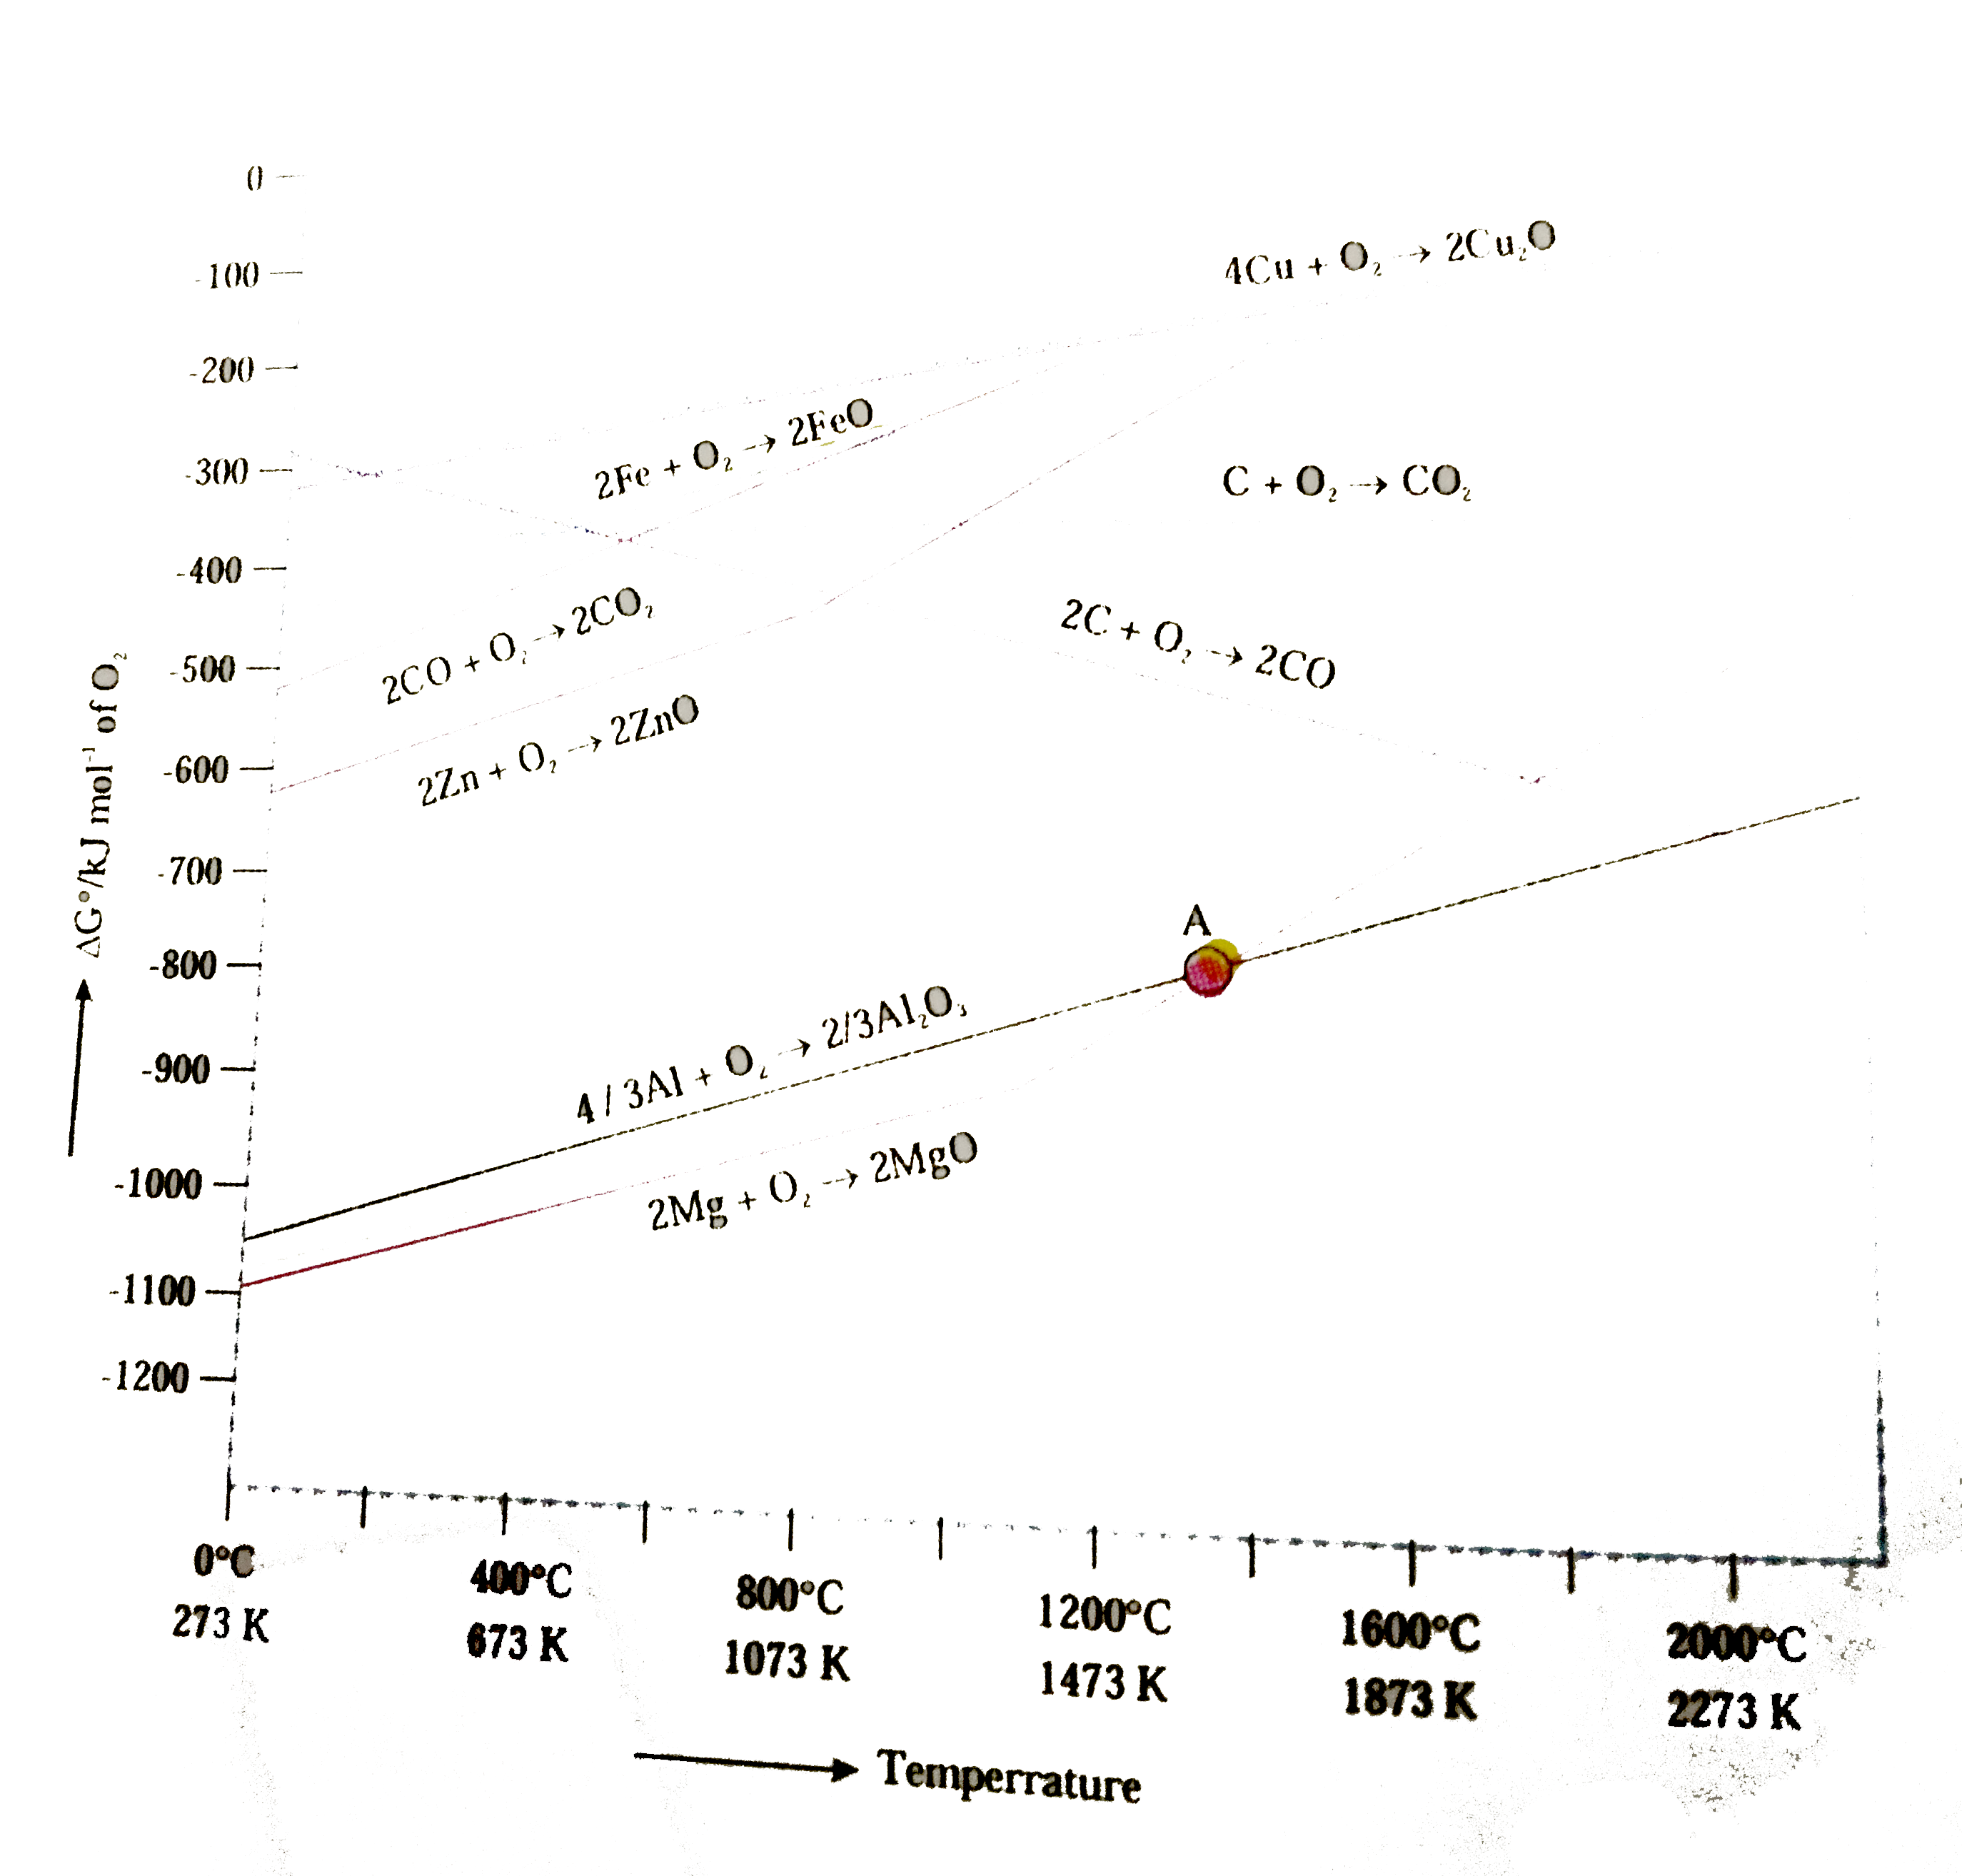
chorose correct statement from from the following
(I) For the reducation of by 'c' [to be spontaneous ]
(II) DEcreasng ease of reduction of metal oxides by carbon is
(III) Decreasding ease of reduction of metal oxides by caron is
(IV) Resduction of by Al possible at all temperaturesAI,ivBii,iiiCii,ivDiii,iv
For a reaction 4M(s)+nO2(g)→2M2On(s),
the free energy change is plotted as a function of temperature. The temperature below which the oxide is stable could be inferred from the plot as the point at which :
View SolutionFor a sponaneous reaction, the free energy change must be negative, ΔG=ΔH−TΔS,ΔH is the enthalpy change during the reaction. T is the absolute temperature, and ΔS is the change in entropy during the reaction. Consider a reaction such as the formation of an oxide
M+O2→MO
Dioxygen is used up in the course of this reaction. Gases have a more random structure (less ordered) than liquid or solids. Consequently gases have a higher entropy than liquids and solids. In this reaction S (entropy or randomness) decreases, hence ΔS is negative. Thus, if the temperature is raised then TΔS becomes more negative,Since, TΔS is substracted in the equation, then ΔG becomes less negative. Thus, the free energy change increases with the increase in temperature.
The free energy changes that occur when one mole of common reactant (in this case dioxygen) is used may be plotted graphically aginst temperature for a number of reactions of metals to their oxides. The following plot is called an Ellingham diagram for metal oxide. Understanding of Ellingham diagram is extremely important for the efficient extraction of metals.
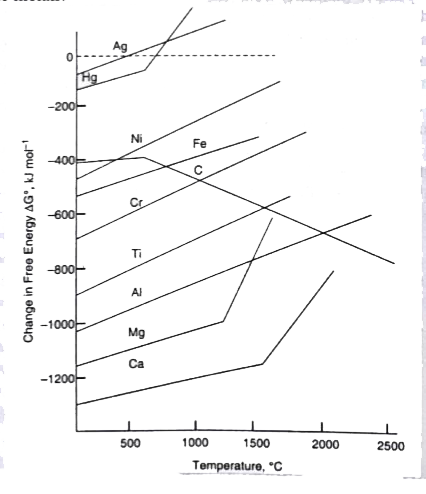
Free energy change of Hg and Mg for the convertion to oxides the slpe of ΔG vsT has been changed above the boiling points of the given metal because :
View SolutionThe formation of the oxide MxOyper mole of O2 cinsumed is written a 2xyM(S)+O2(g)→2yMxOy the free energy change of the reaction is given by ?G=?H-T?S.
if the ethalpychange?H and ethropy change ?S are assumed to be indendent of temperature the plot of ?G versus T is liner such as shown in th efollowing figure known as Ellingham diagram Figure known a sEllingham diagram Figure is widely used to discuss th priciple ionvolves in the extraction of metal from its oxide.
chorose correct statement from from the following
(I) For the reducation of by 'c' [to be spontaneous ]
(II) DEcreasng ease of reduction of metal oxides by carbon is
(III) Decreasding ease of reduction of metal oxides by caron is
(IV) Resduction of by Al possible at all temperatures
View SolutionFor a sponaneous reaction, the free energy change must be negative, ΔG=ΔH−TΔS,ΔH is the enthalpy change during the reaction. T is the absolute temperature, and ΔS is the change in entropy during the reaction. Consider a reaction such as the formation of an oxide
M+O2→MO
Dioxygen is used up in the course of this reaction. Gases have a more random structure (less ordered) than liquid or solids. Consequently gases have a higher entropy than liquids and solids. In this reaction S (entropy or randomness) decreases, hence ΔS is negative. Thus, if the temperature is raised then TΔS becomes more negative,Since, TΔS is substracted in the equation, then ΔG becomes less negative. Thus, the free energy change increases with the increase in temperature.
The free energy changes that occur when one mole of common reactant (in this case dioxygen) is used may be plotted graphically aginst temperature for a number of reactions of metals to their oxides. The following plot is called an Ellingham diagram for metal oxide. Understanding of Ellingham diagram is extremely important for the efficient extraction of metals.

Free energy change of Hg and Mg for the convertion to oxides the slpe of ΔG vsT has been changed above the boiling points of the given metal because :
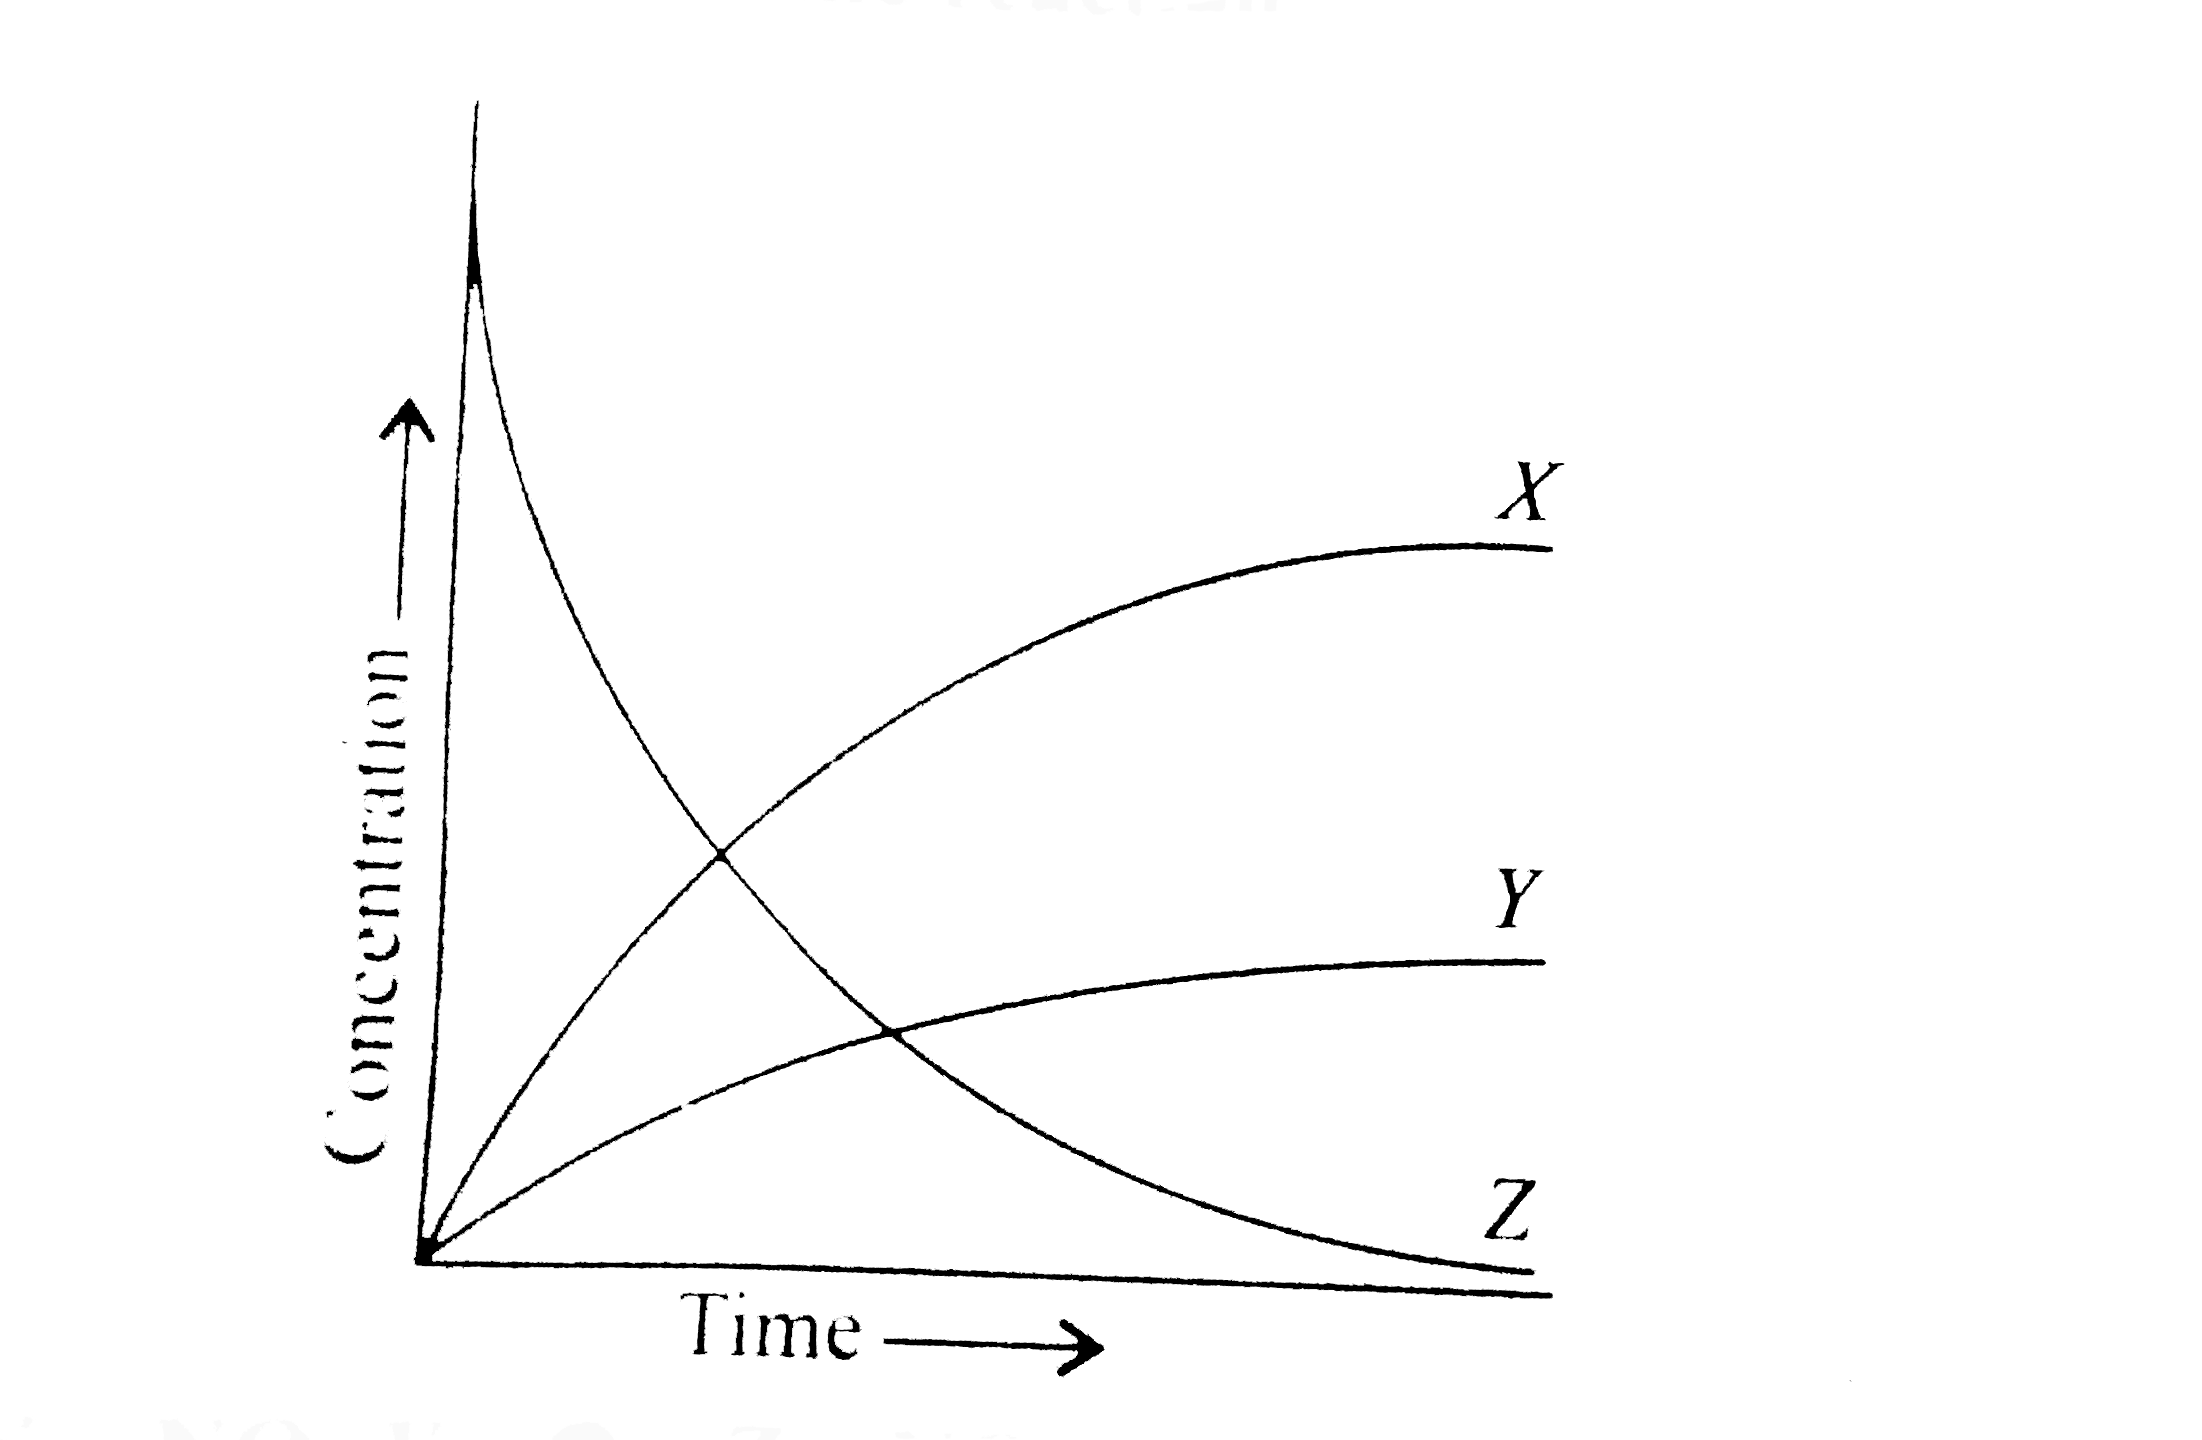
View SolutionConsider the following reaction:
2NO2(g)→2NO(g)+O2(g)
In the figure below, identify the curves X,Y, and Z associated with the three species in the reaction
View Solution
