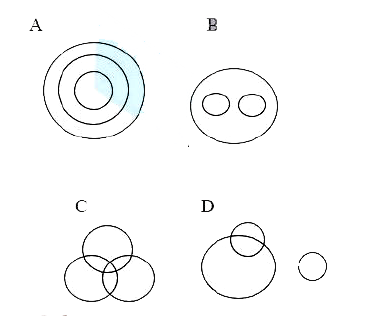
The given diagram illustrates
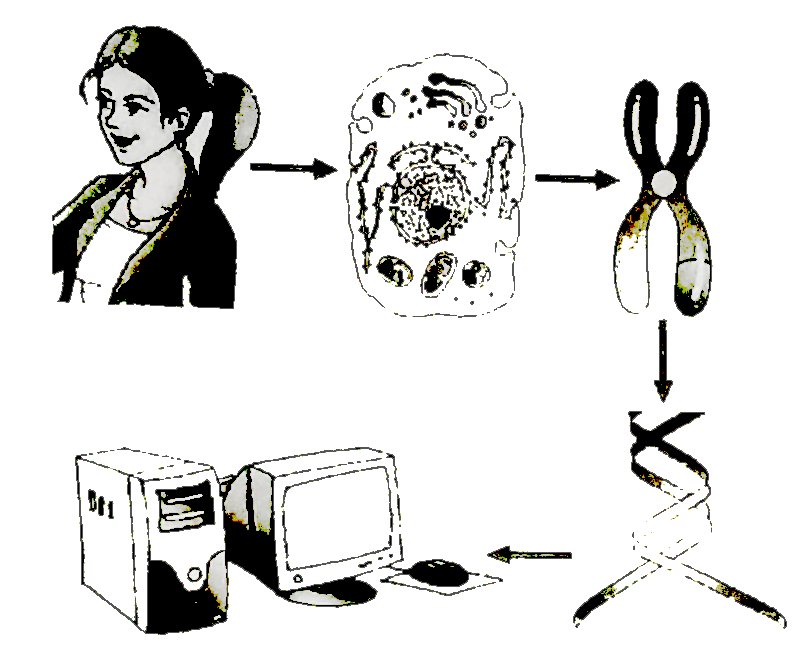
A
Chromosome walking
B
Homoral Analysis
C
Human Genome Project
D
Method of DNA fingerprinting
Video Solution
Text Solution
The correct Answer is:c
|
Answer
Step by step video, text & image solution for The given diagram illustrates by Biology experts to help you in doubts & scoring excellent marks in Class 12 exams.
Updated on:21/07/2023Topper's Solved these Questions
Similar Questions
Knowledge Check
Given diagram illustrates the changes that occur when a plant cell takes up water Identify L,Mand N and select the incorrect statement the given diagram
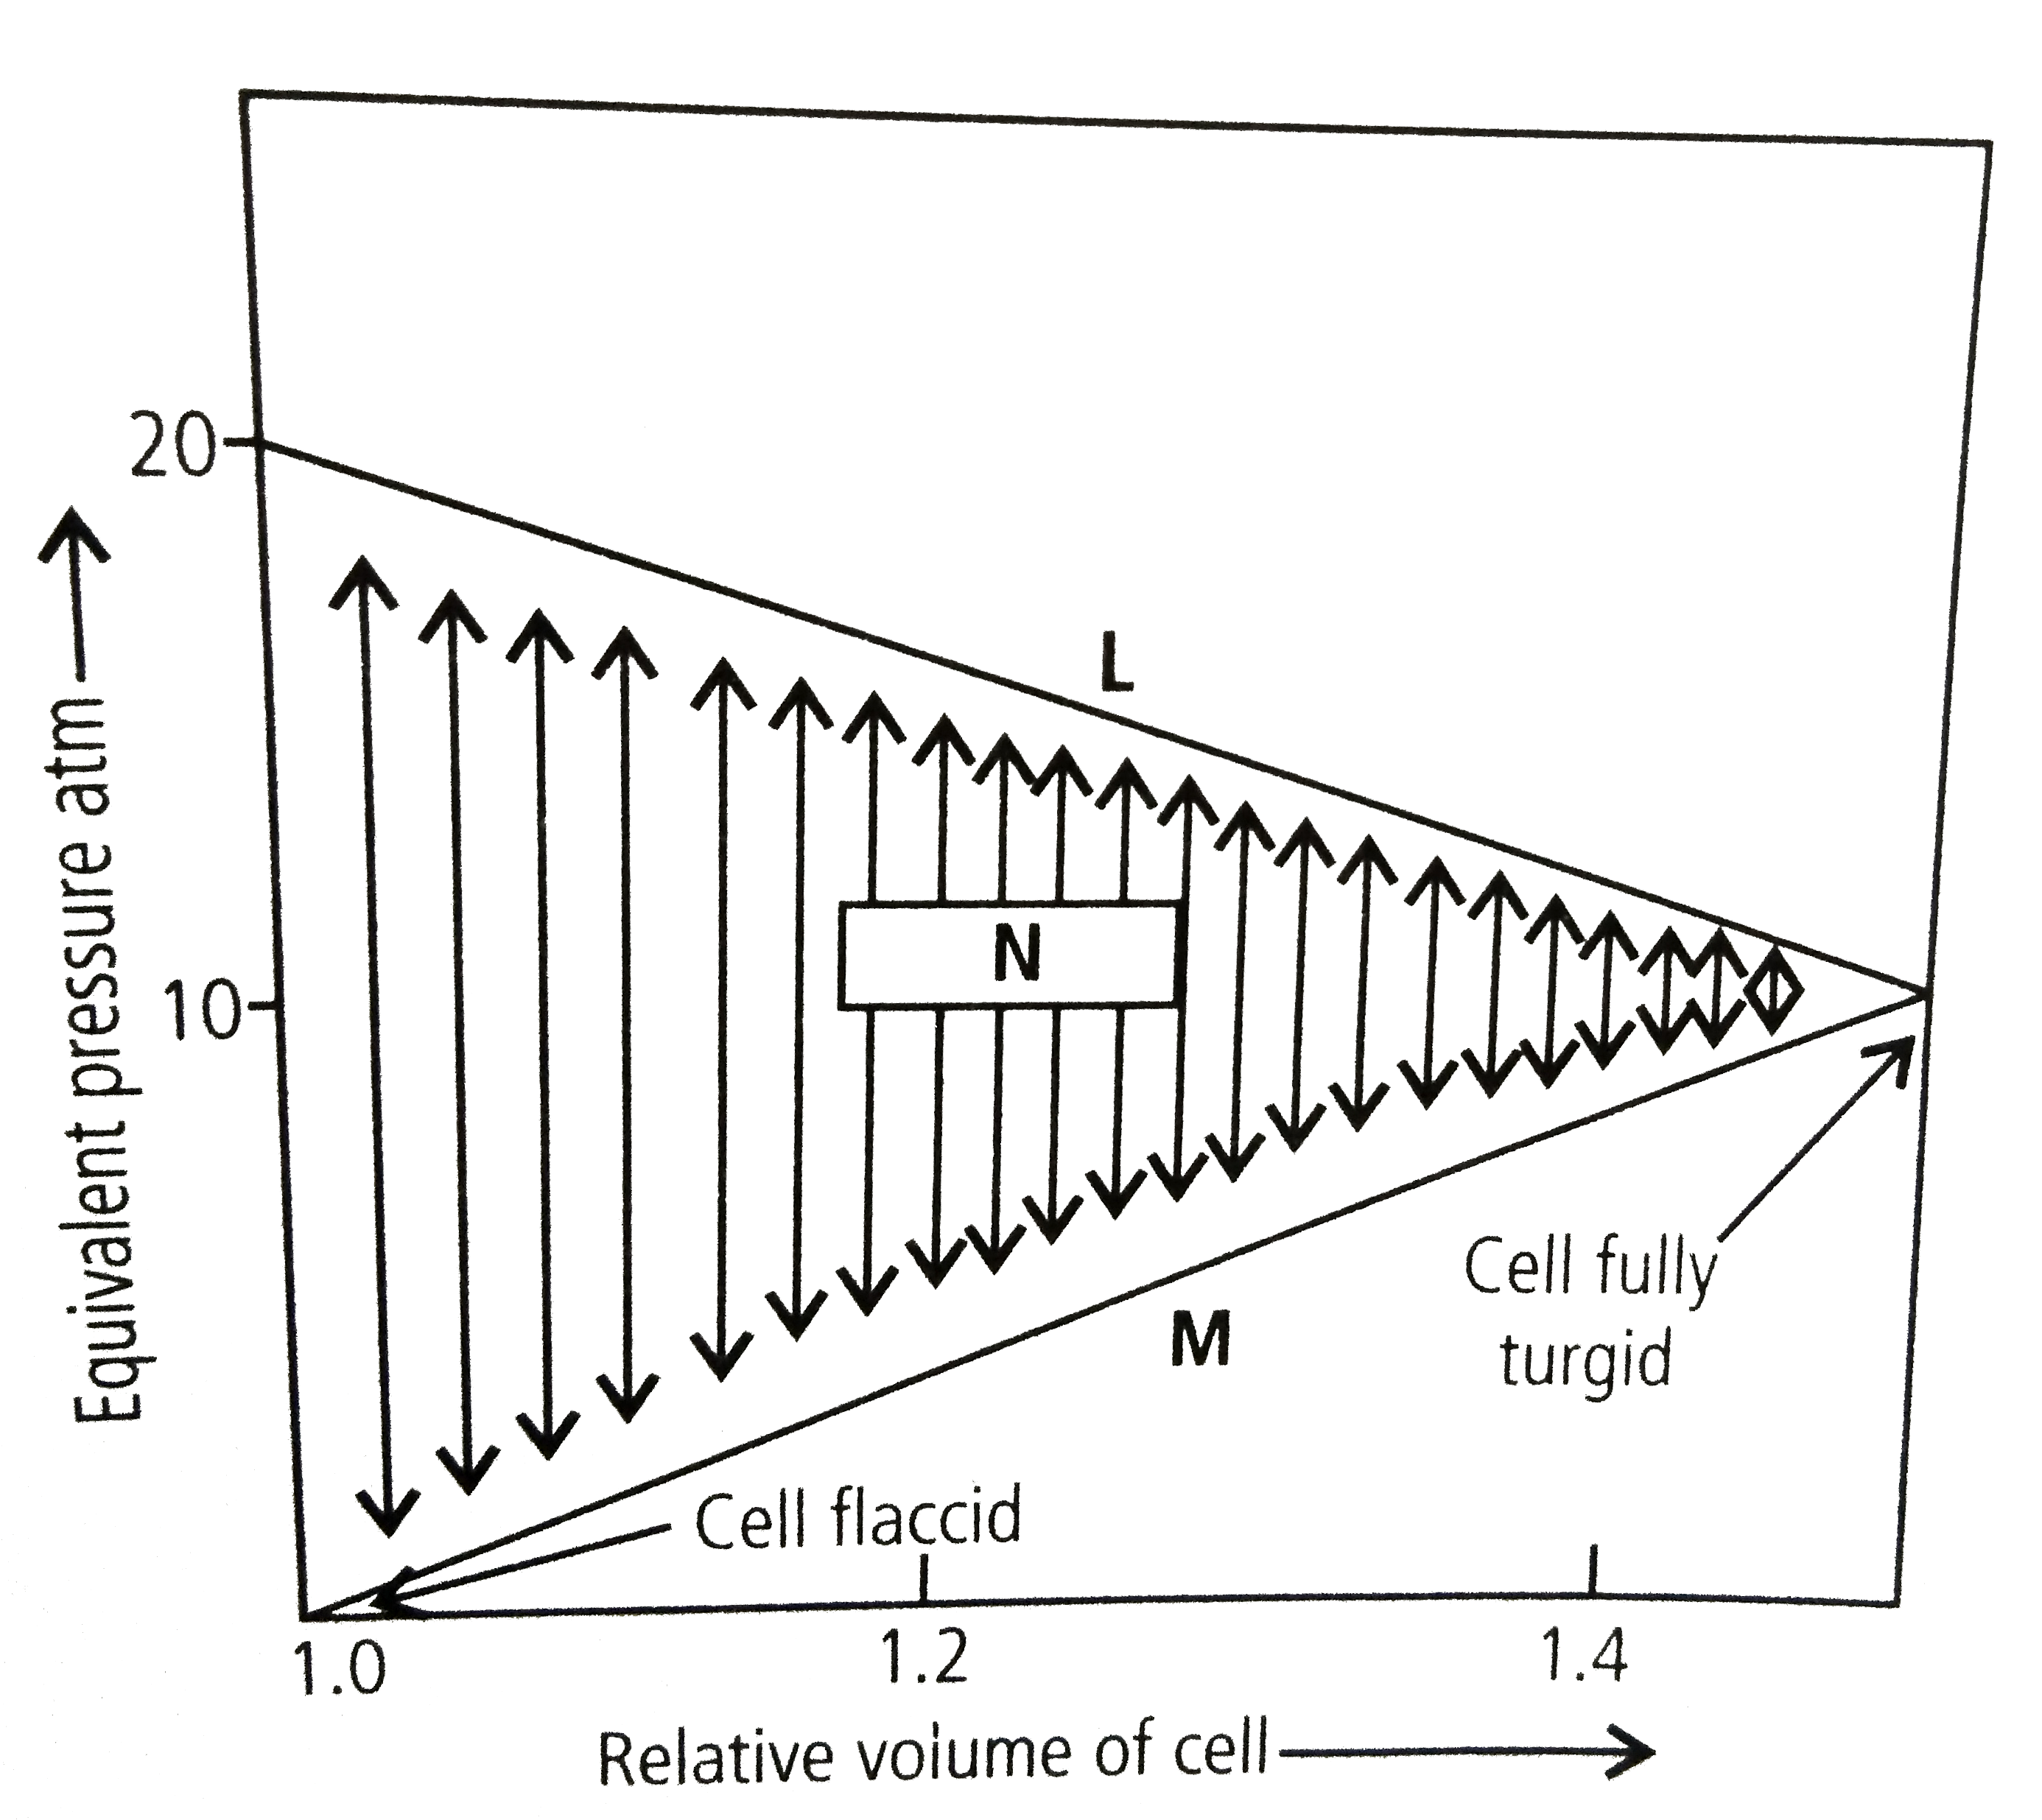 AN is the diffusion pressure deficit which becomes zero when LandM re equal in magnitude.BIn a flaccid cell value of N becomes equal to that of LCMrepresents osmotic pressure which increases when a flaccid cell takes up water.DL represents solute potential which decreases with the increase in turgidity of the cell .
The diagram illustrates energy changes in an enzyme controlled reaction.
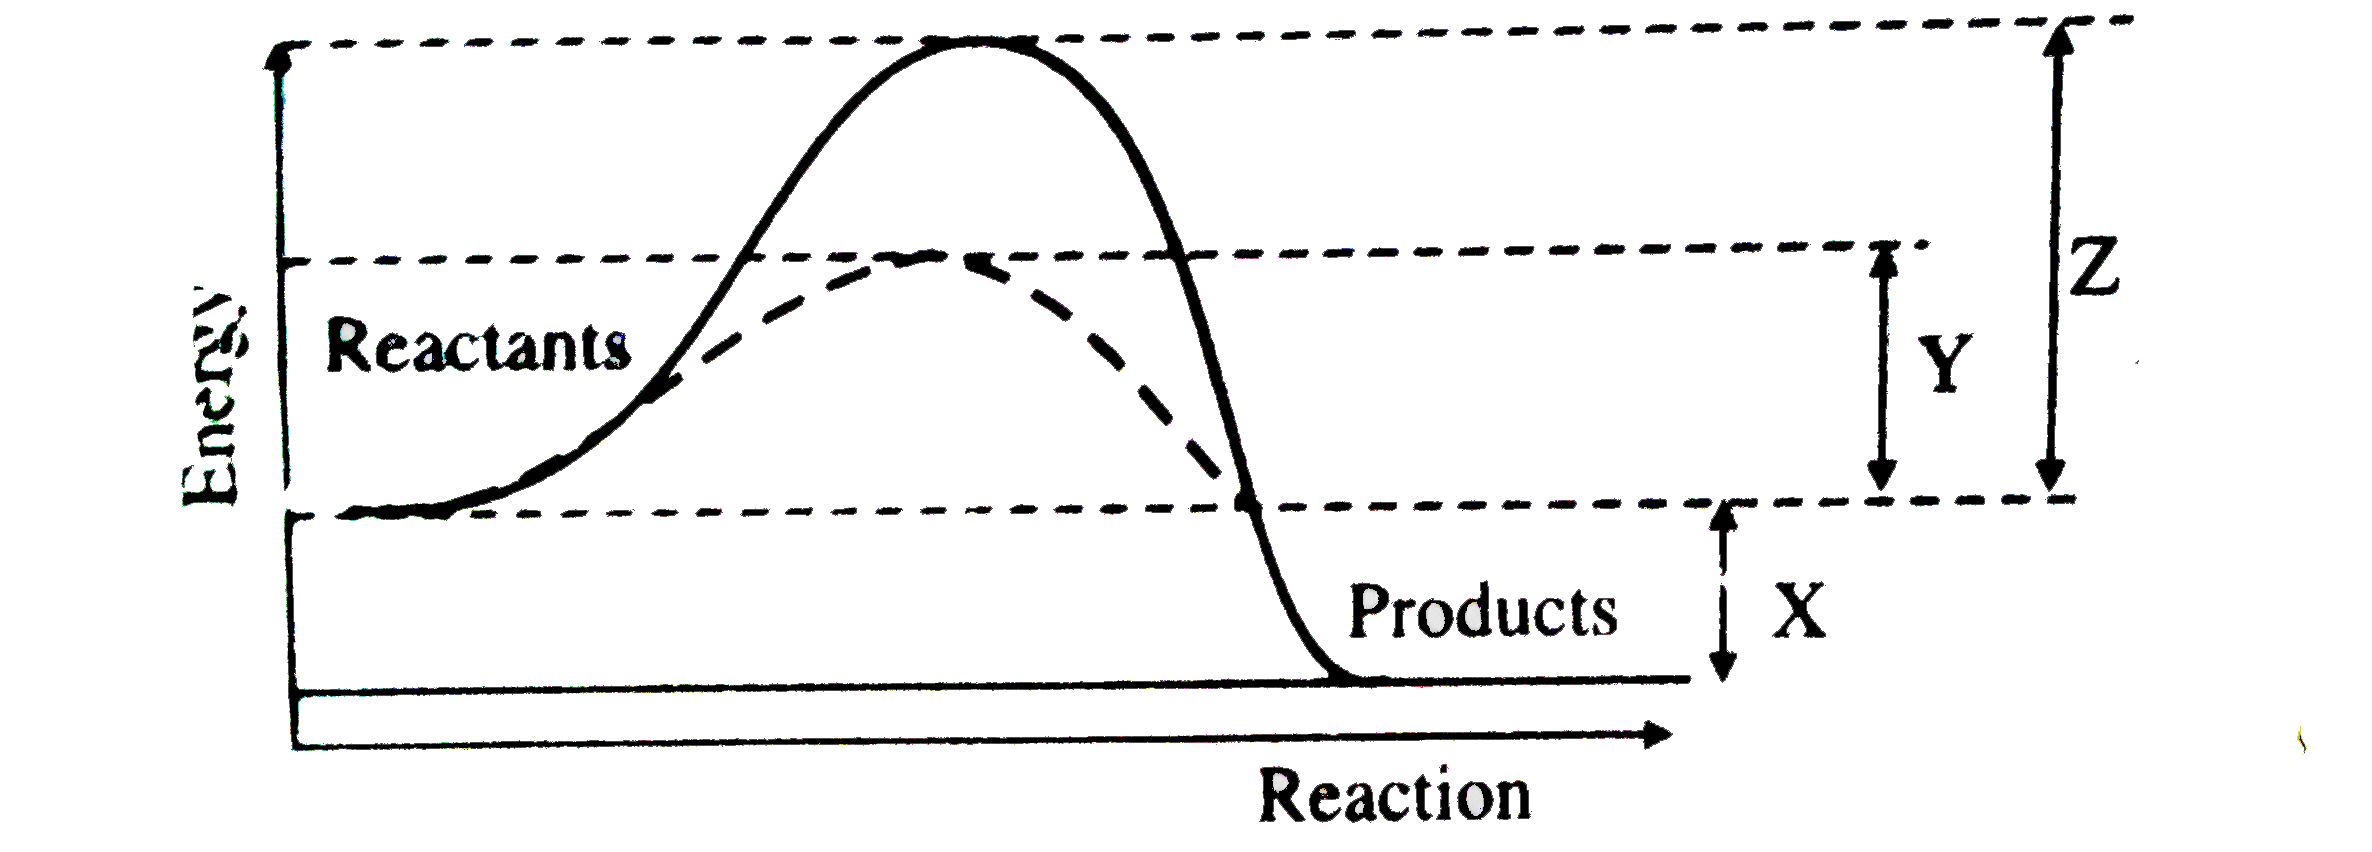 AXBYCZDZ-Y
Given figures illustrate.
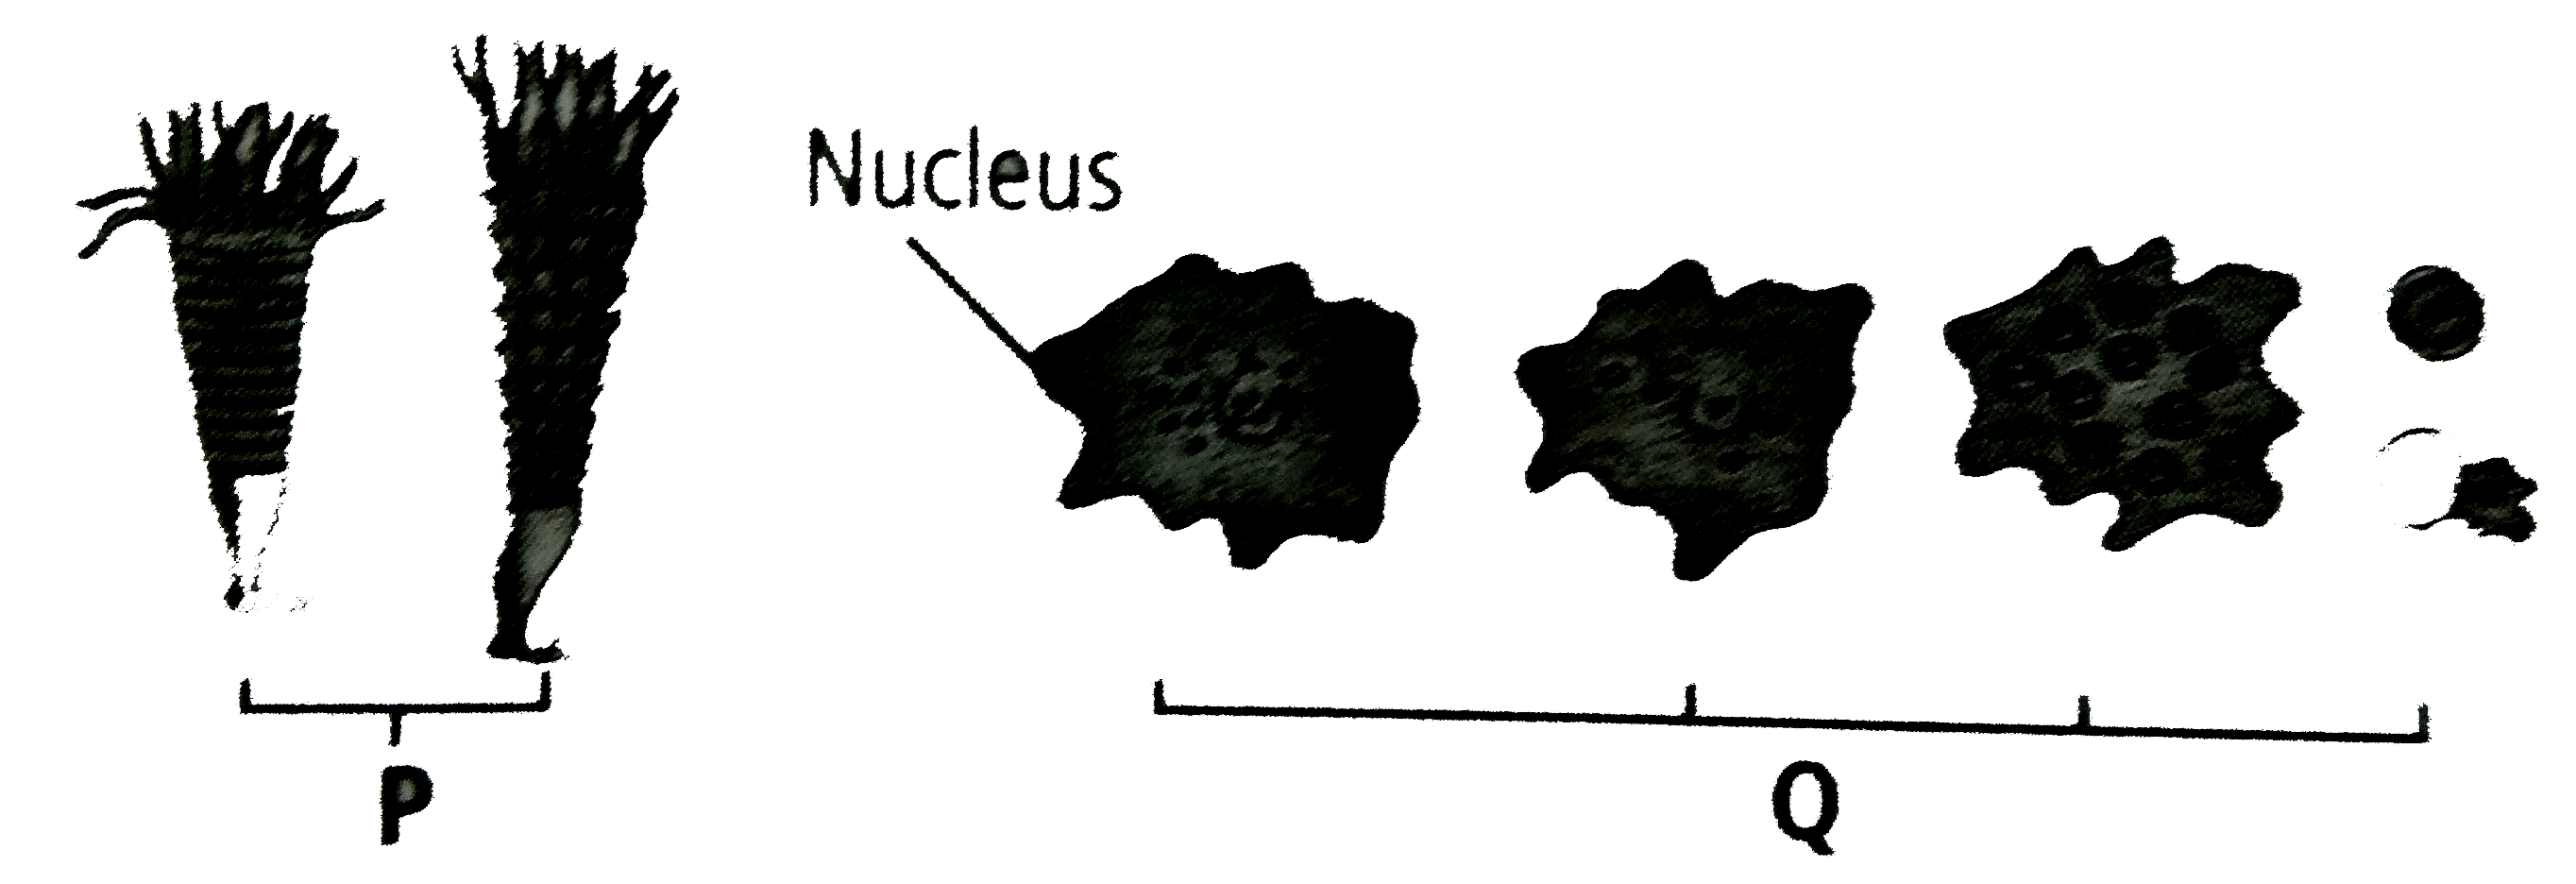 A P QMetamerism by a cnidarianMultiple fission by a protistB P QStrobilation by a cnidarianMultiple fission by a protistC P QFragmentation by a platyhelminthInternal budding by a spongeD P QStrobilation by a platyelminthSporulation by a protis
State the right hand thumb rule.
View SolutionWhich of the following diagrams illustrate the relationship among Science, Maths and Biology?
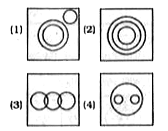
View SolutionChoose from the given diagrams the one that illustrates the relationship among three classes. China, India, Asia
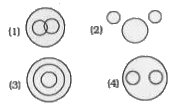
View SolutionWhich of the folloowing Venn diagrams best illustrates the relation between the three given classes?
Professor, Student, Player
View SolutionSelect from the given diagrams,the one that illustrates the relationship among the given three classes: Judge,Thief ,Criminal.
View Solution
