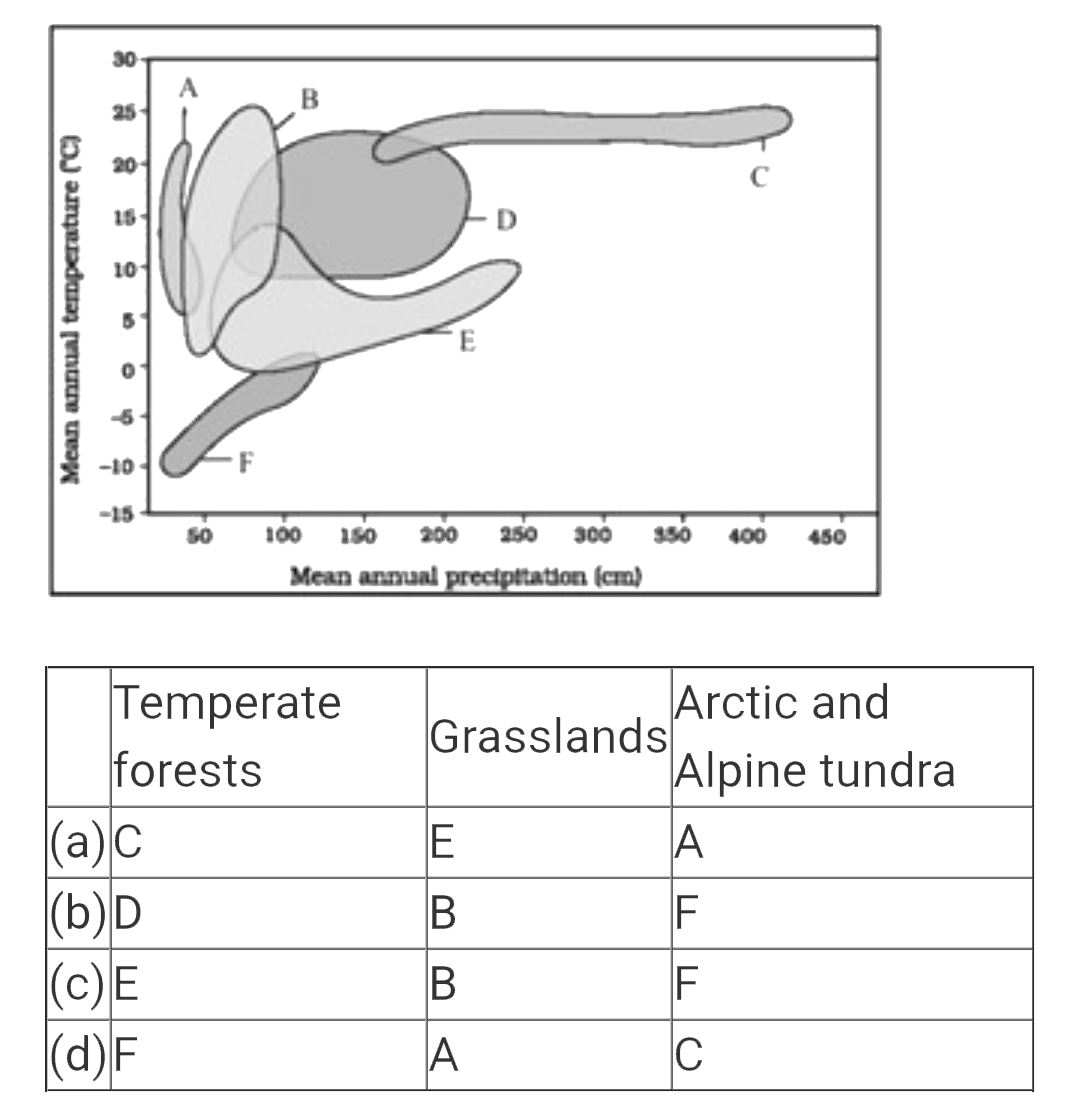
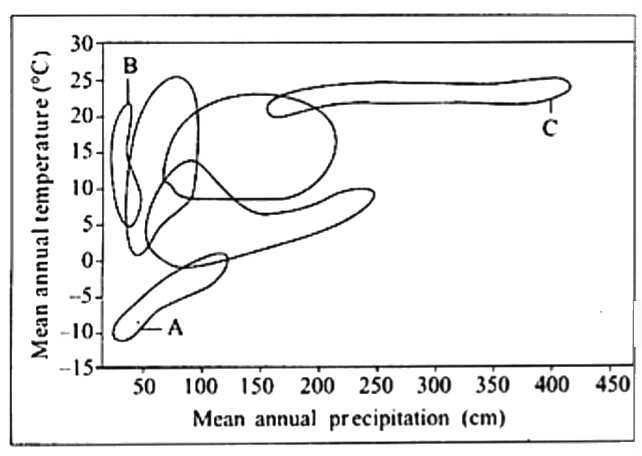
The graph given below is showing biome distribution with respect to annual temperature and precipitation. Identify A, B and C, respectively.
A
A-Desert, B-Arctic tundra: C-Coniferous forest
B
A-Arctic tundra, B-Desert, C-Tropical forest
C
A-Temperate forest, B-arctic tundra, C-Desert
D
A-Temperate forest, B-Arctic tundra, C-Grassland
Video Solution
|
Answer
Step by step video & image solution for The graph given below is showing biome distribution with respect to annual temperature and precipitation. Identify A, B and C, respectively. by Biology experts to help you in doubts & scoring excellent marks in Class 12 exams.
Updated on:21/07/2023Topper's Solved these Questions
Similar Questions
Knowledge Check

Identify gametes (A, B and C) respectively -AHeterogametes, isogametes, HomogametesBIsogametes, homogametes, heterogametesCHomogametes, isogametes, heterogametesDHomo / Isogametes, heterogametes, heterogametesBiome distribution with respect to annual temperature and precipitation is given below. Identify grassland and coniferous forest by selecting the correct option:
 AA and BBB and ECB and DDC and D
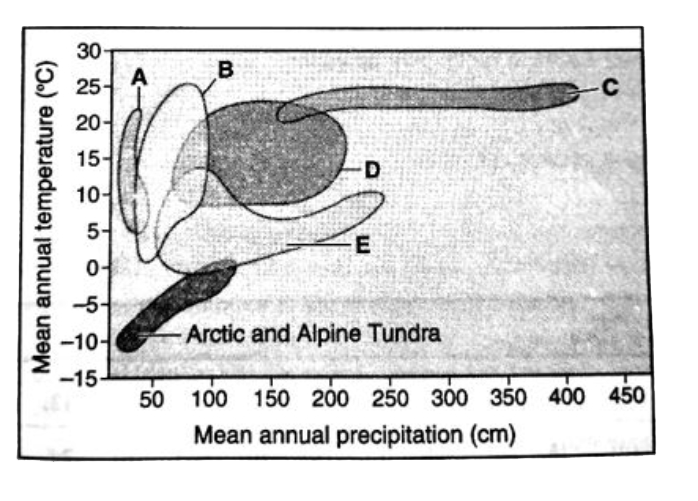
Biome distribution with respect to annual temperature and precipitation is given below. Identify grassland and coniferous forest by selecting the CORRECT option .
 AA and BBB and ECB and DDC and D
In the given figure , identify A, B , C , D and E respectively.

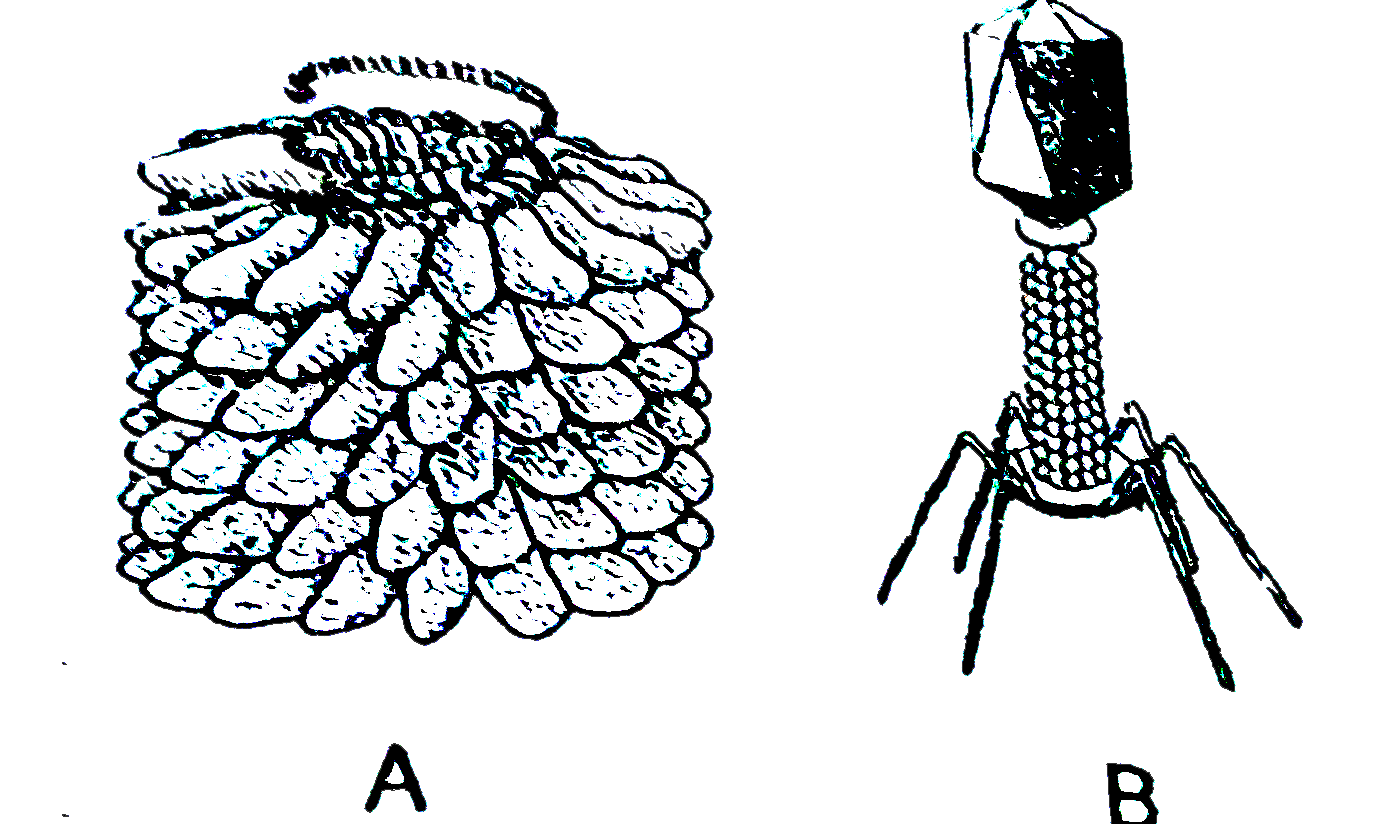
View SolutionIdentify A and B given below.
View SolutionThe below diagram shows electrostatic precipitator. Identify A, B and C.

View SolutionObserve the figure given below.
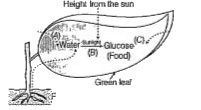
Identify A, B and C.
View SolutionObserve the figure given below.
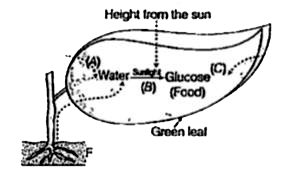
Identify A,B and C.
View Solution


