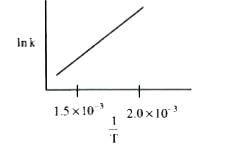
For a reversible reaction following graph is obtained between log10KCand1T hence ΔH for the reaction is:-
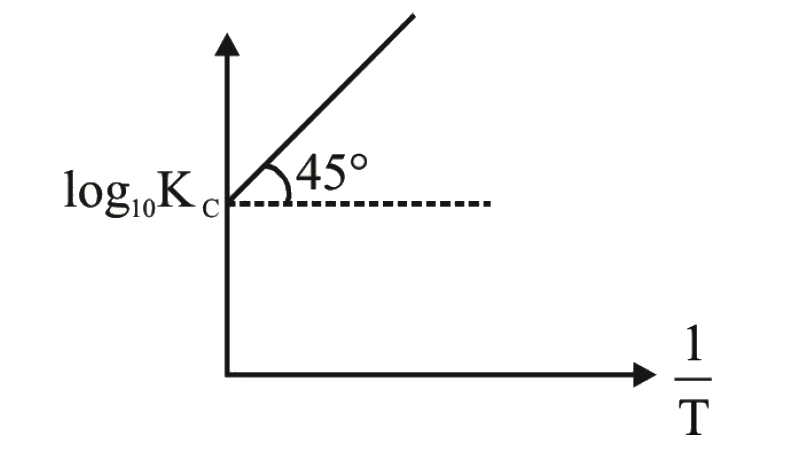
−19.14 J/mole
−8.314 J/mol
−4.606 J/mol
+4.606 J/mol
The correct Answer is:A
Similar Questions
Knowledge Check
A graph plotted between log k vs 1T is represented by
A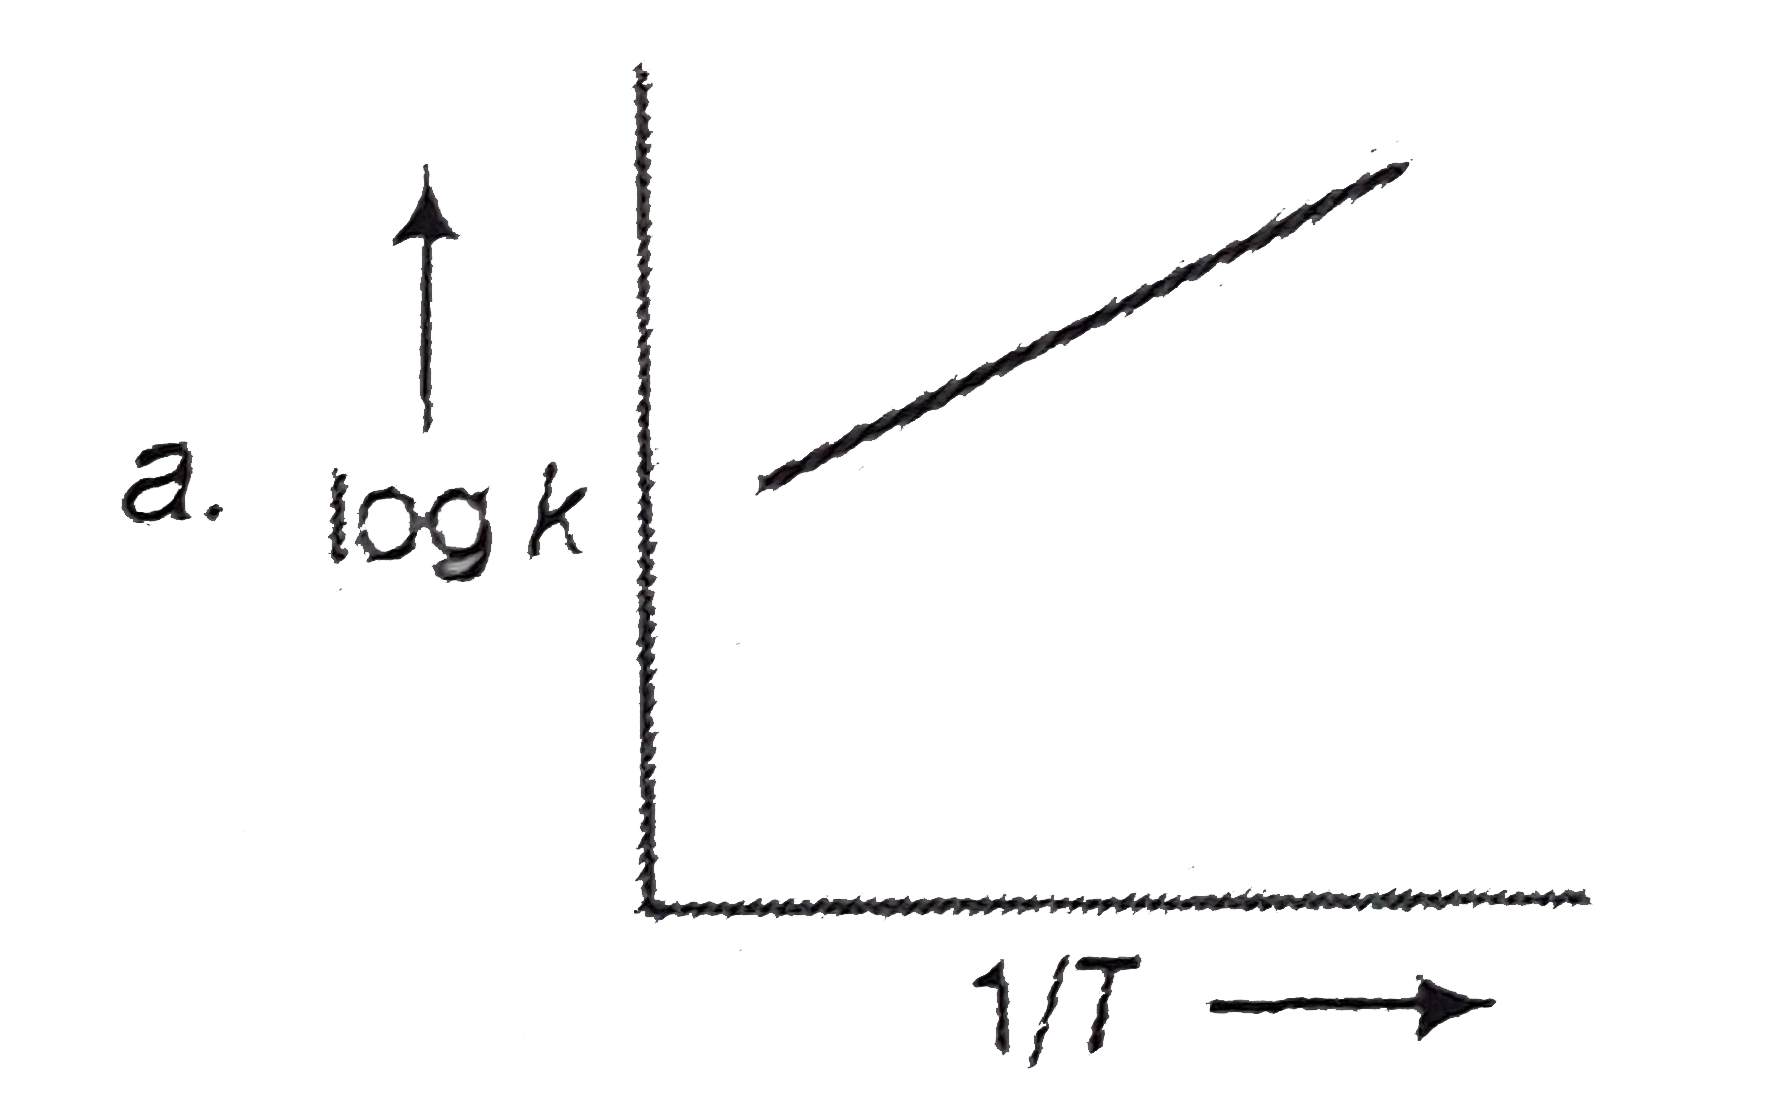 B
B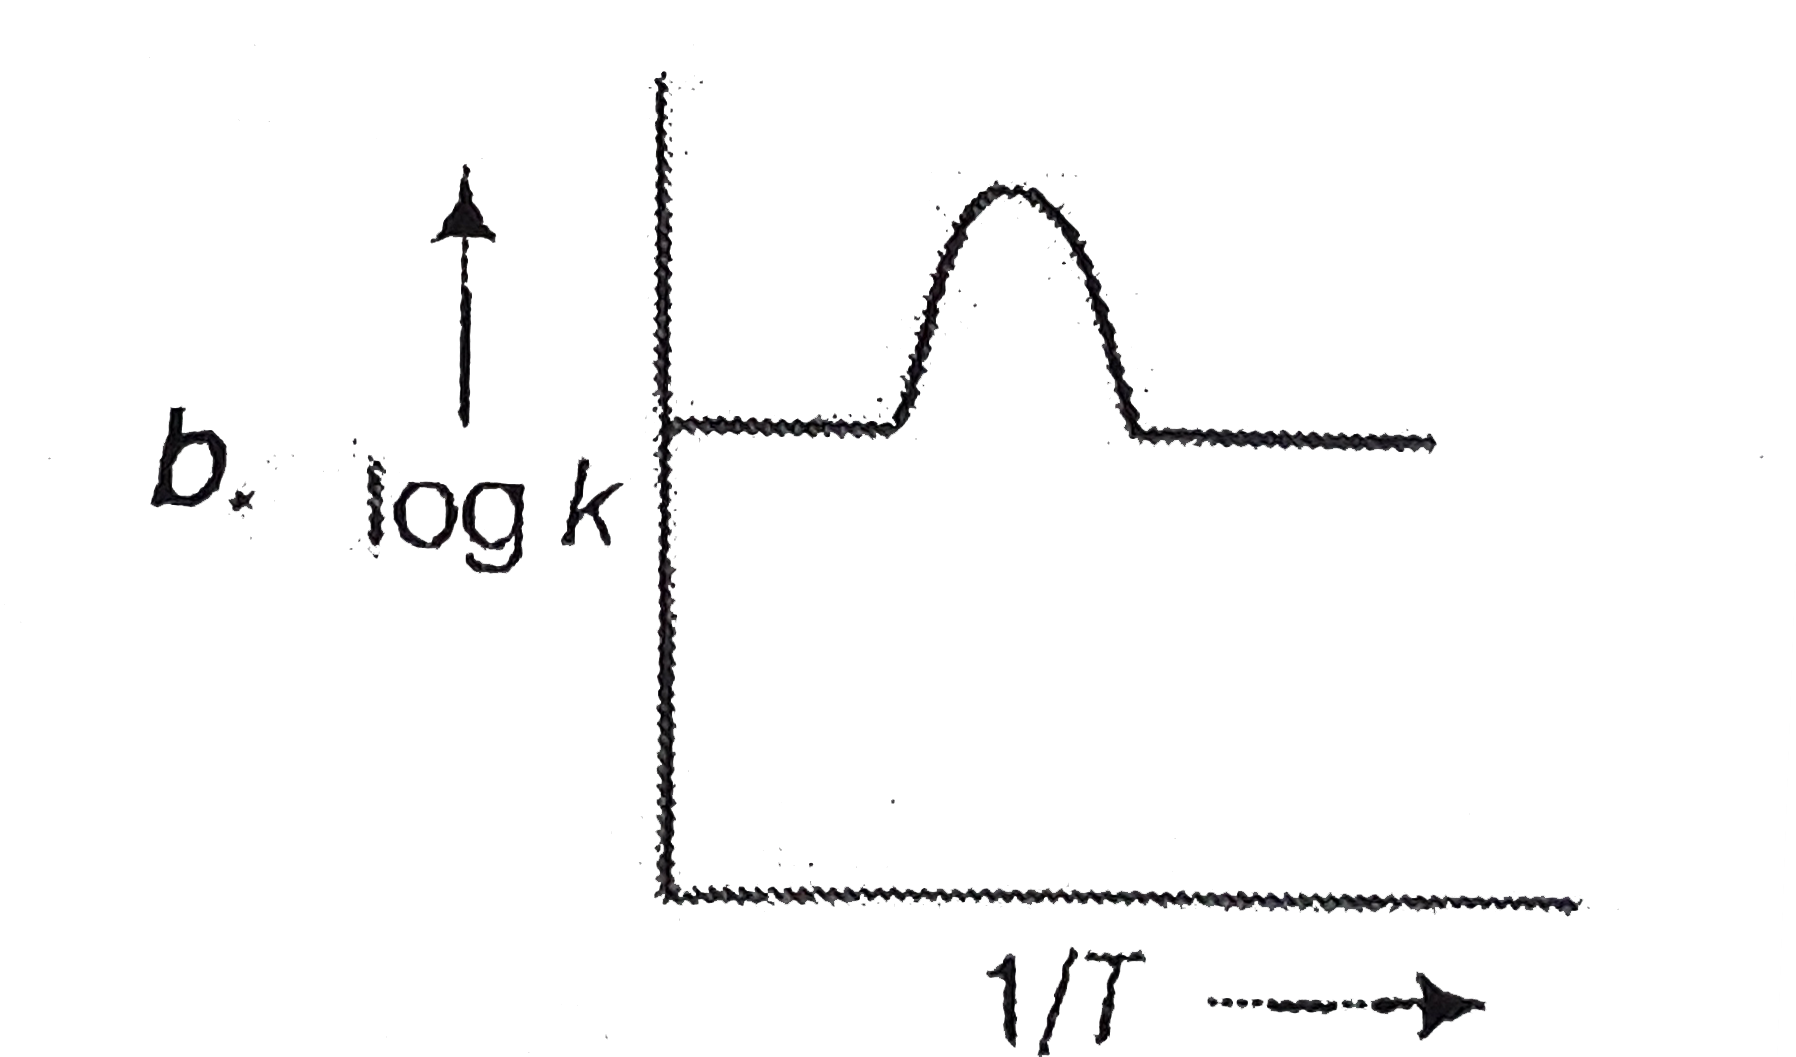 C
C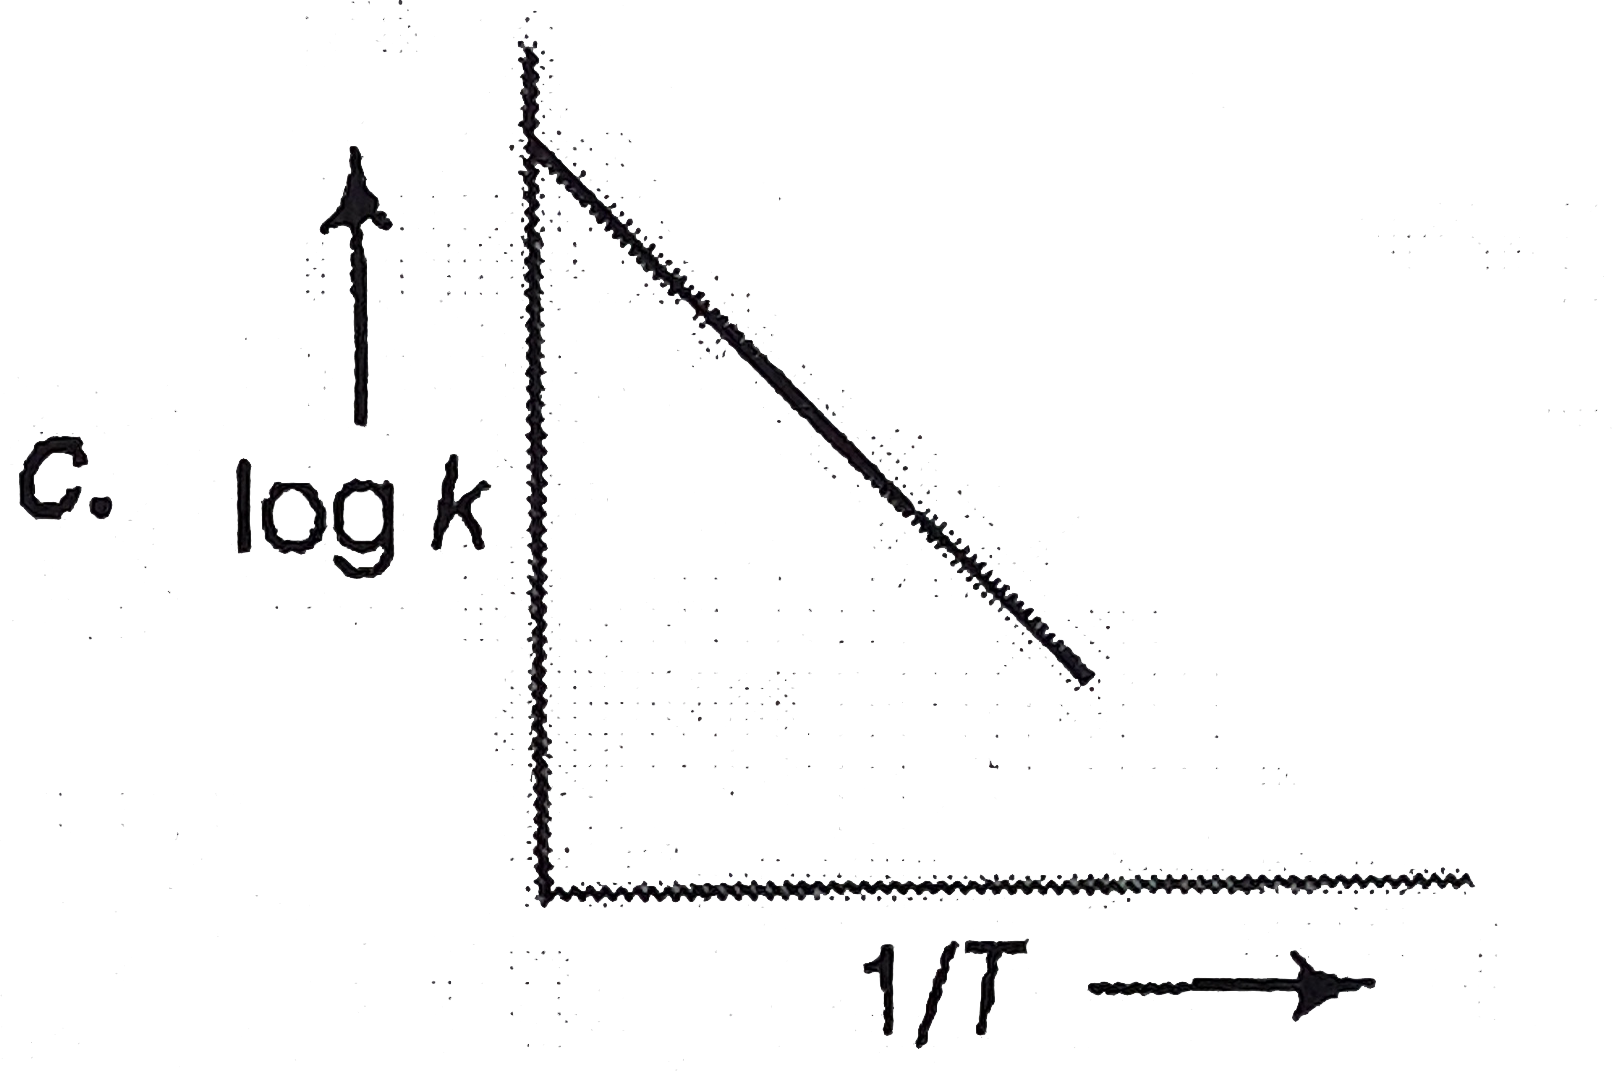 D
D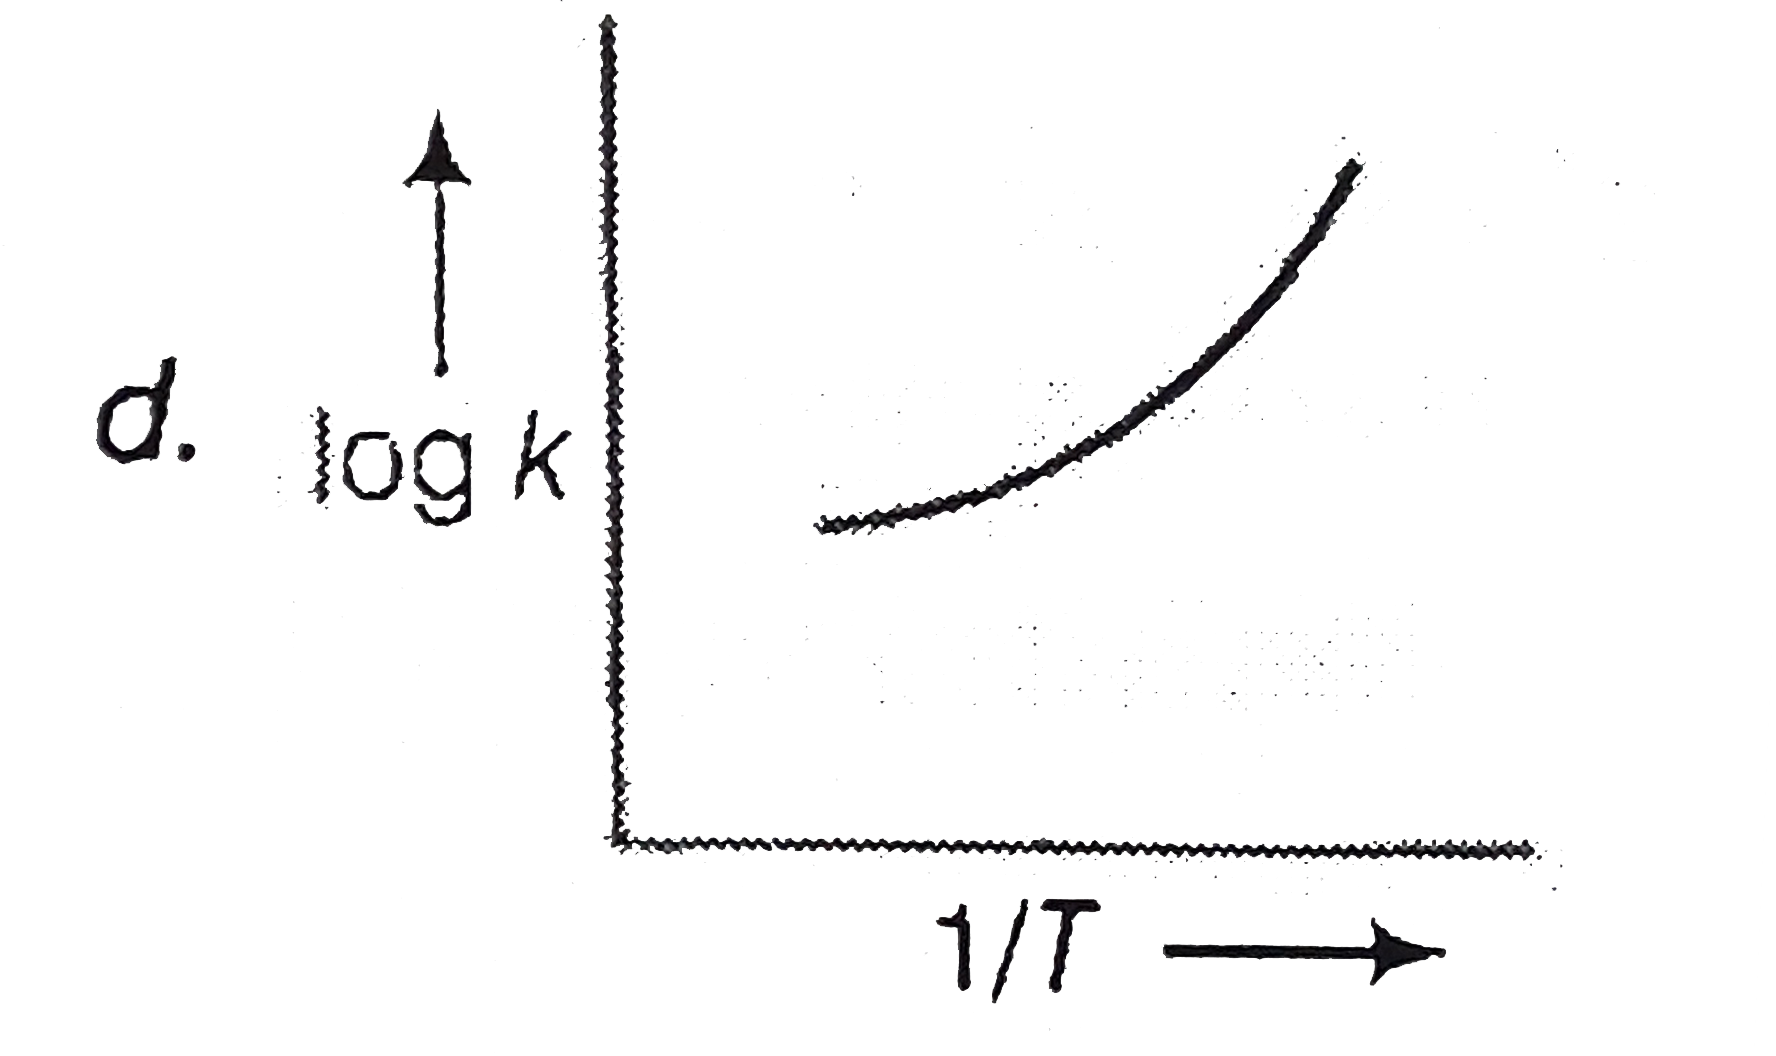
For which of the reversible reaction Kp=Kc
AN2(g)+3H2(g)⇔2NH3(g)B2SO2(g)+O2(g)⇔2SO3(g)CPCl3(g)+Cl2(g)⇔PCl3(g)DN2(g)+O2(g)⇔2NO(g)For a first order reaction, when a graph is plotted between log10([A])0([A])t on y-axis and time (t) on x-axis , slope of the graph of the graph is equal to __________.
A−KBKC−K2.303DK2.303
For a hypothetical reaction: A(g)+B(g)⇔C(g)+D(g) a graph between log Keq and T− is striaght line as follows, where θ=tan−10.5 and OA=1.0 (S.I. units) Assuming ΔH∘ is independent of temperature, the equilibrium constant at 298 K will be:
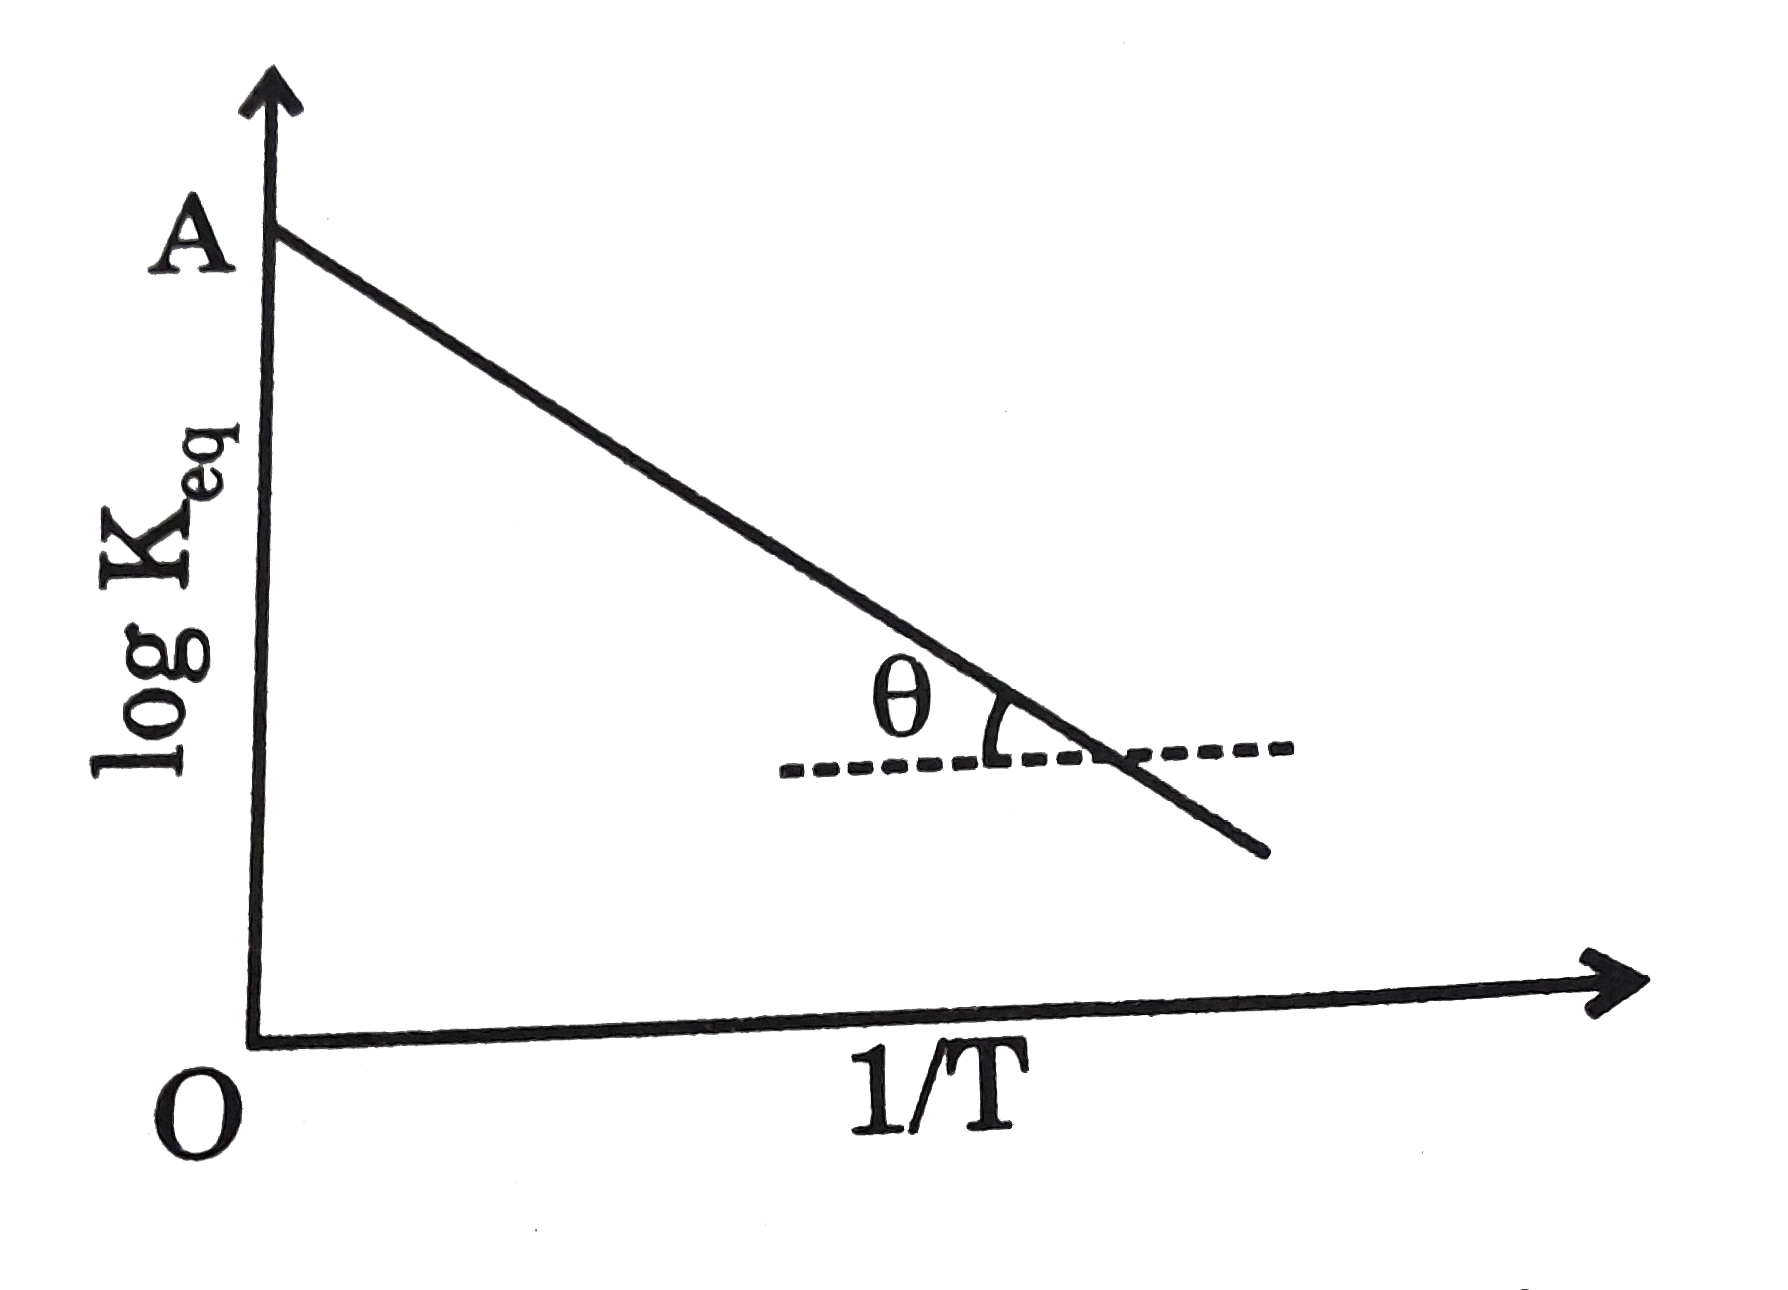
View SolutionThe graph relates. In Keq.vs.1T for a reaction. The reaction must be:
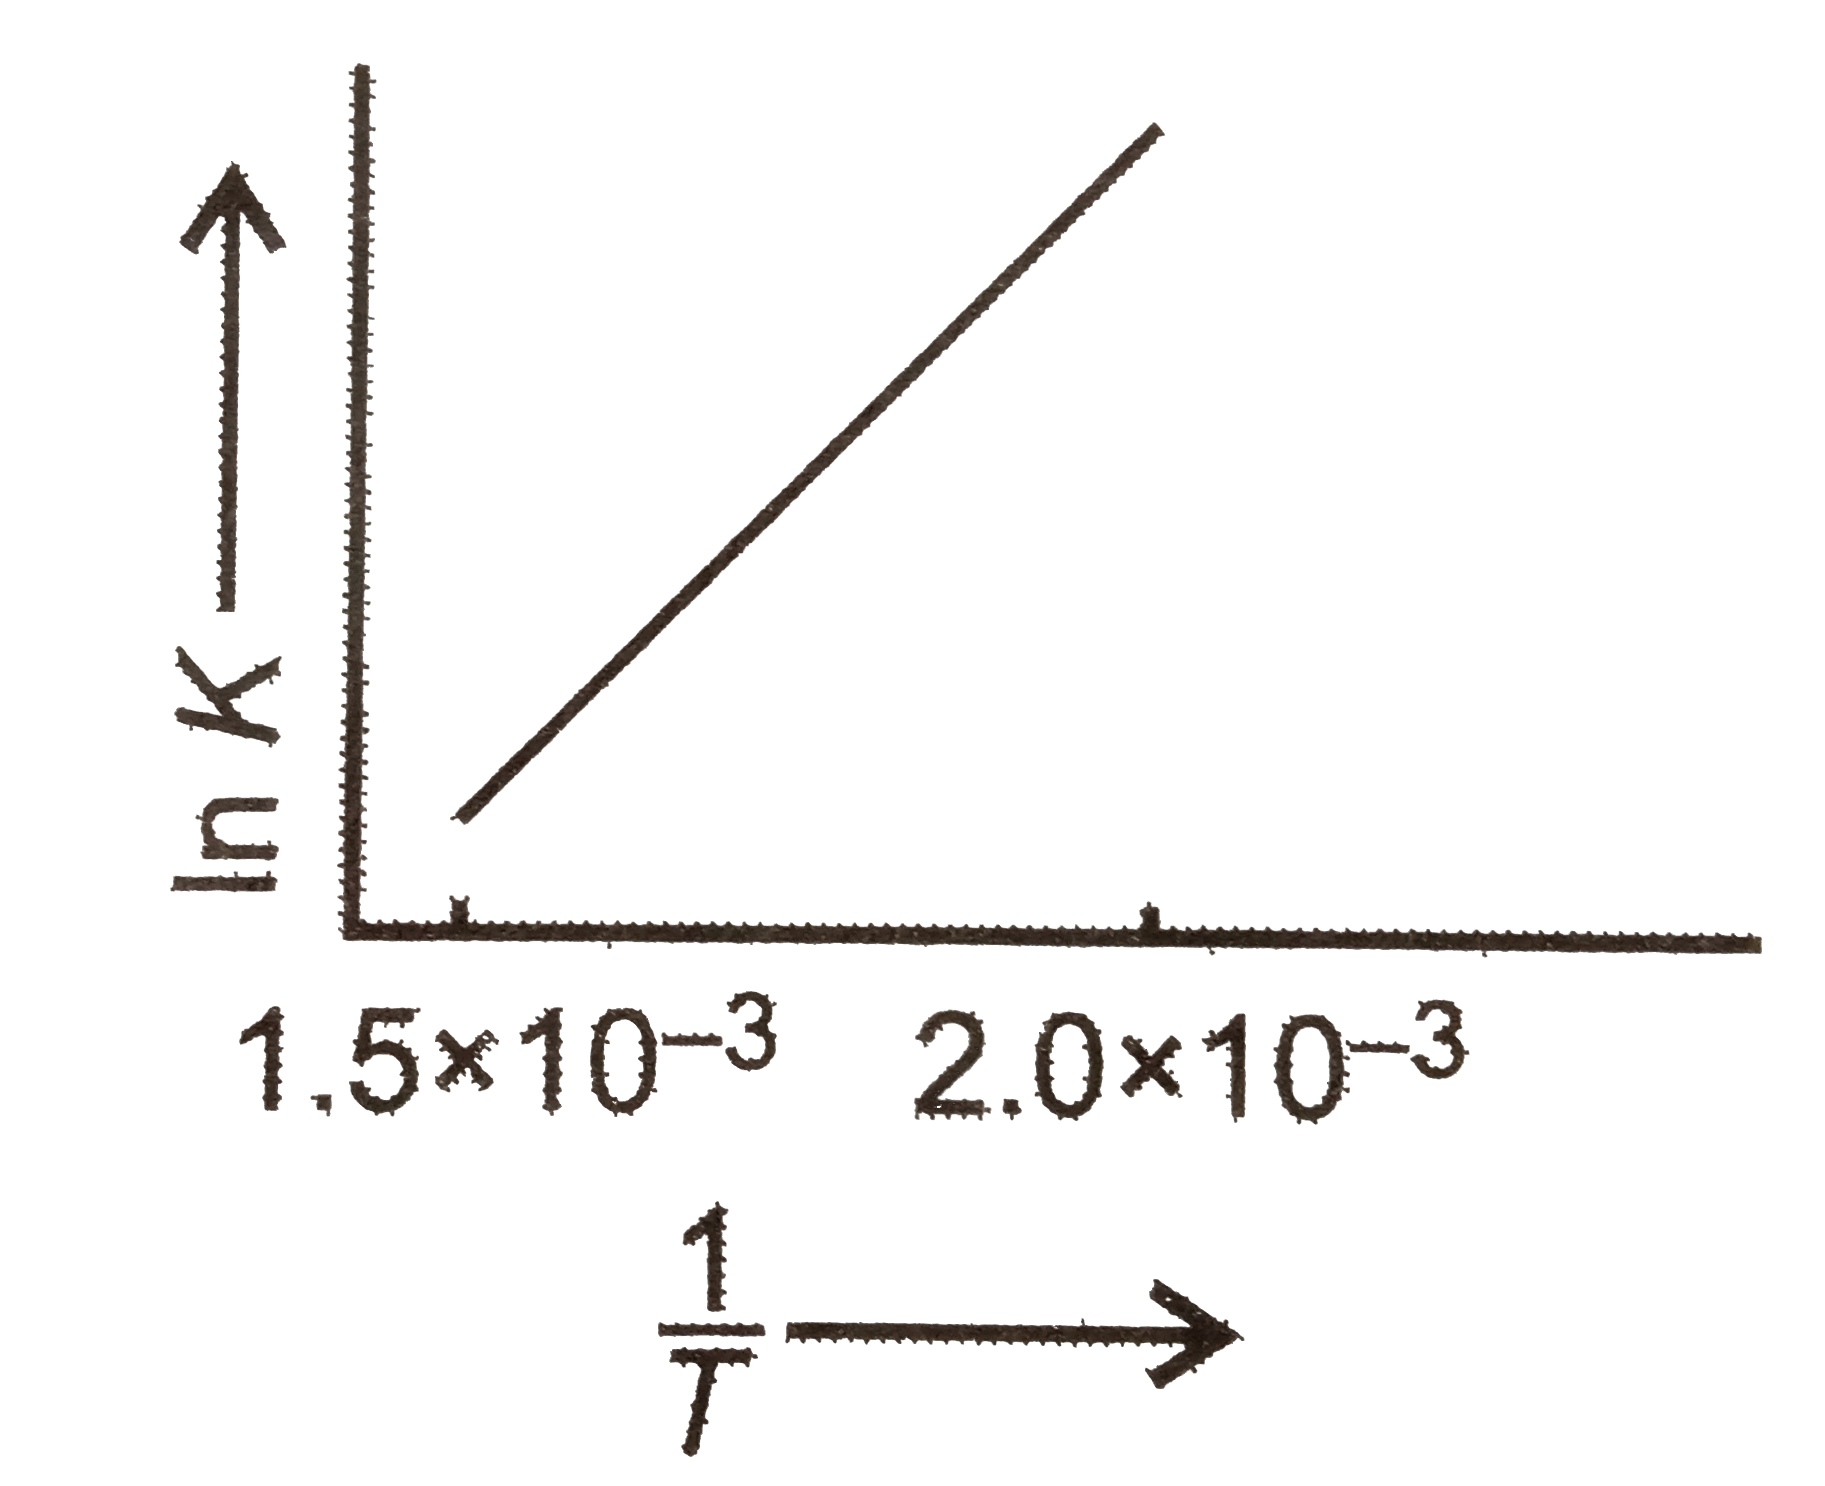
View SolutionFollowing reaction can take place in both direction Ak1⇐⇒k2B. Graph is given for the forward reaction. And for the beackward reaction, following data is obtained:
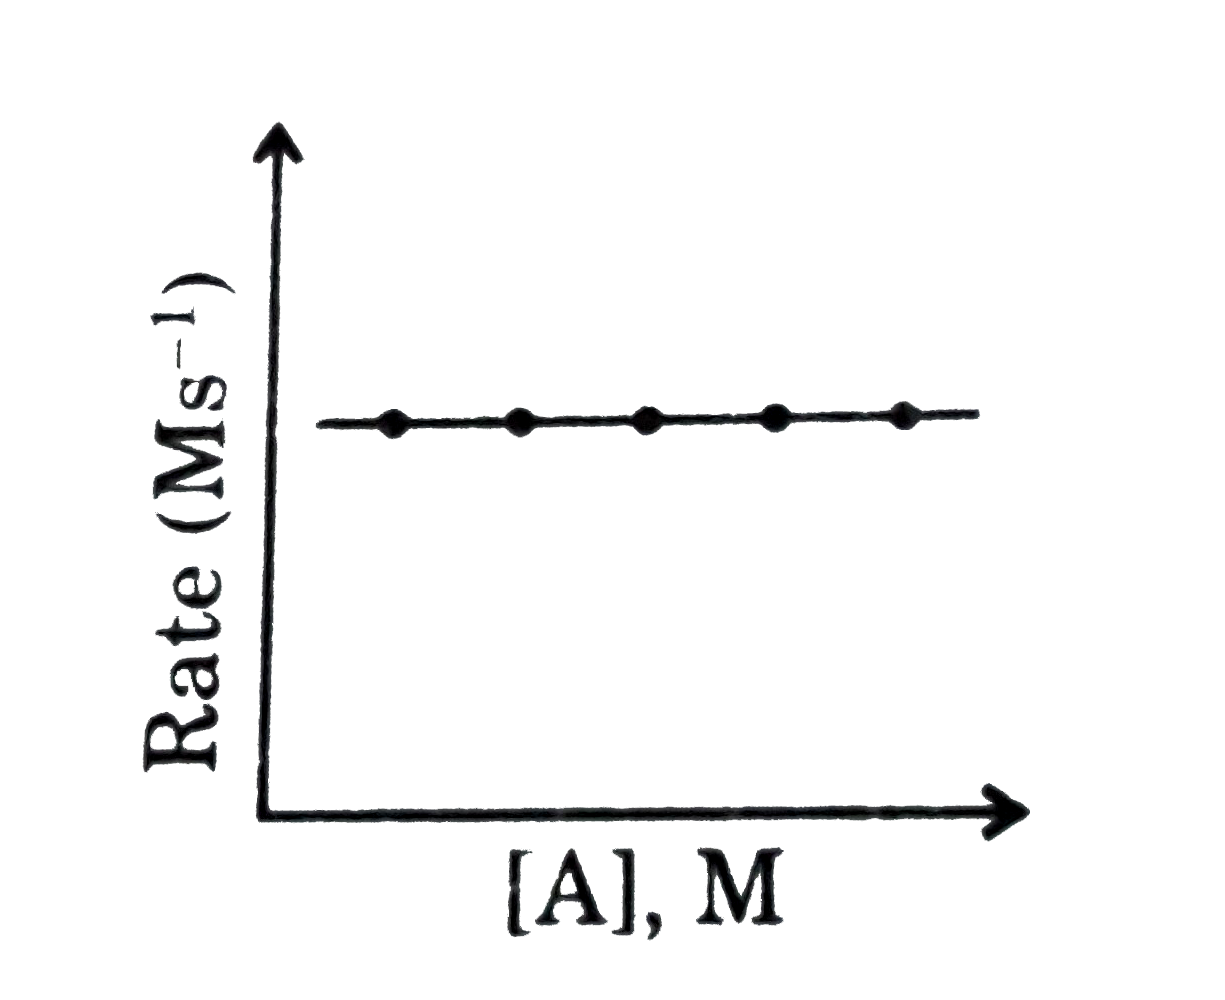
[B]Rate0.01M1×10−2Ms−10.02M2×10−2Ms−1
Hence, net reaction rate of B is:
View SolutionThe following graph is experimentally obtained for the reaction : A→2B, at 25∘C. The correct statement (s) for the reaction is/are (Given : ln 2 = 0.7)
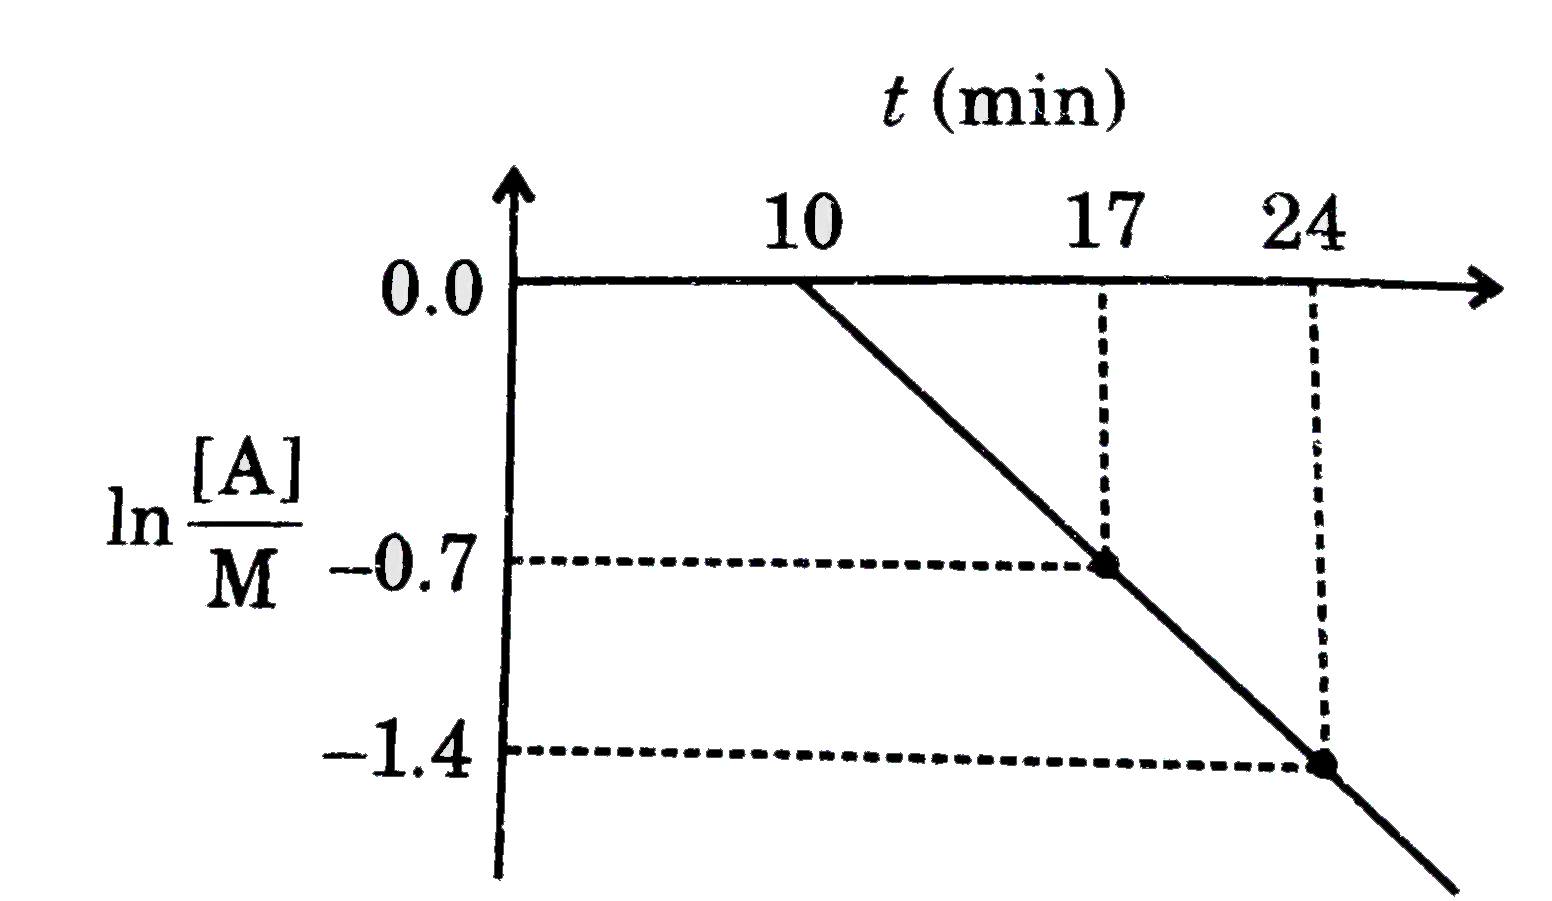
View SolutionFollowing is the graph between log T50 and log a (a = initial concentration) for a given reaction at 27∘C.
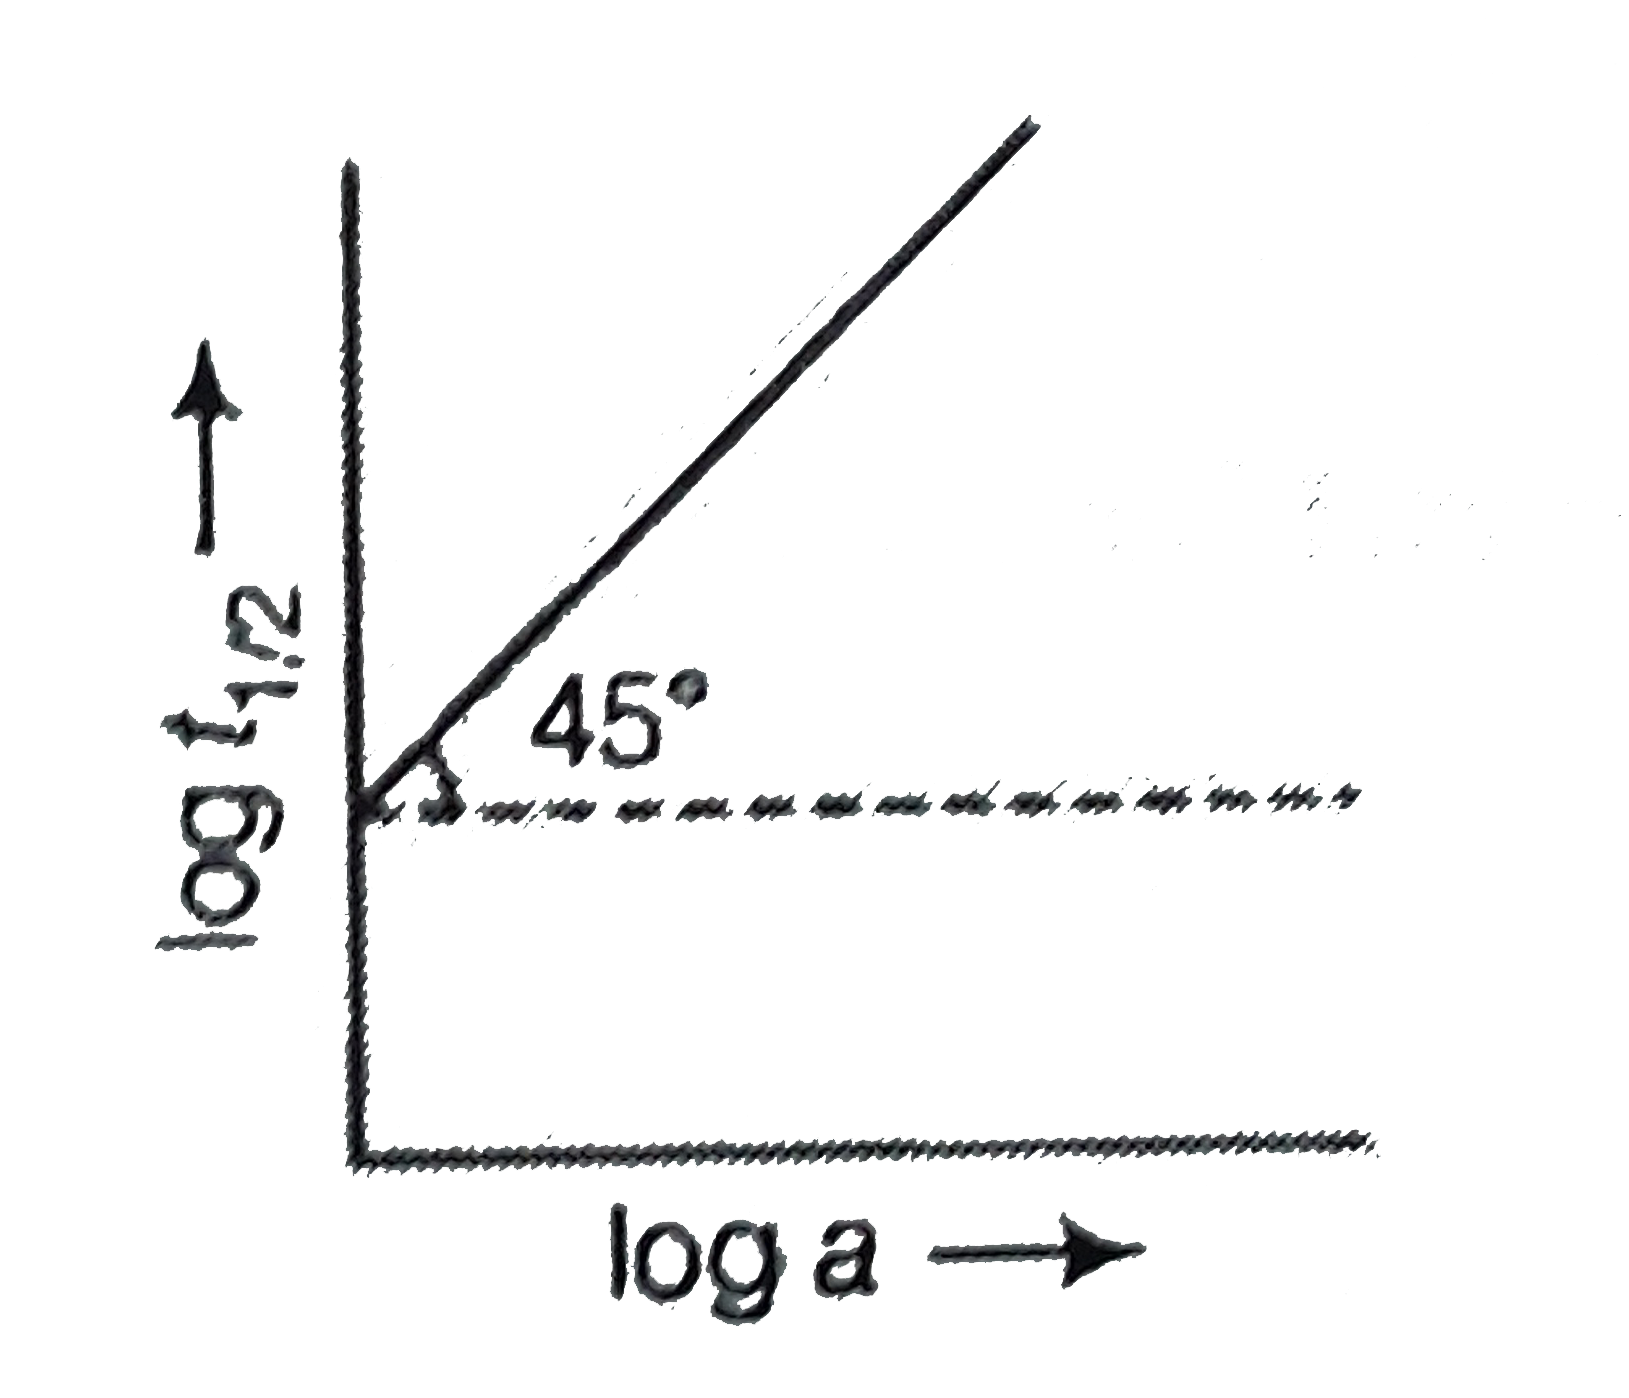
Hence, order is
View Solution

