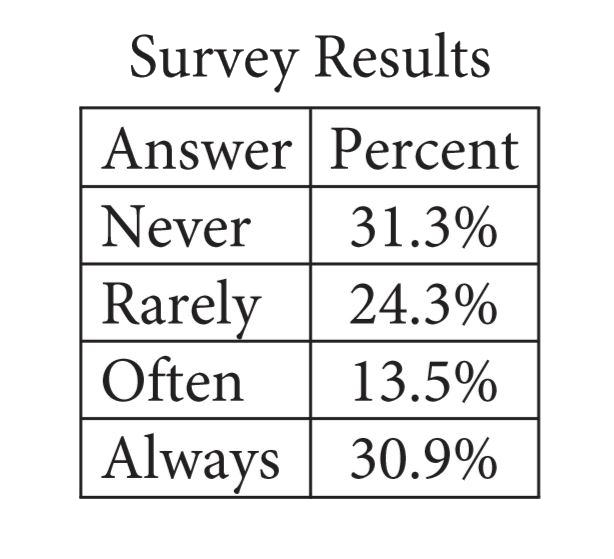
The table above shows the result of a survey of adults over 18. Each person had to pick one of 3 choices : looking forward to a televised game, looking forward to the commercials , or not planning to watch . Based on the table , if a woman was polled at random , what is the probability , as a percent , that she would respond that she was looking forward to the commercials ?
15
30
51
66
The correct Answer is:B
Step by step video, text & image solution for The table above shows the result of a survey of adults over 18. Each person had to pick one of 3 choices : looking forward to a televised game, looking forward to the commercials , or not planning to watch . Based on the table , if a woman was polled at random , what is the probability , as a percent , that she would respond that she was looking forward to the commercials ? by Maths experts to help you in doubts & scoring excellent marks in Class 12 exams.
Similar Questions
Who put forward the periodic table?
View Solution
The table above shows the results of a survey in which tablet users were asked how often they would watch video advertisements in order to access streaming content for free. Based on the table, which of the following is closest to the probability that a tablet user answered “Always,” given that the tablet user did not answer “Never”?View Solution
Knowledge Check
- Question 1 - Select One

The table above summarizes the result of a survey taken at the end of last year's flu seson. What fraction of the people who got the flu were unvaccinnated?A23B49C38D112 - Question 2 - Select One

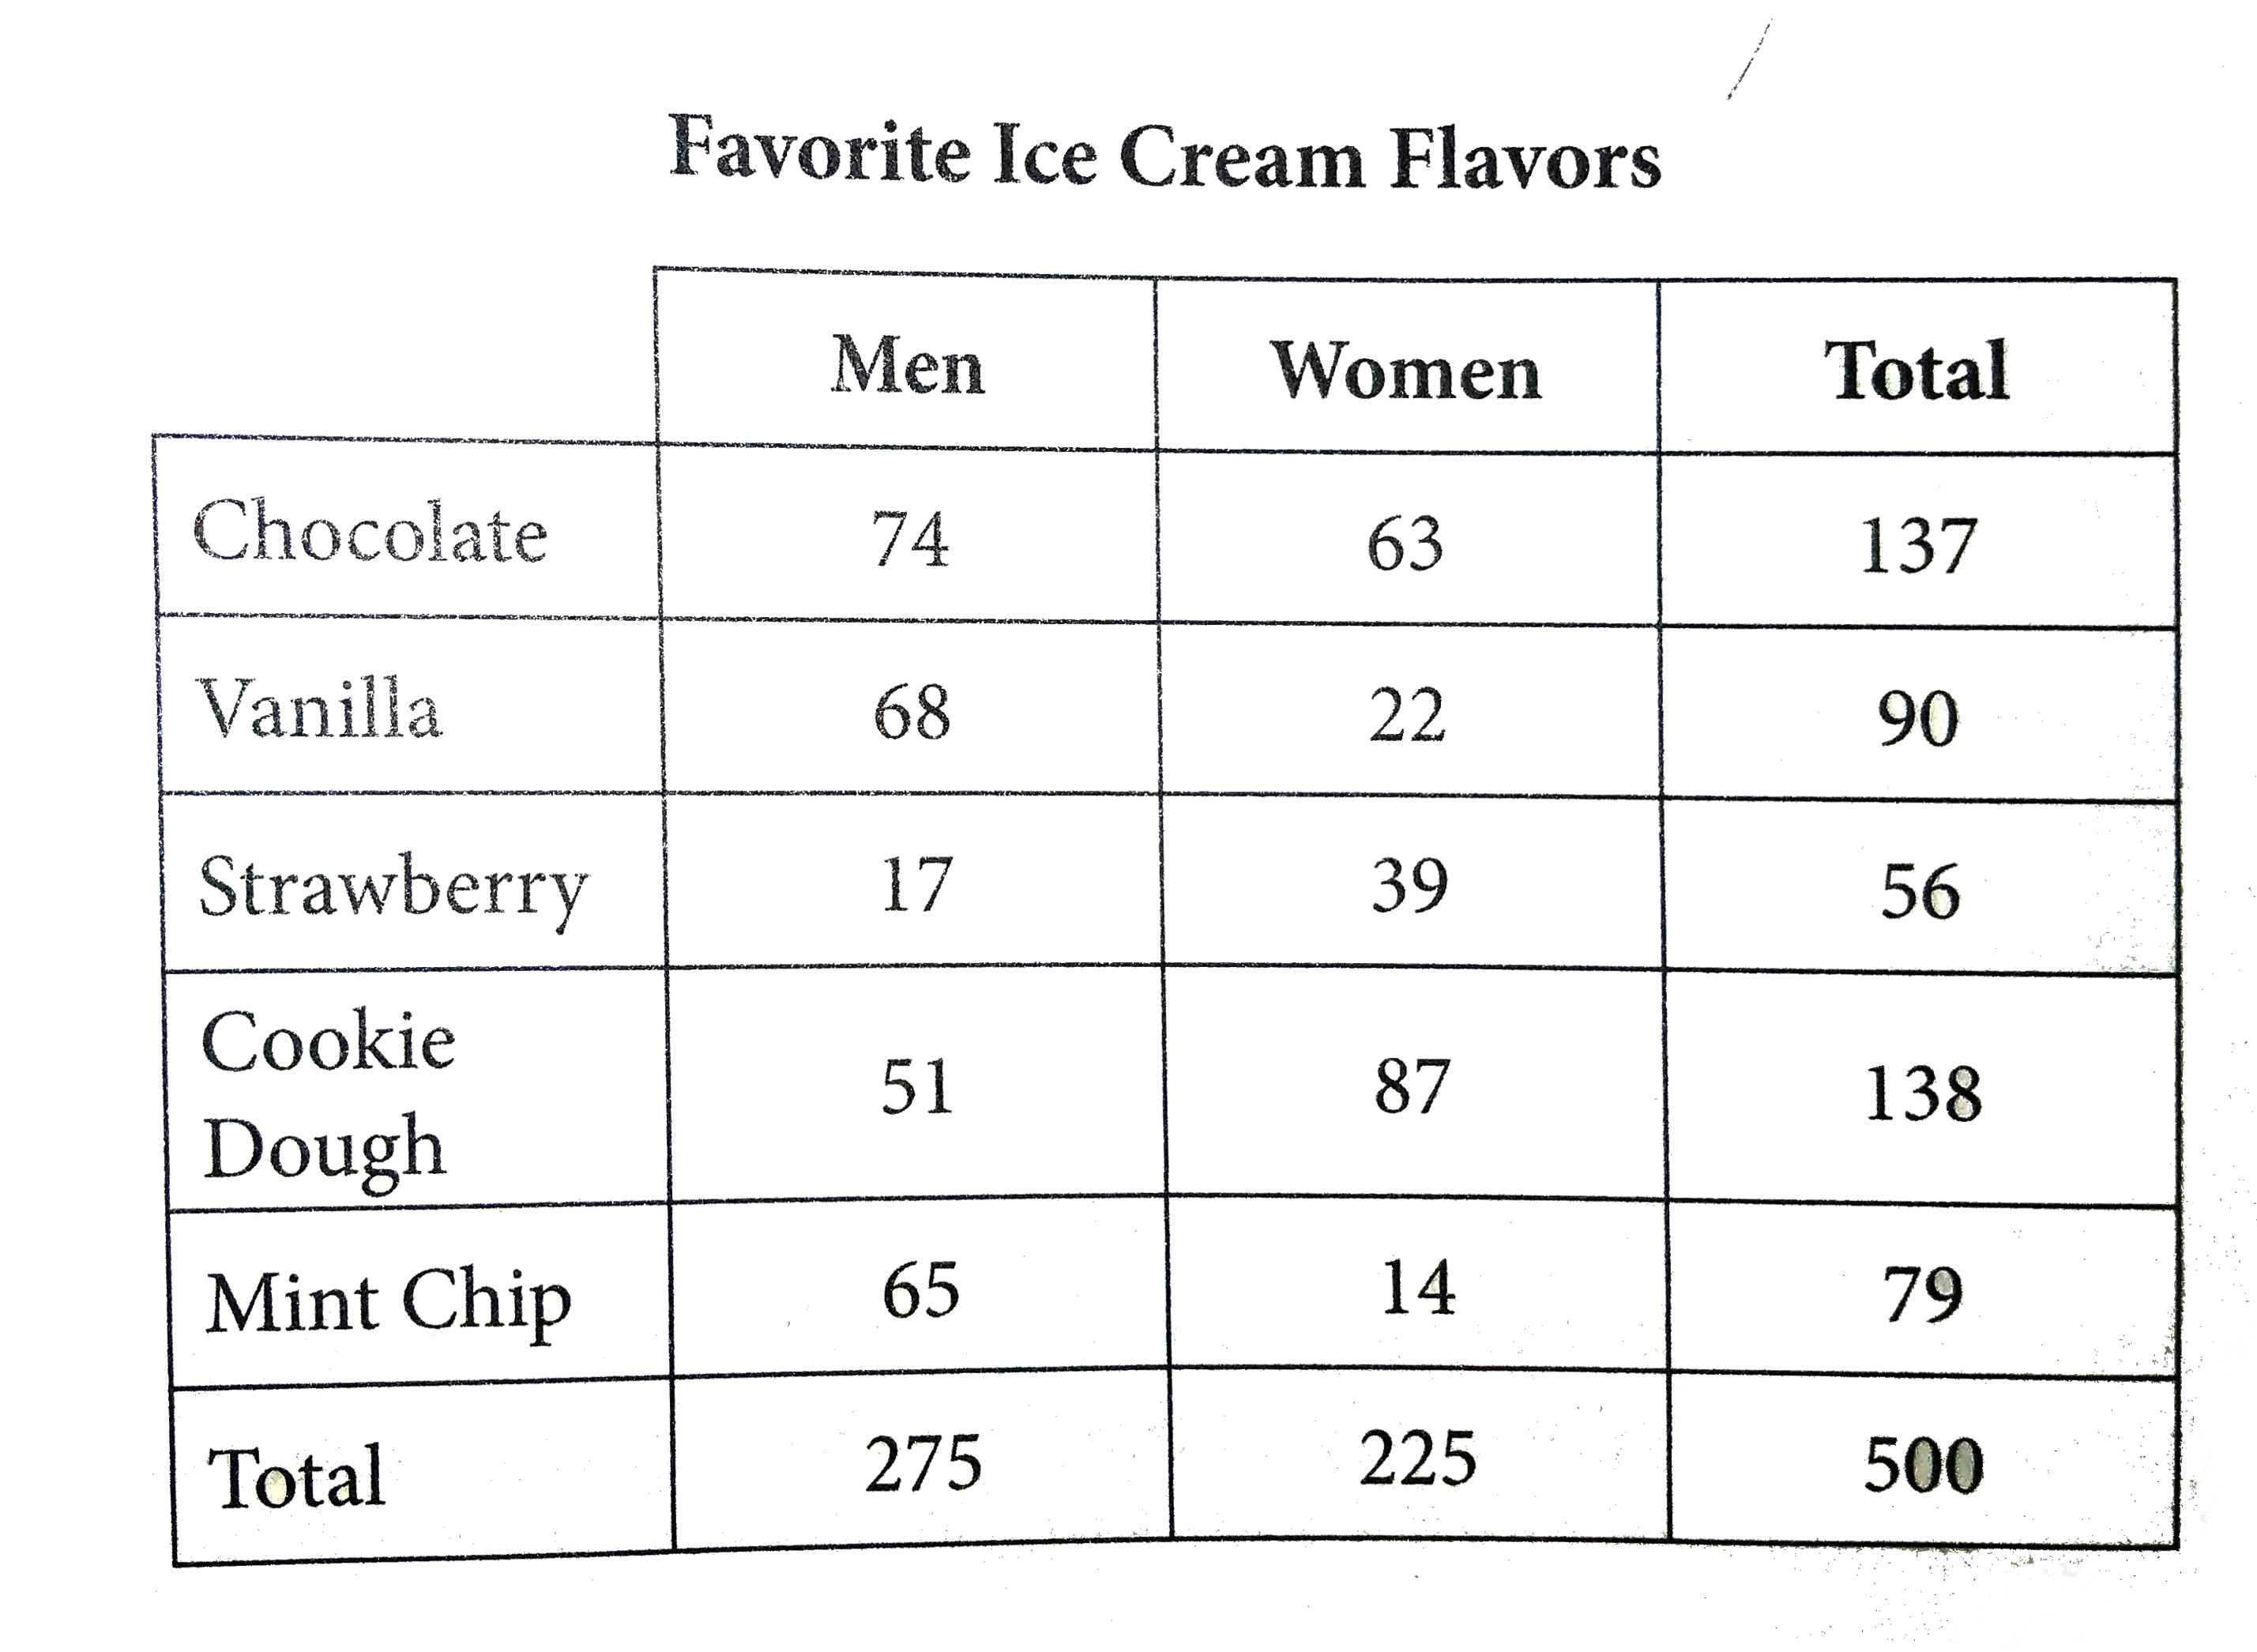
The table above shows the result of a random survey of 500 men and women. Each individual chose a flavor of ice cream that was his or her favorite.
Q. Approximately what percent of the men chose mint chip as their favorite ice cream flavor?A0.25B0.5C0.65D0.8 - Question 3 - Select One

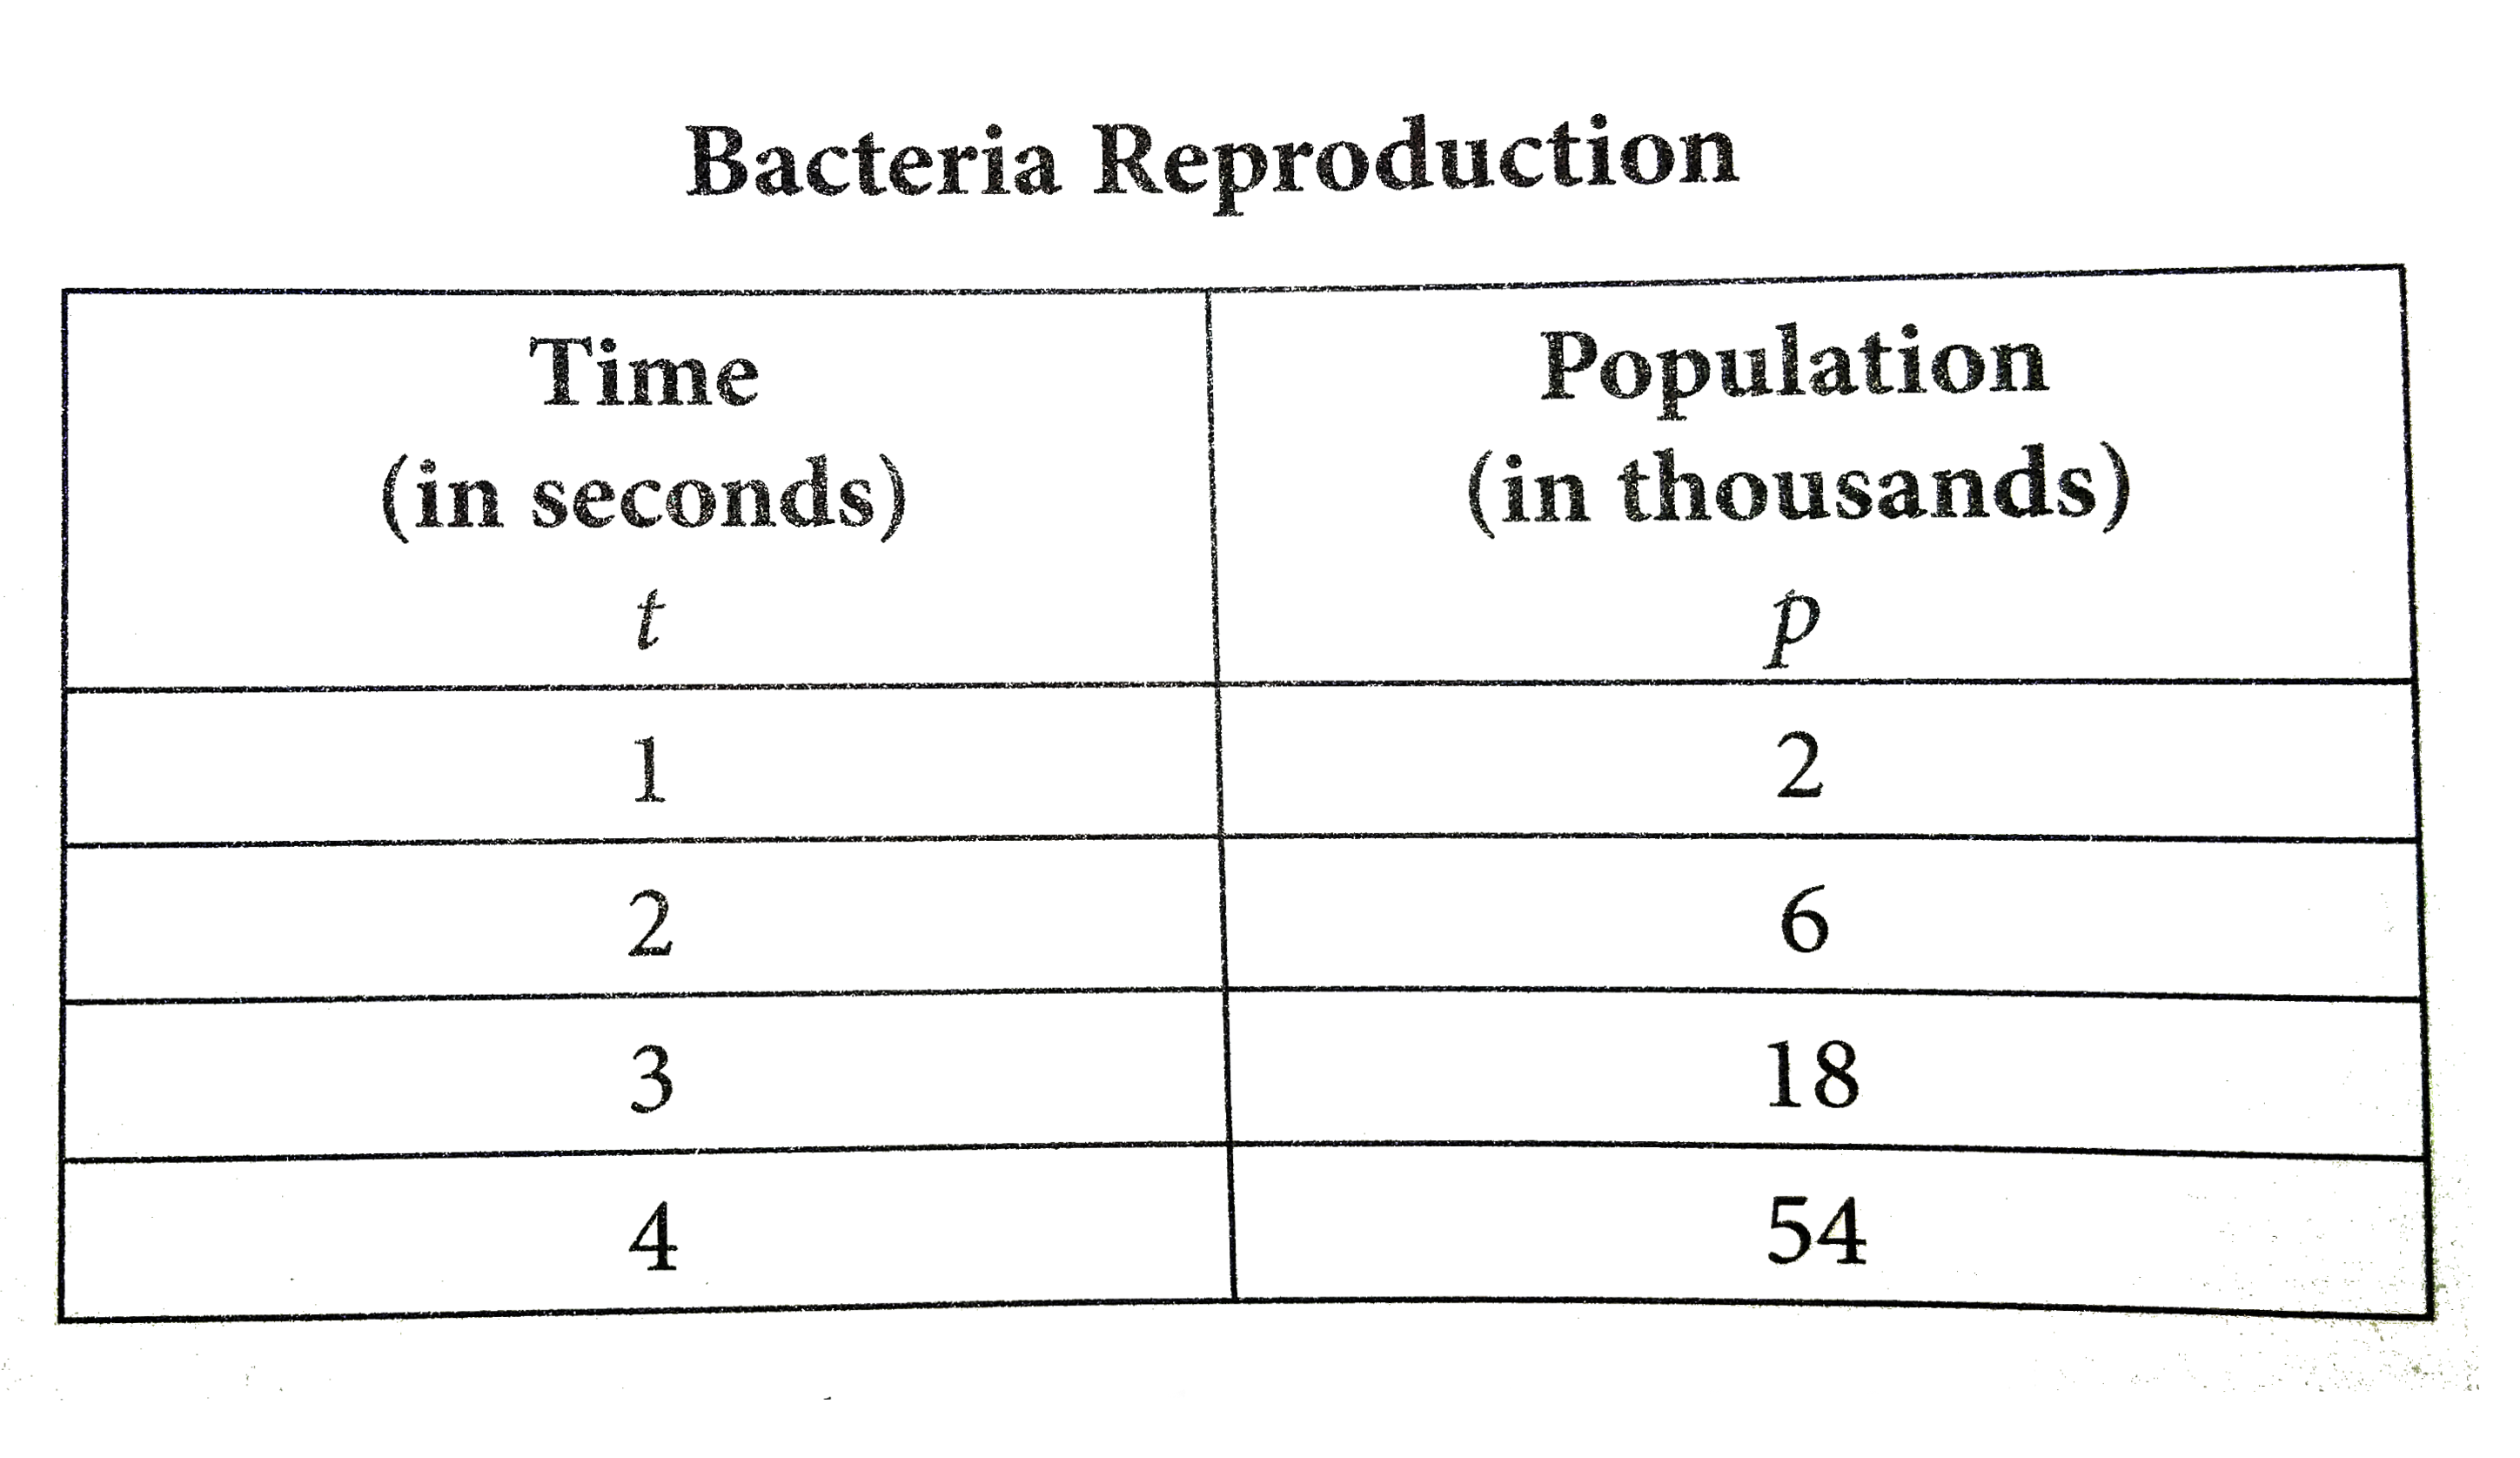
The table above shows the population growth of certain bacteria over four seconds. Which one of the following equations shows the relationship between t and p, according to the table?Ap=3tBp=2t2Cp=2×3tDp=2×3t−1
A survey of 650 men showed that only 52 of them know English. Out of these men, if one is selected at random, what is the probability that the selected man knows English.
View SolutionA recent survey found that the edges ages of workers in a factory as follow.

If a person is selected at random, find the probability that the person isView SolutionA lot of 100 watches is known to have 10 defective watches. If 8 watches are selected (one by one with replacement) at random, what is the probability that there will be at least one defective watch?
View SolutionA lot of 100 watches is known to have 10 defective watches. If 8 watches are selected (one by one with replacement) at random, then what is the probability that there will be atleast one defective watch ?
View SolutionWhich one of the following combination would a sugarcane farmer look for in the sugarcane crop
View Solution

