The following table gives the number of households in USA during 2000-2014.
The following charts give the distribution of households based on the numbers of children for the years 2000 and 2014.

The following charts give the distribution based on the number of childre for the year 2000 and 2014.
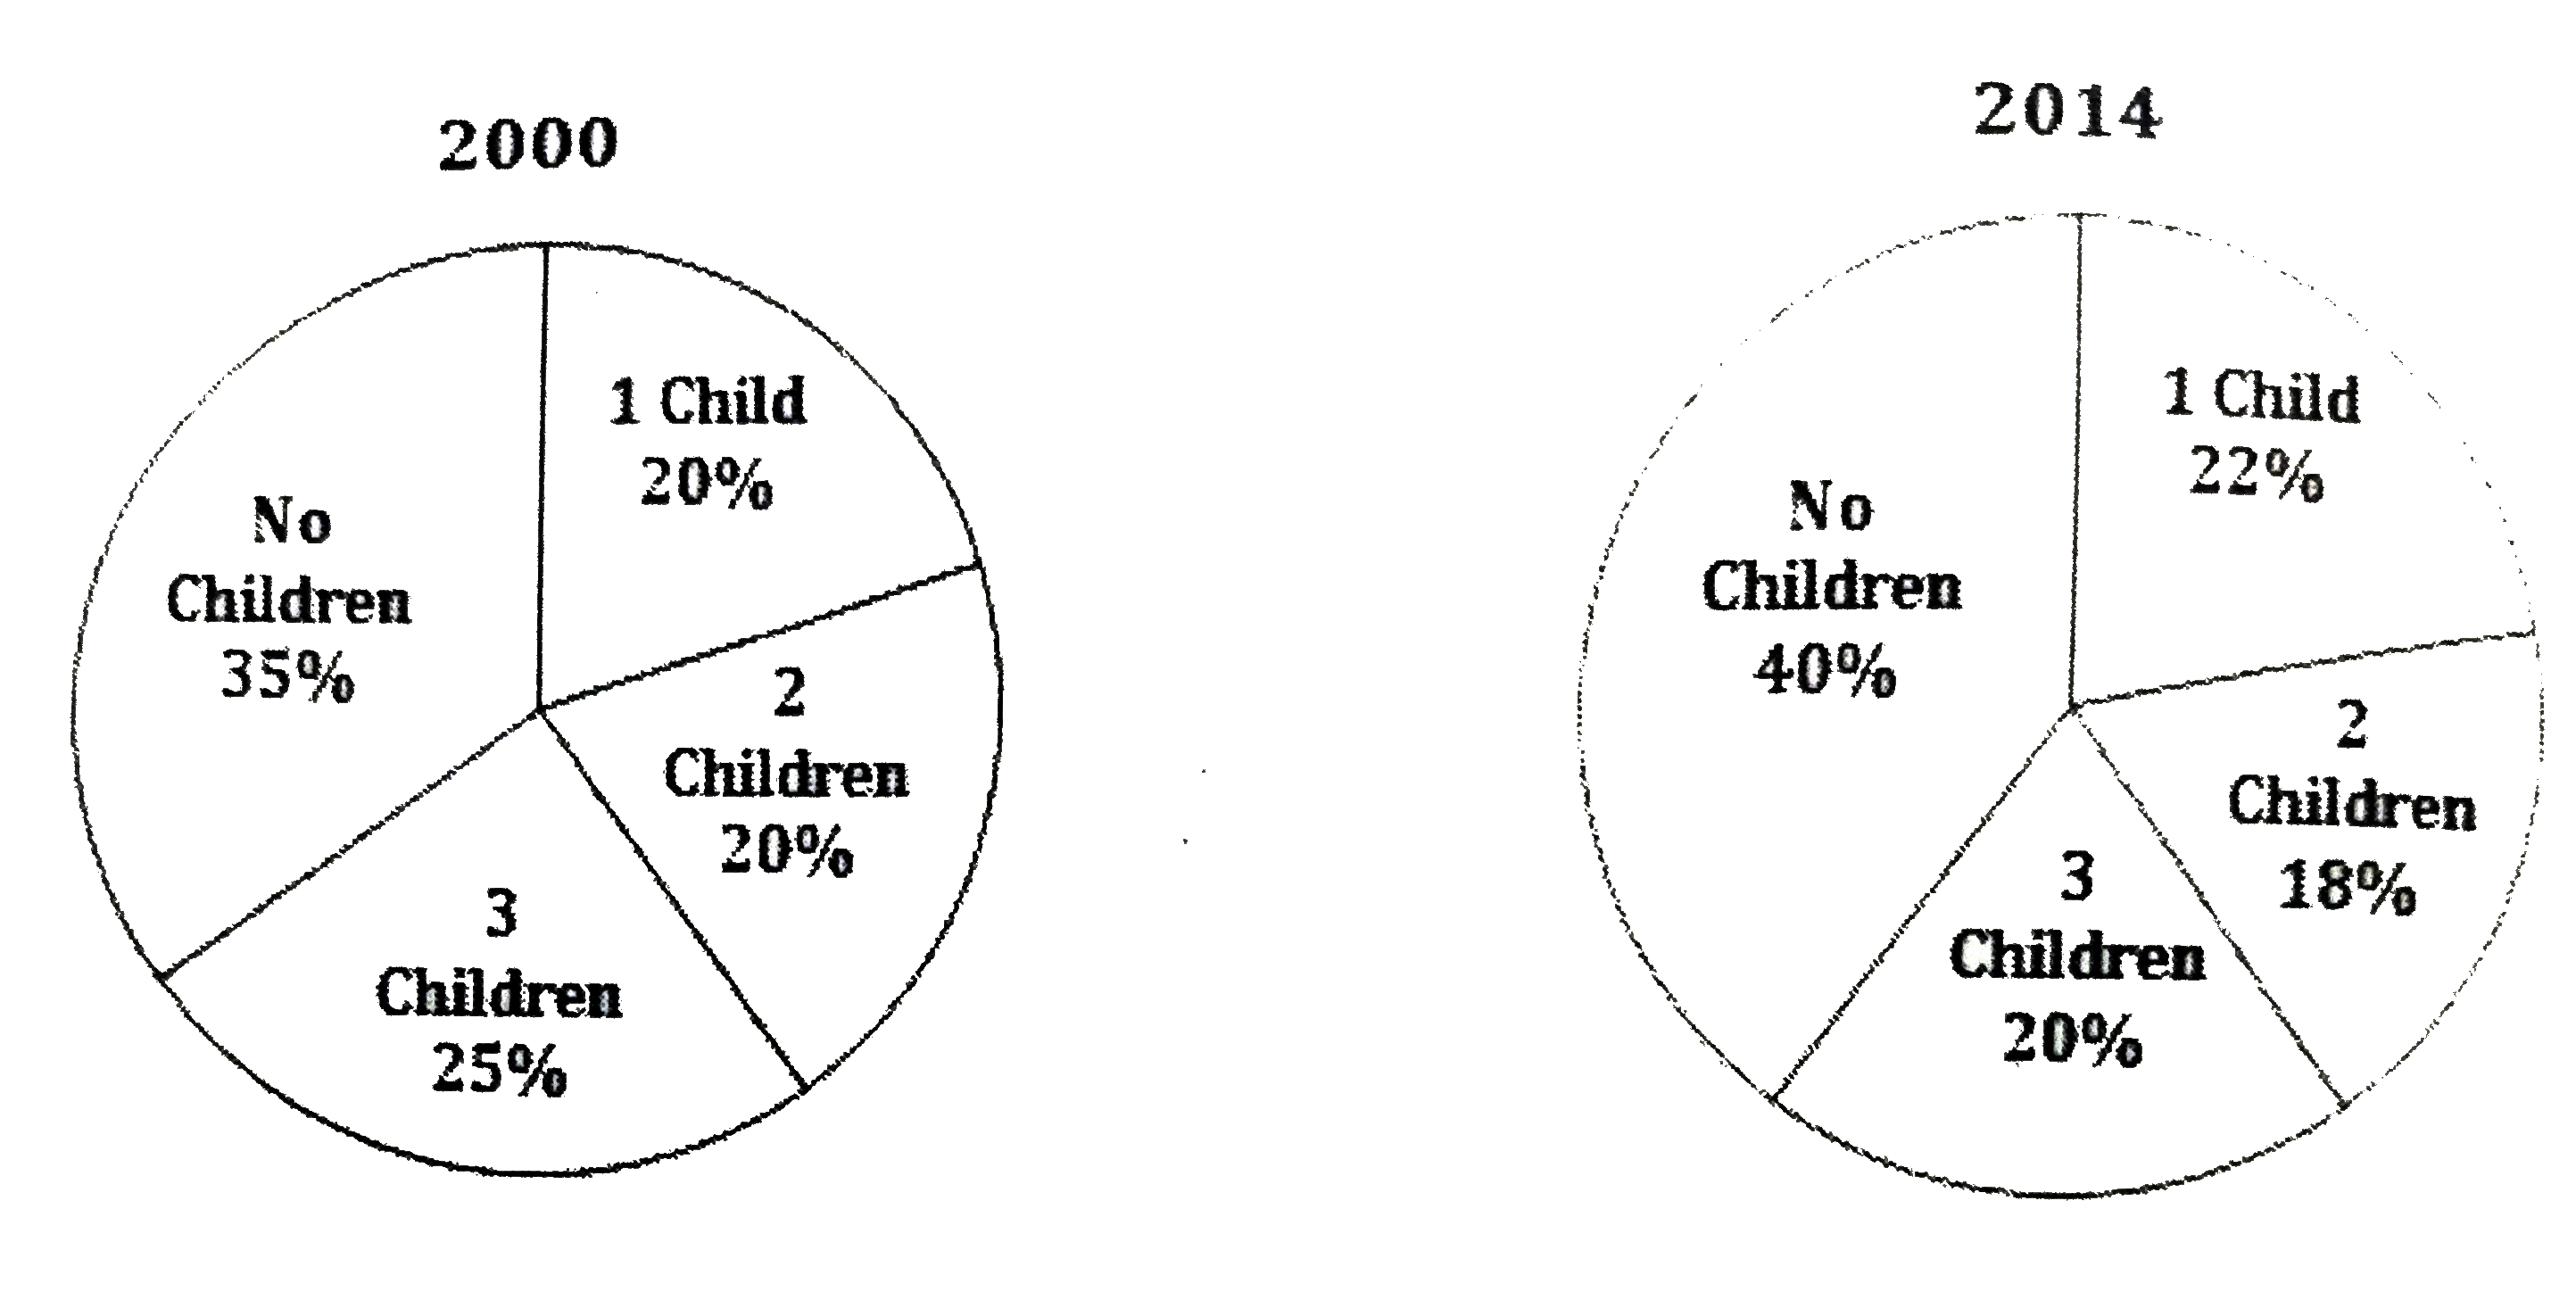
In the above problem, how many additional children were born in that year ?
8.4 million
13.2 million
15.0 million
17.6 million
The correct Answer is:B
Topper's Solved these Questions
Similar Questions
Knowledge Check
The following table gives the number of households in USA during 2000-2014.
The following charts give the distribution of households based on the numbers of children for the years 2000 and 2014.

The following charts give the distribution based on the number of childre for the year 2000 and 2014.
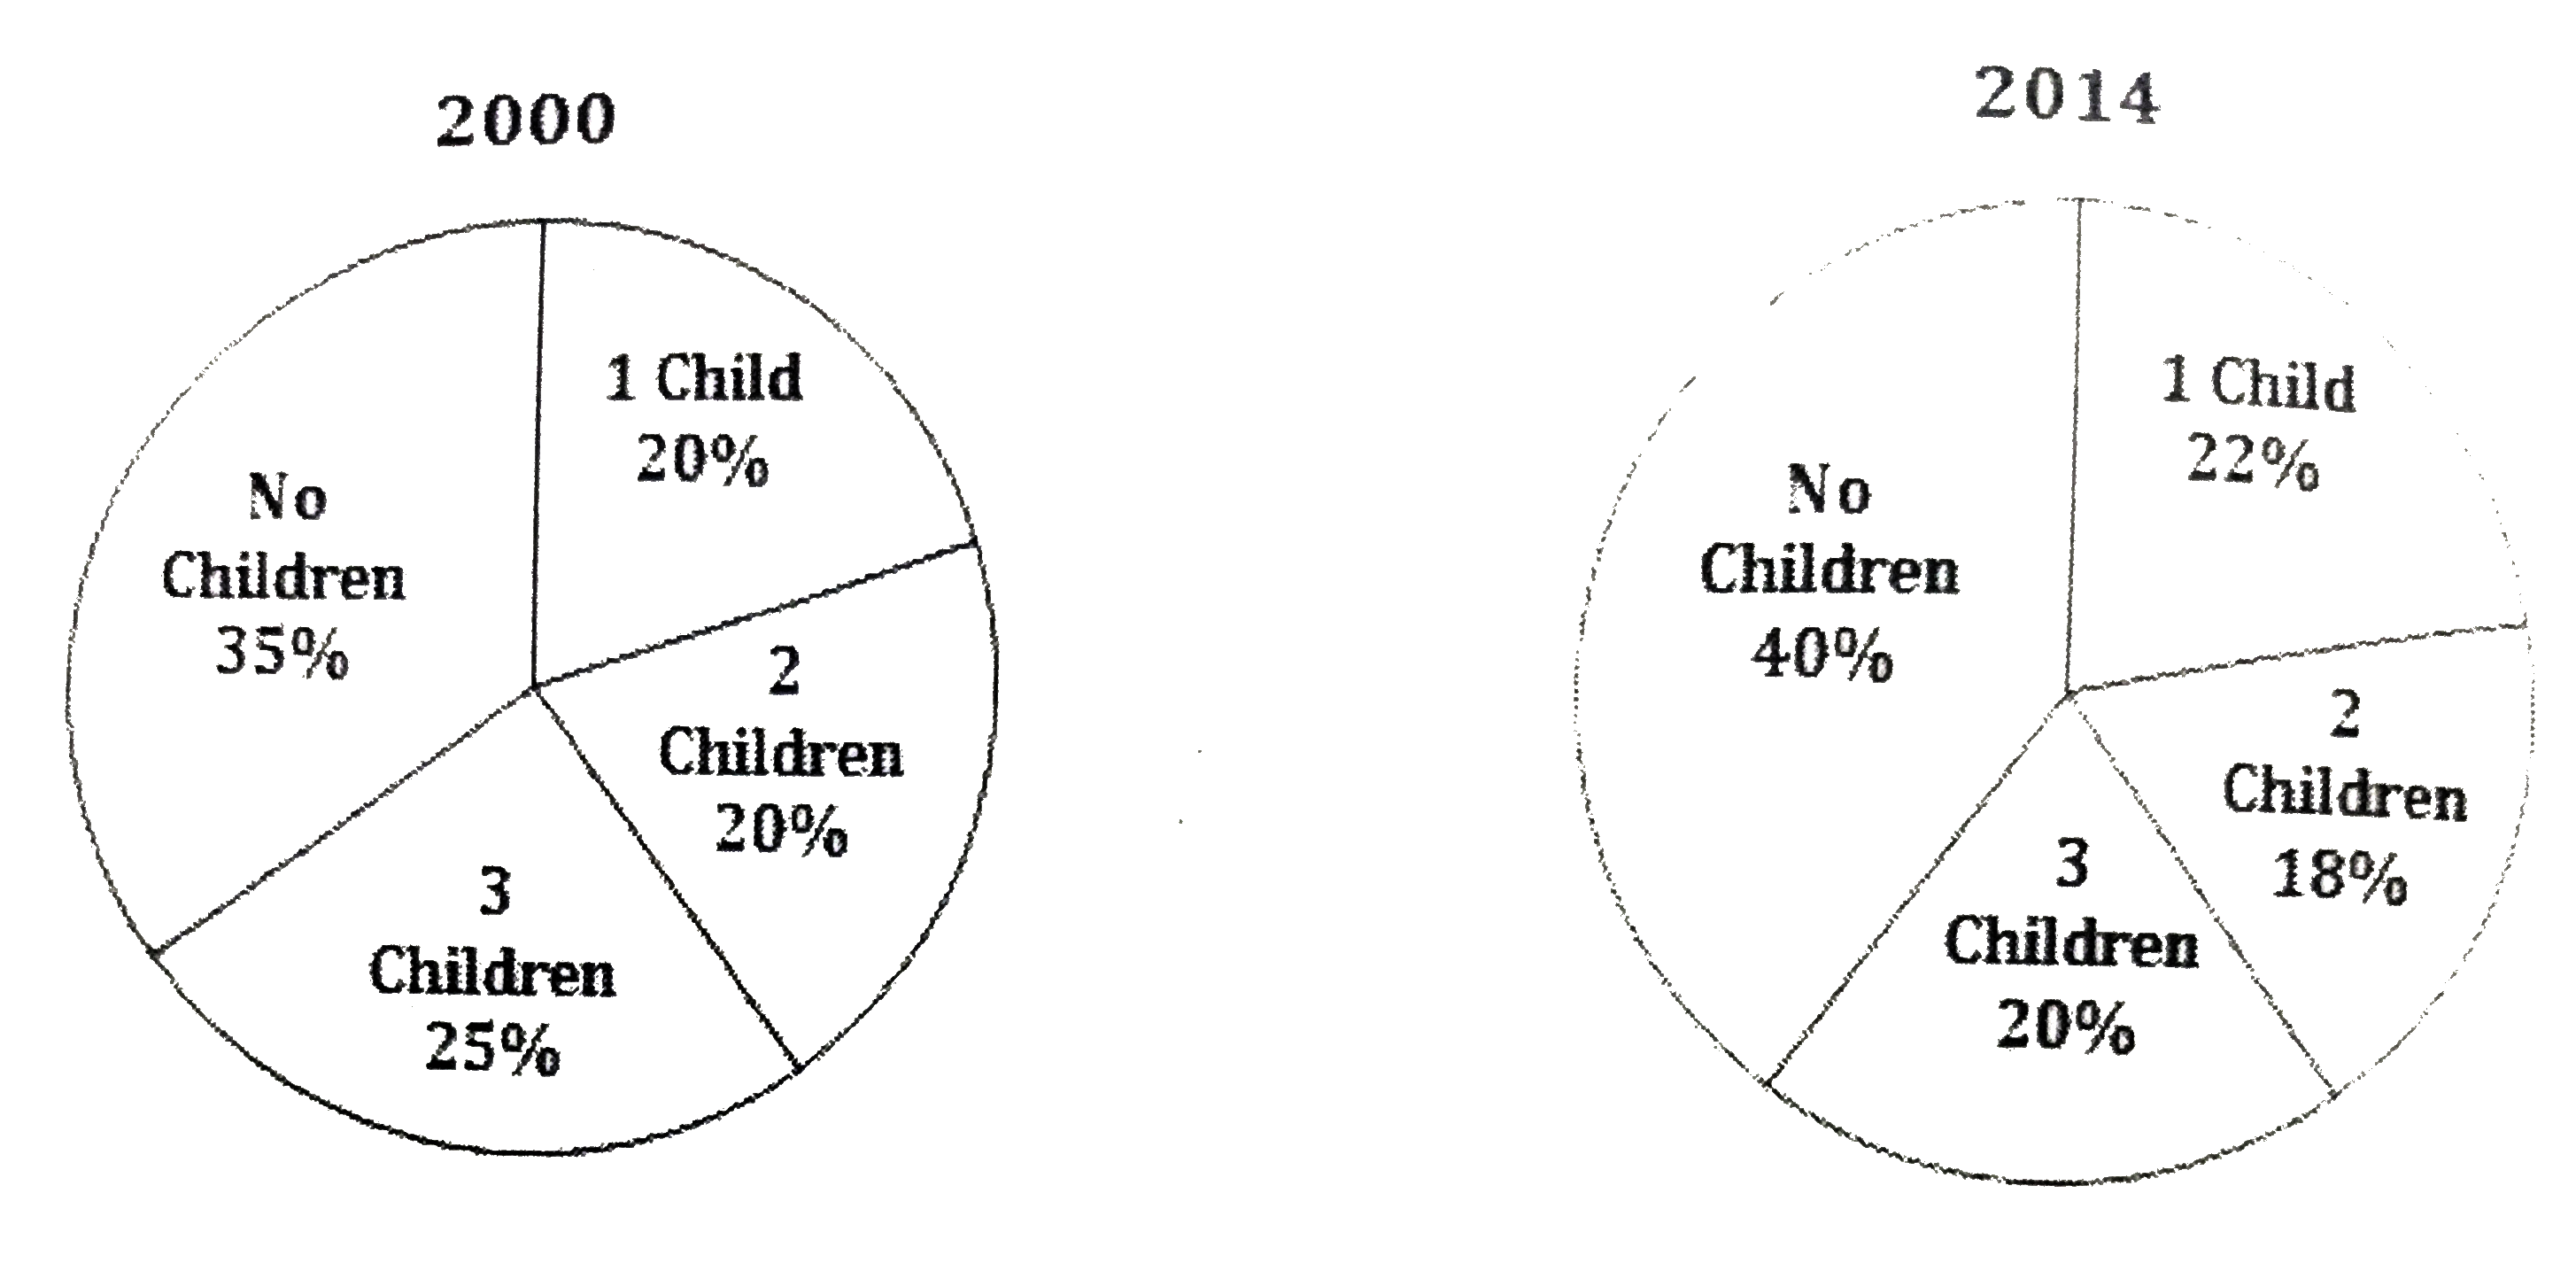
What is the total number of children in 2014?A57.0 millionB129.5 millionC171.1 millionD201.4 millionThe following table gives the number of households in USA during 2000-2014.
The following charts give the distribution of households based on the numbers of children for the years 2000 and 2014.

The following charts give the distribution based on the number of childre for the year 2000 and 2014.
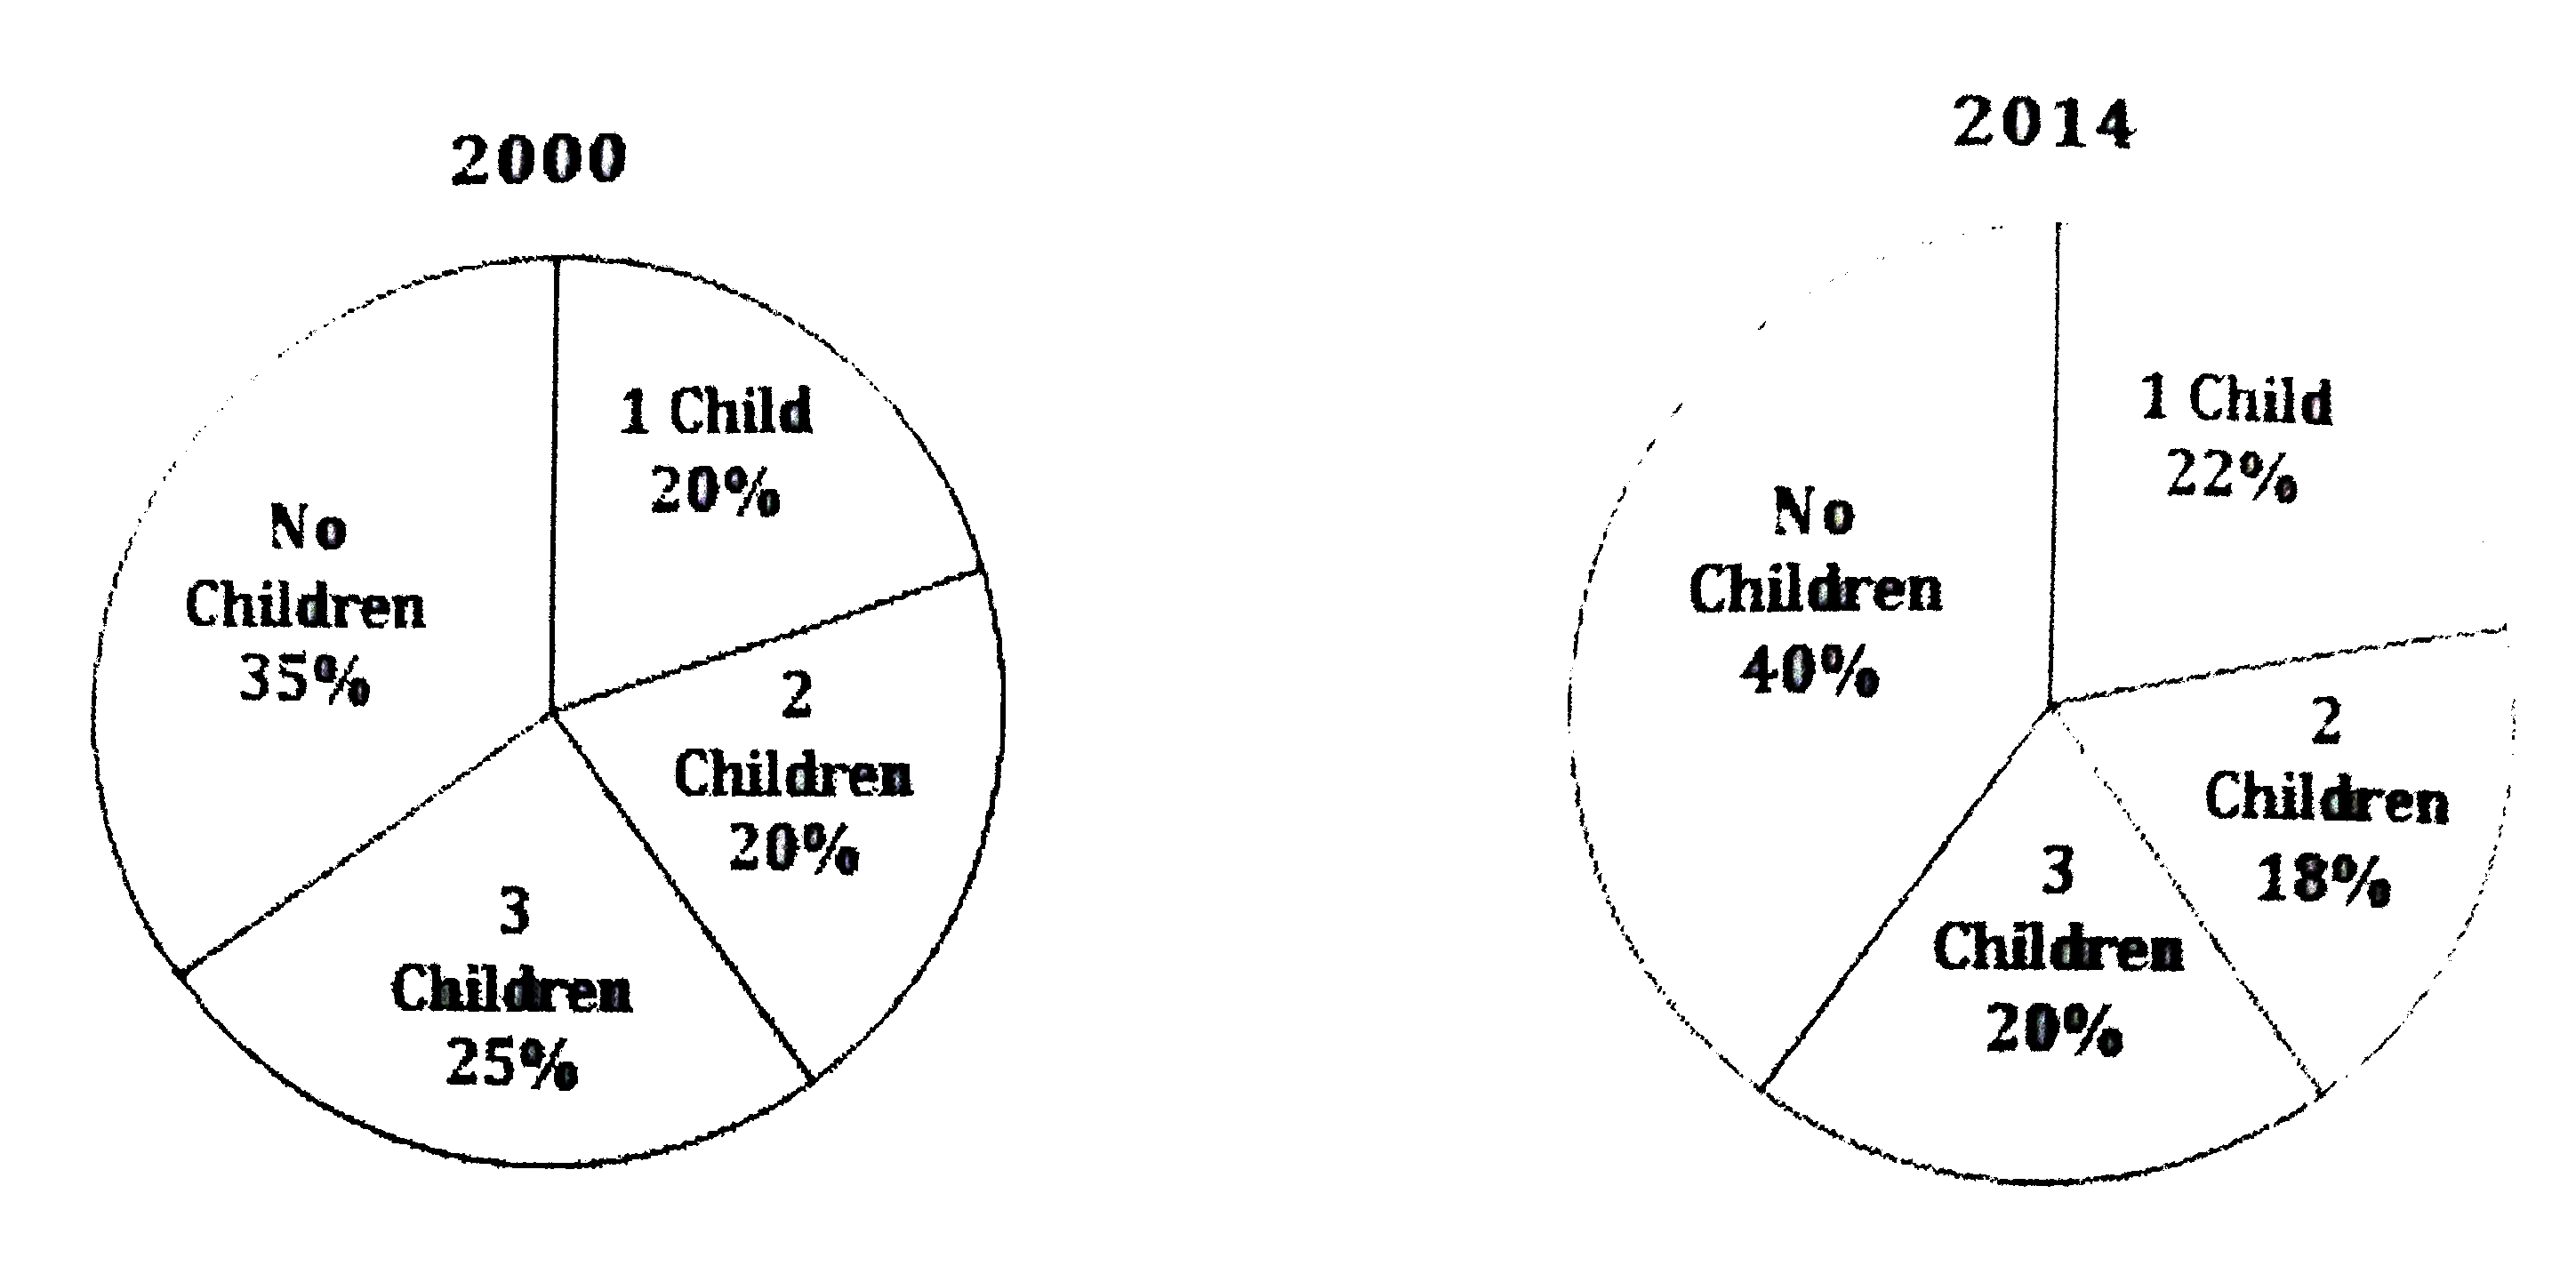
In 2000, 20 % of the household beloing to the category " no children " decided to have children . If those households had 1,2 and 3 children in the ratio of 4:2:1, respectively , what would be the share of households having 2 children ?A21.0%B22.0%C24.0%D26.4%The following table gives the number of households in USA during 2000-2014.
The following charts give the distribution of households based on the numbers of children for the years 2000 and 2014.

The following charts give the distribution based on the number of childre for the year 2000 and 2014.
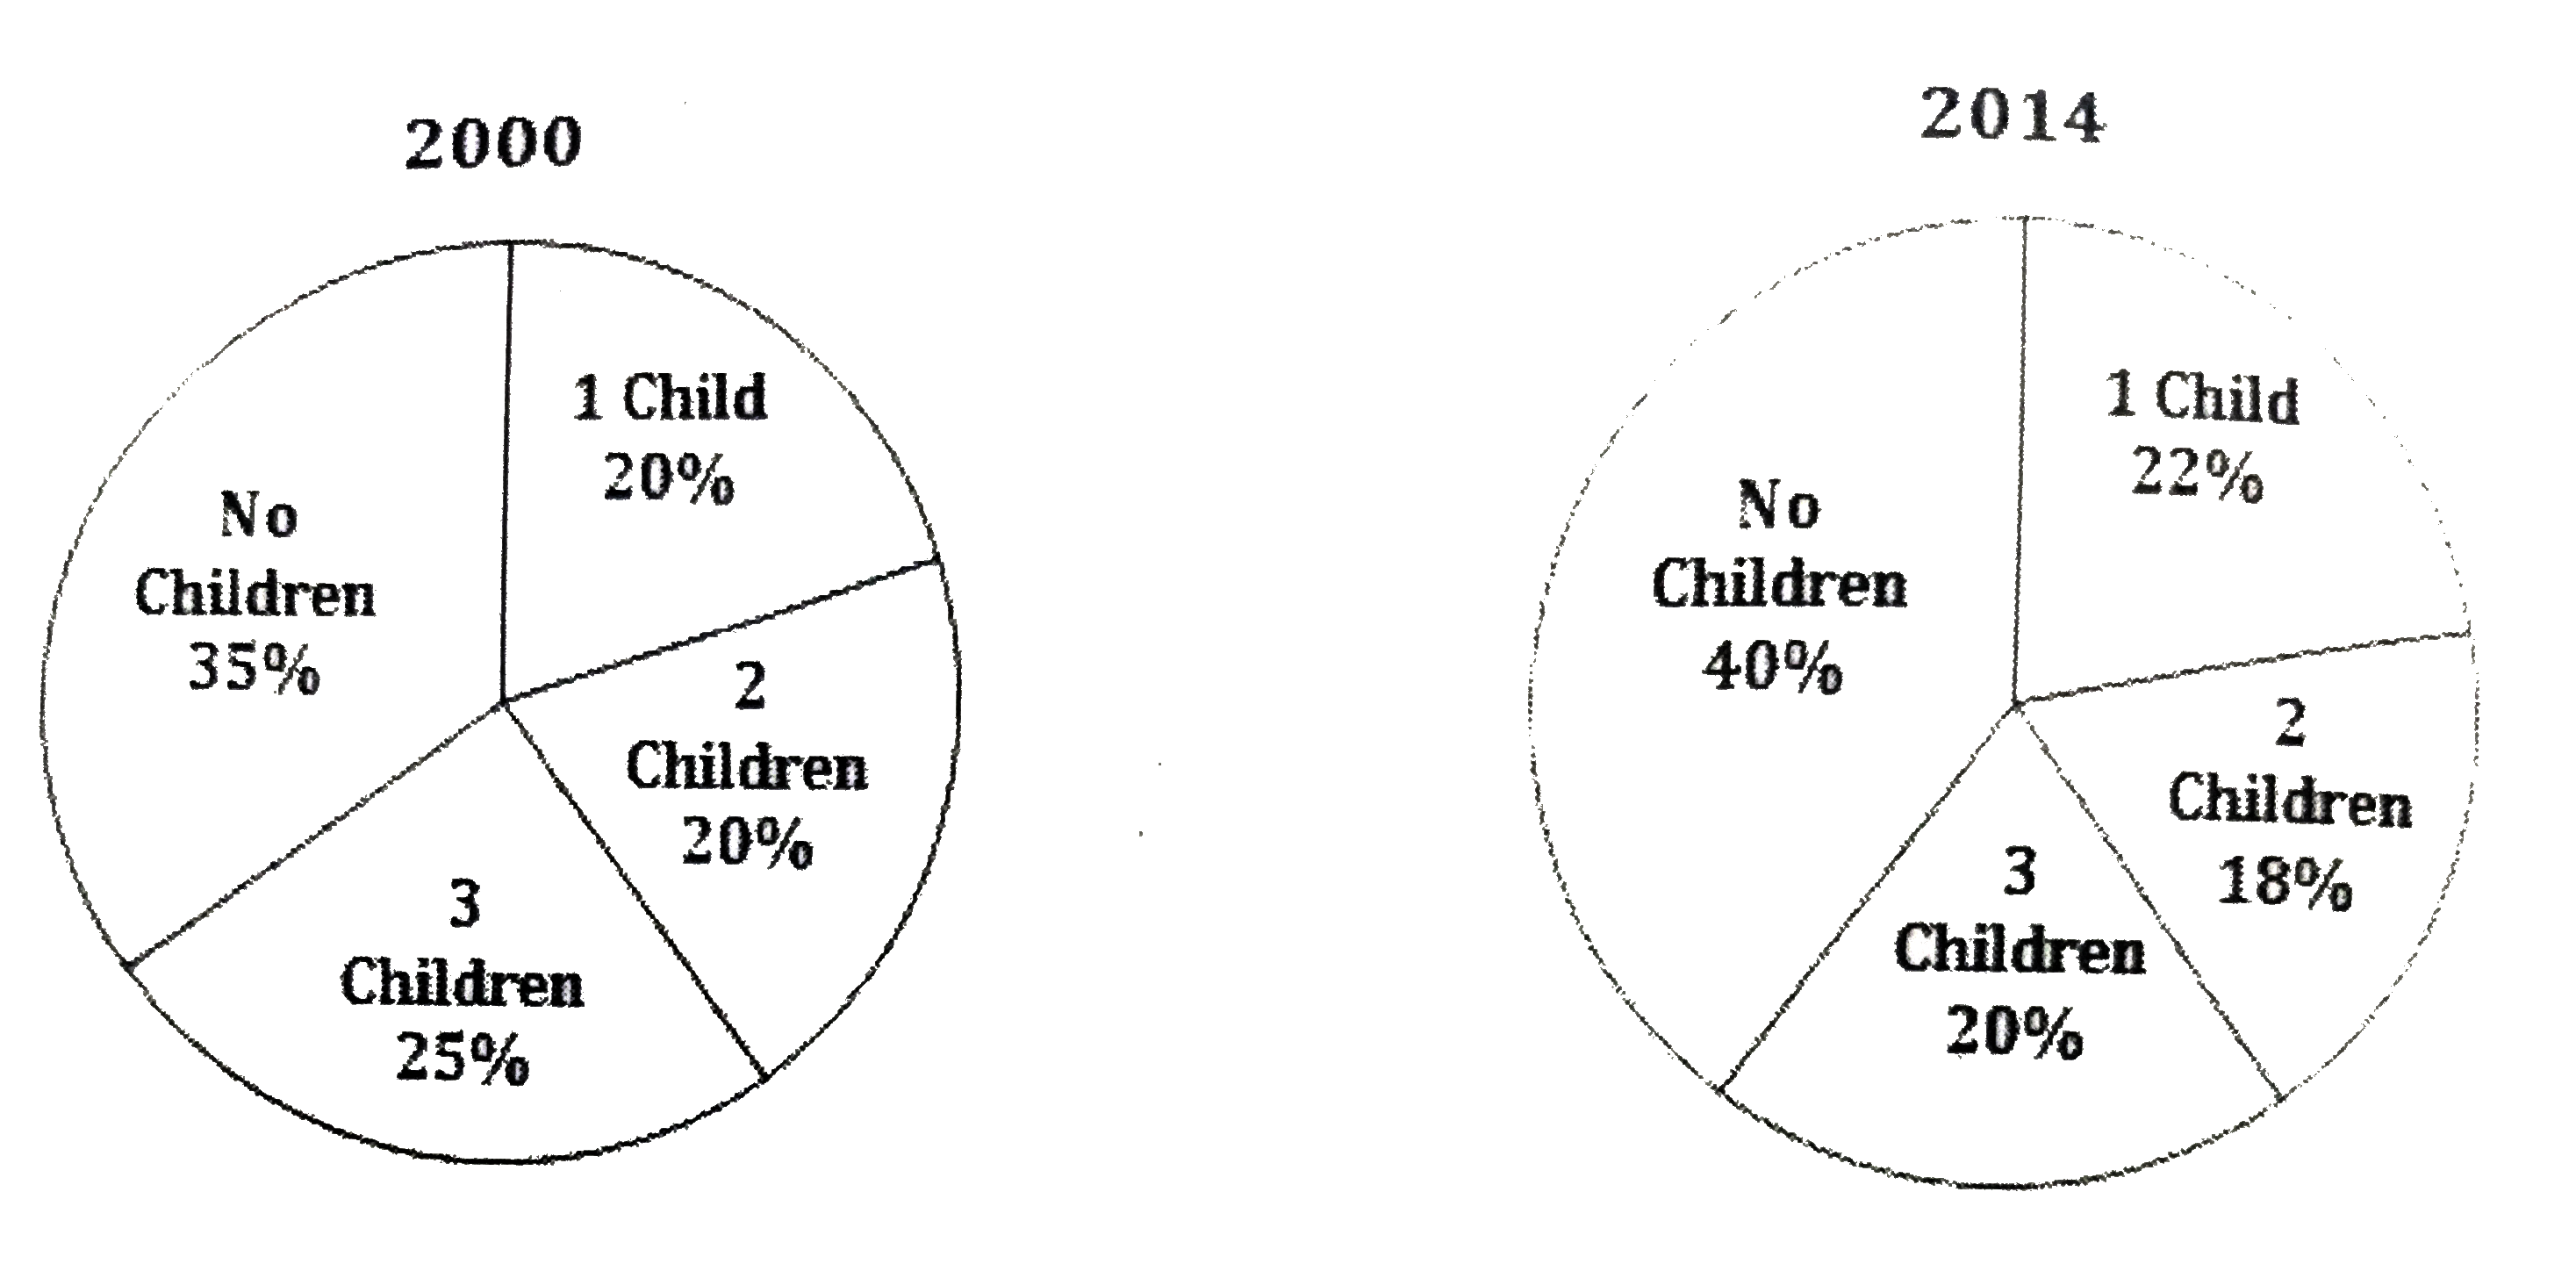
What was the approximate average annual percent increase in the number of households form 2000 to 2014 ?A1.5%B1.4%C1.2%D1.1%
The given bar chart shows the sales of books from six branches of a publishing company during two consecutive years 2000 and 2001.
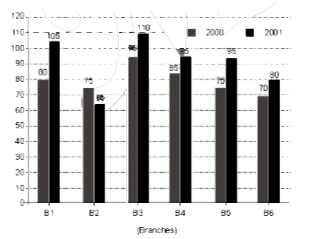
In the given bar chart, the ratio of total sales of all branches for the year 2000 to 2001 is:
View SolutionCalculate the cost of living indext for the year 2008 taking 2000 as the base year from the following information.

View SolutionThe following table gives the frequency distribution of number of peas per pea pod of 198 pods :

What is the median of this distribution ?
View SolutionThe bar chart given below shows the number of cars sold by brand A and B for the year for 2008 to 2016
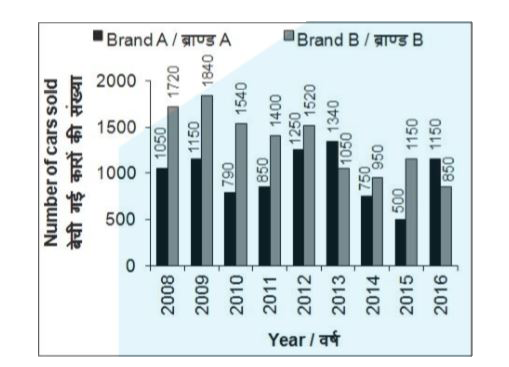
What is the percentage decrease in the number of car sold in year 2015 from year 2014 for brand A?
View Solution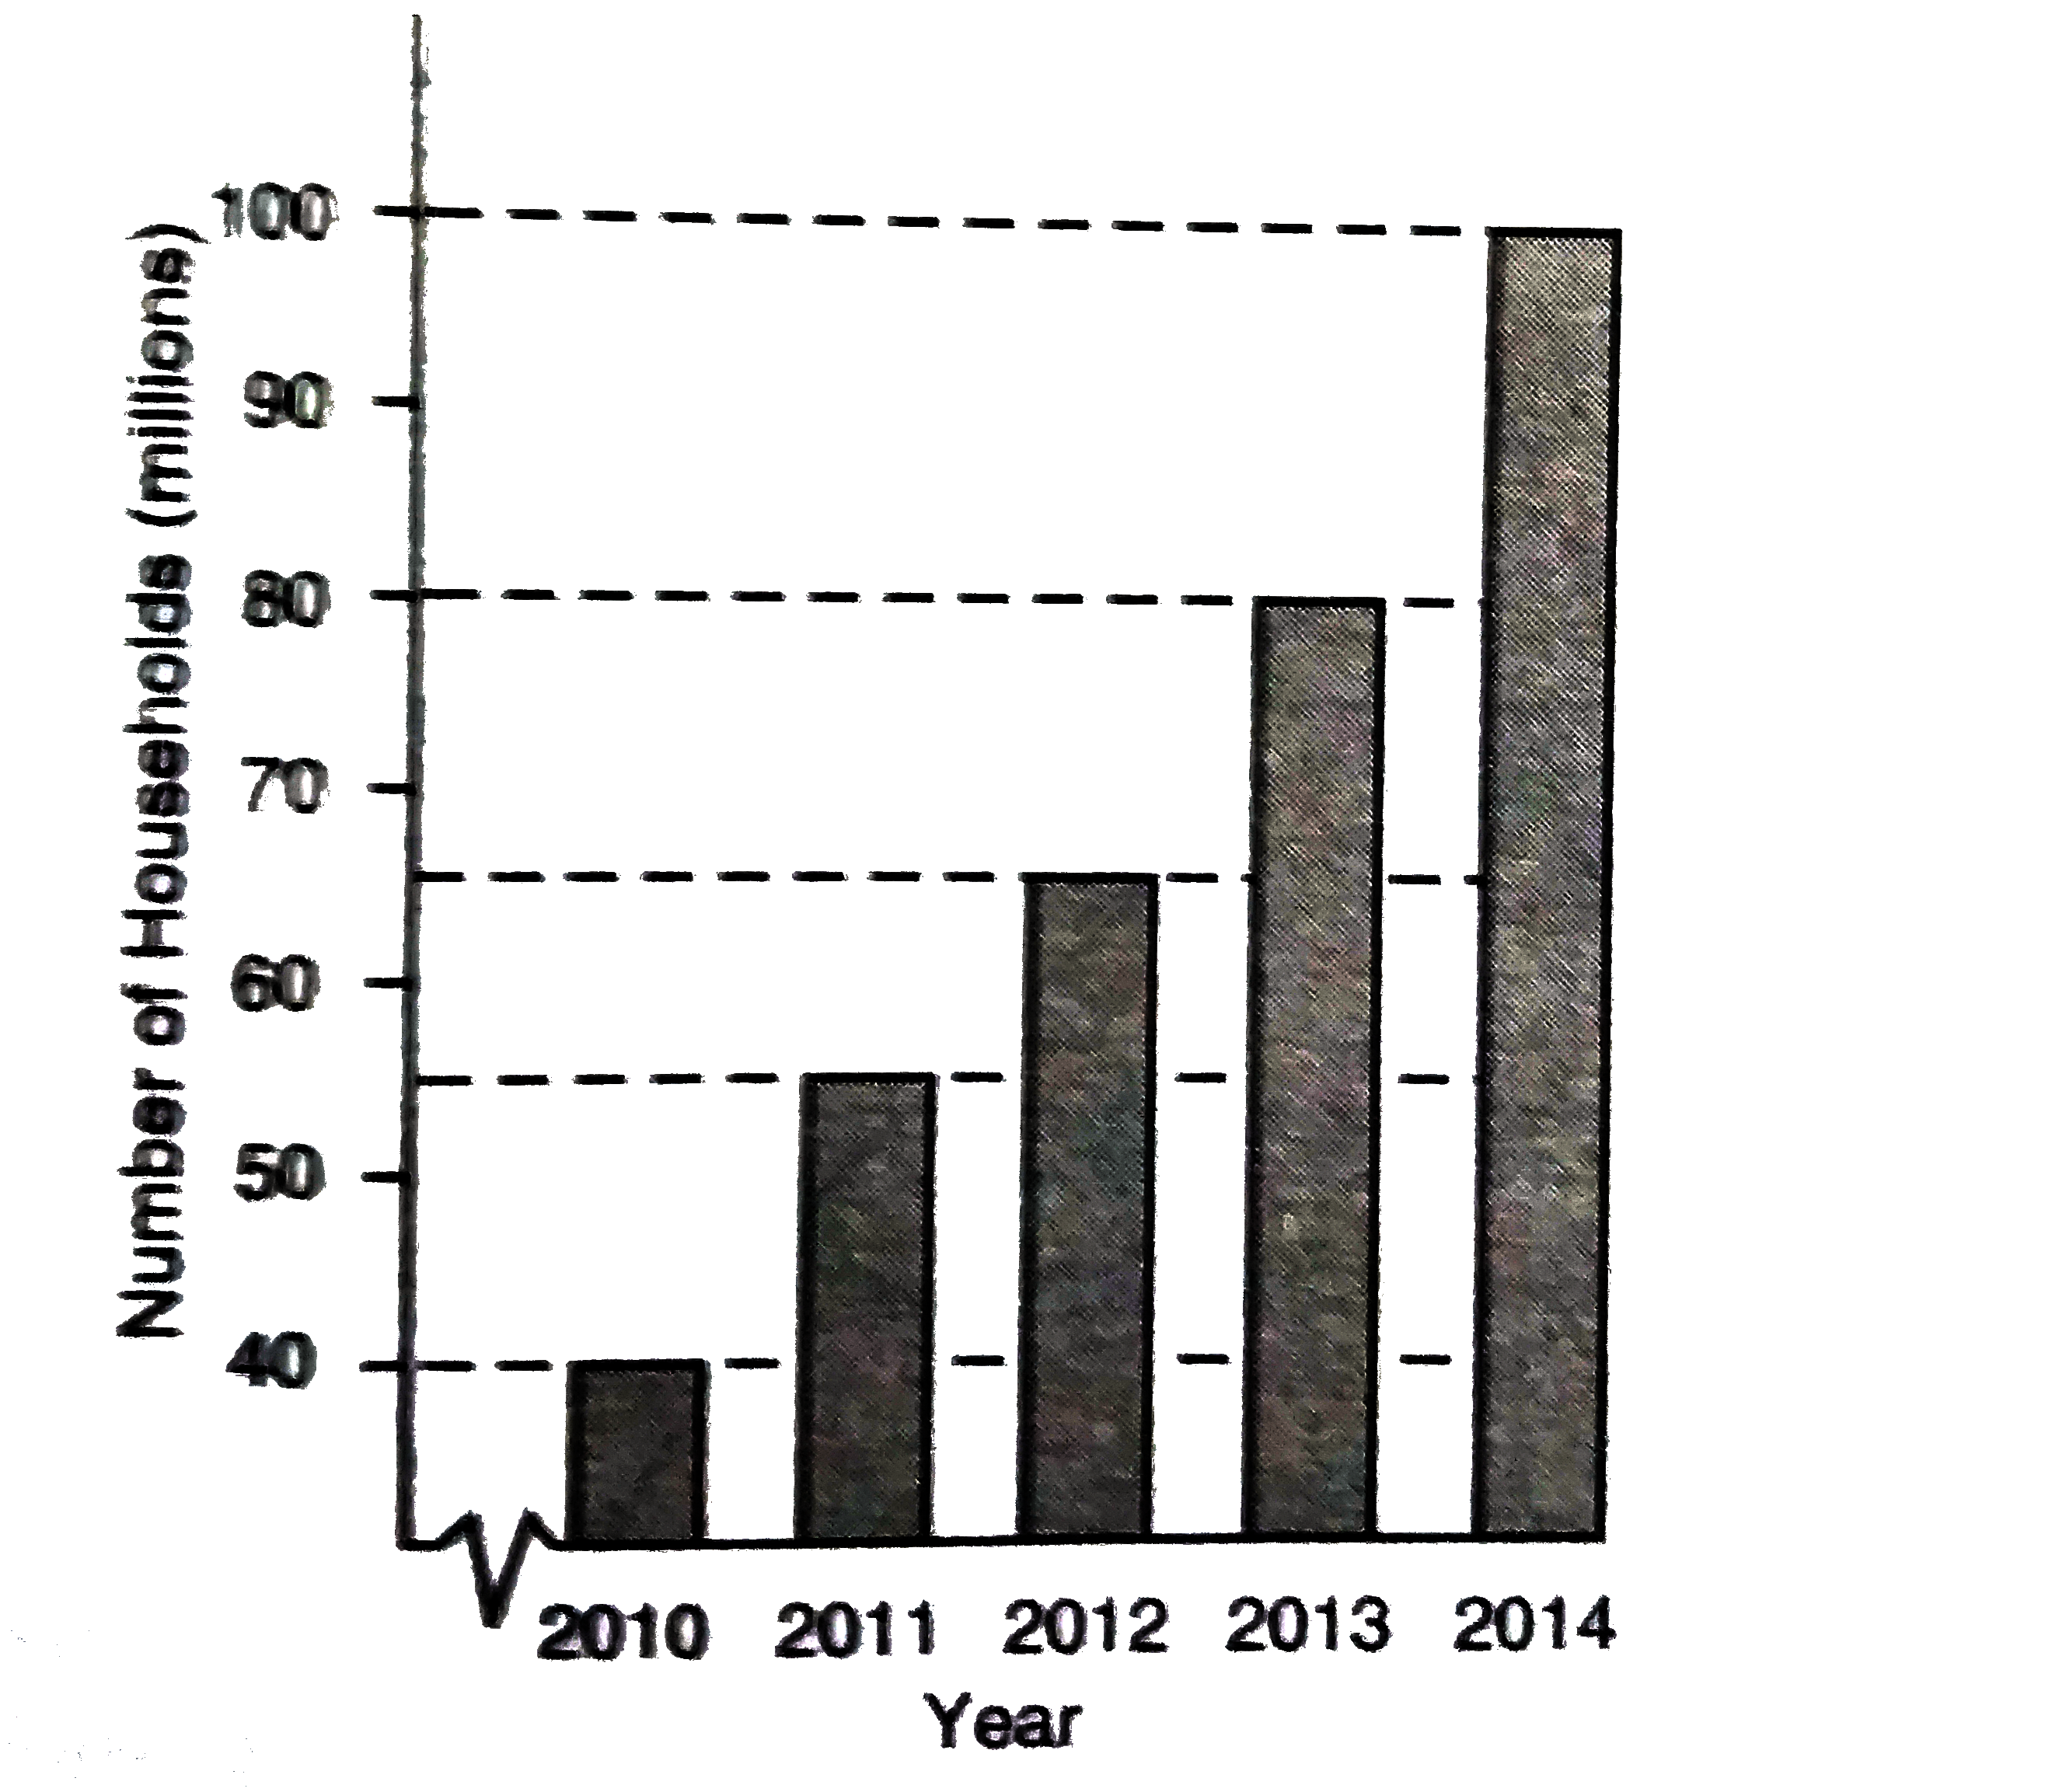
The graph above shows the number of U.S. households with laptop computers for the years 2010 to 2014.
Q. What was the percent of increase in the number of households with laptops from 2010 to 2014?
View Solution
