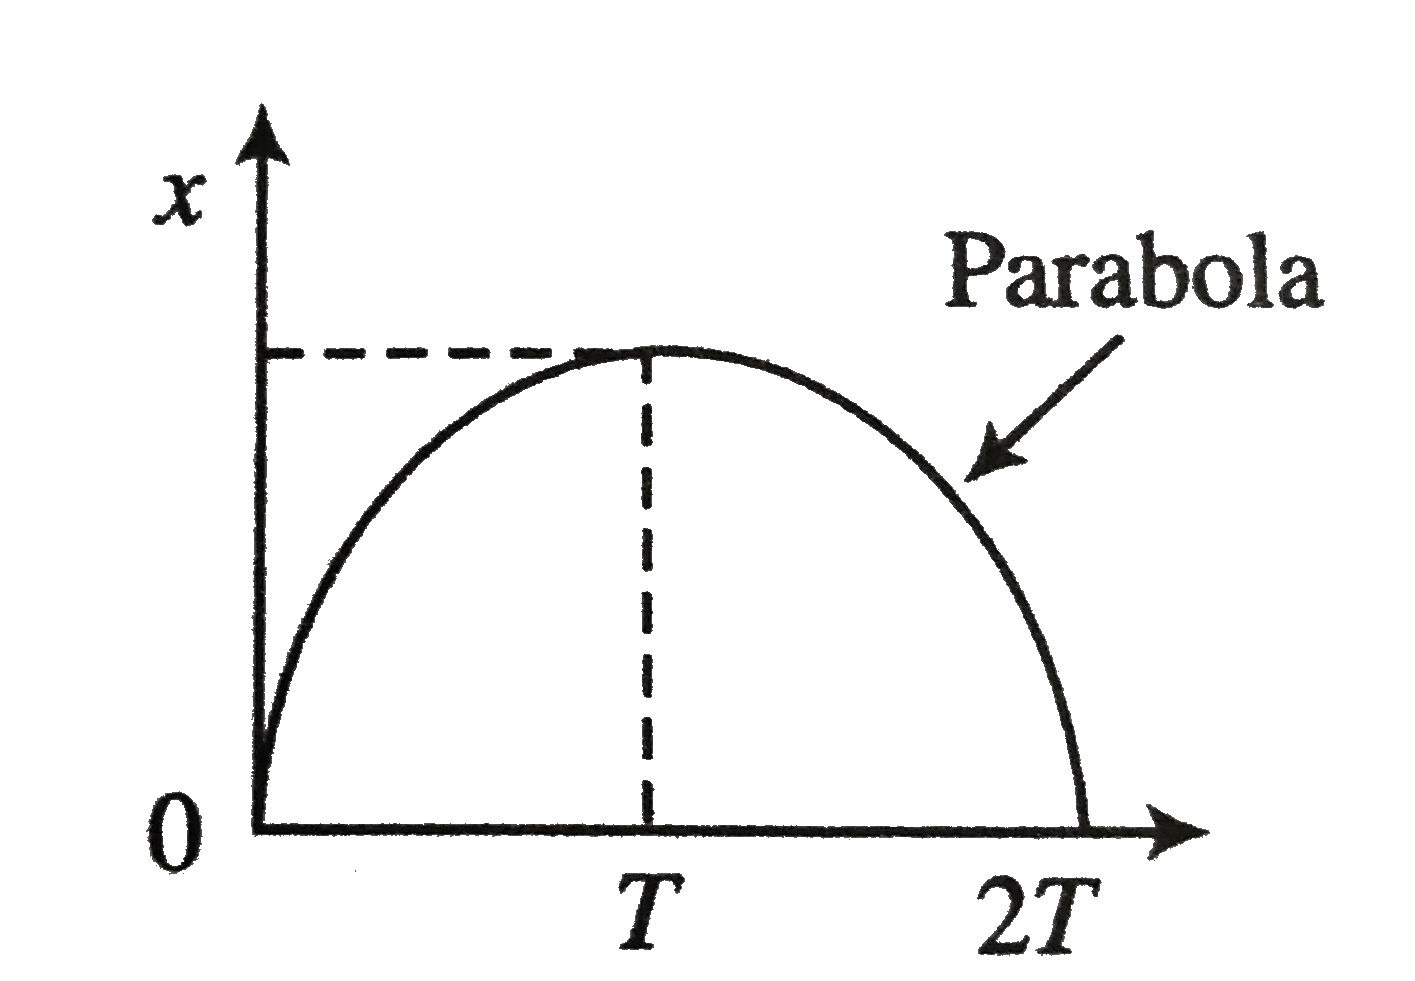
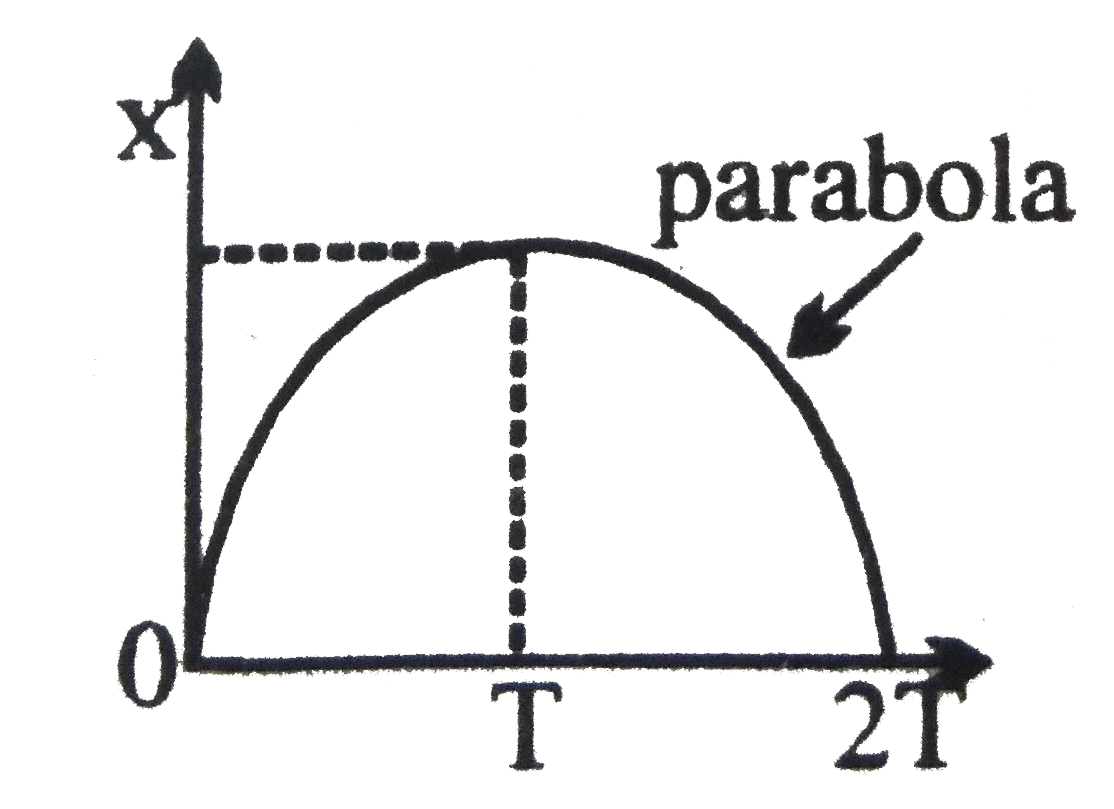
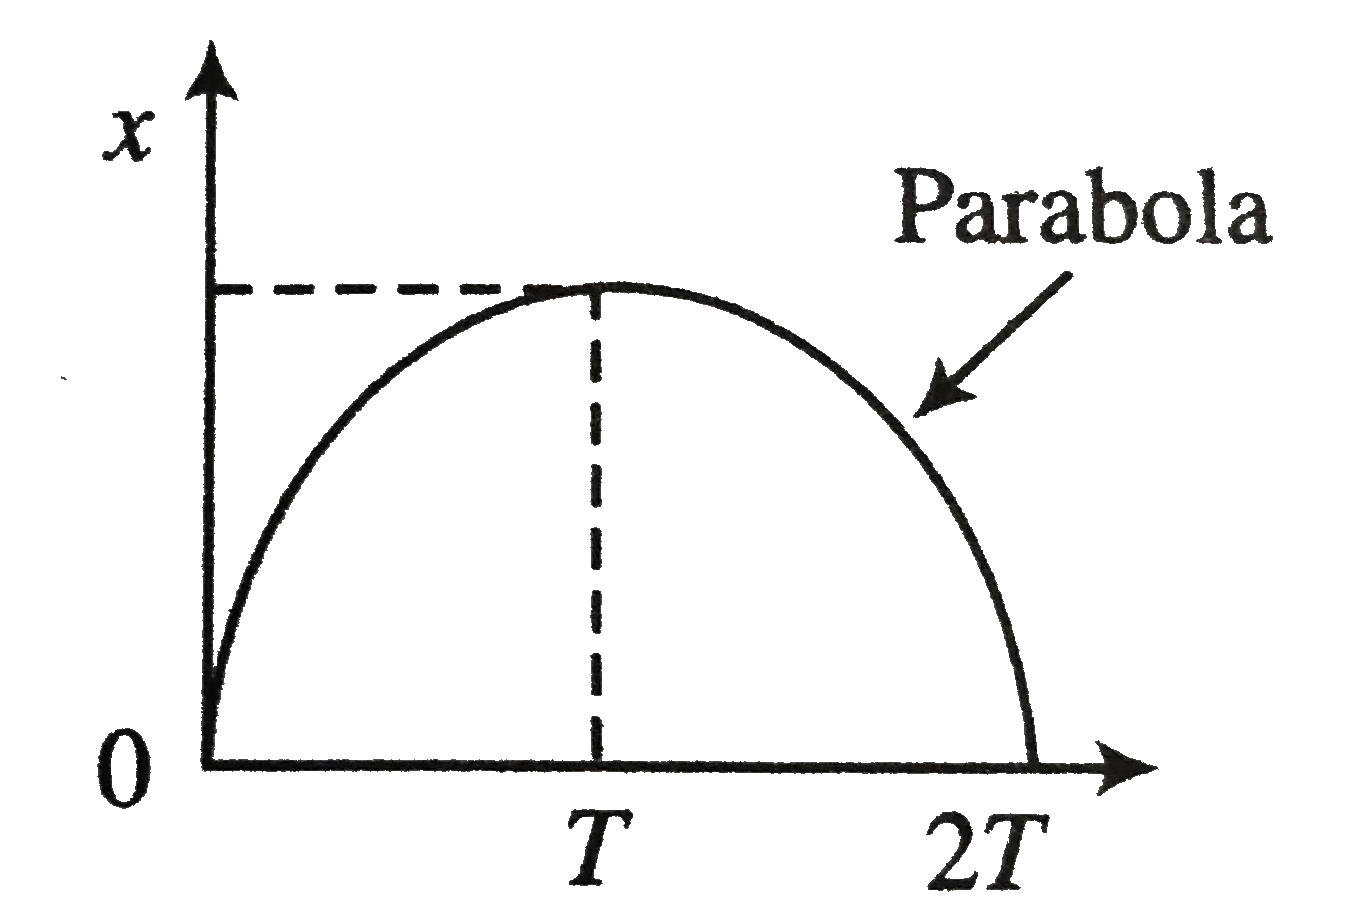
The x-t graph of a particle moving along a straight line is shown in figure

The v-t graph of the particle is correctly shown by
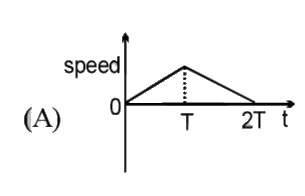
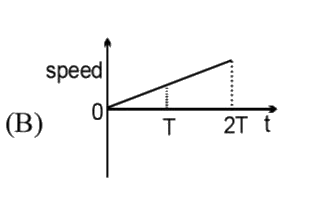
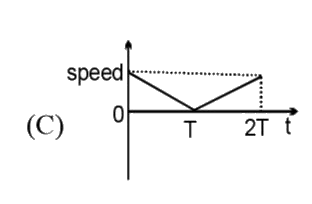
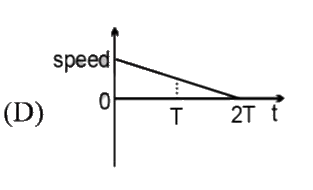
The correct Answer is:C
Step by step video, text & image solution for The x-t graph of a particle moving along a straight line is shown in figure The v-t graph of the particle is correctly shown by by Physics experts to help you in doubts & scoring excellent marks in Class 12 exams.
Topper's Solved these Questions
- BOOK - MOTIONCHAPTER - KINEMATICSEXERCISE - EXERCISE 2 OBJECTIVE PROBLEMS (Level-2)26videos
KINEMATICS
- BOOK - MOTIONCHAPTER - KINEMATICSEXERCISE - EXERCISE 3 SUBJECTIVE PROBLEMS (Level-1)20videos
KINEMATICS
- BOOK - MOTIONCHAPTER - KINEMATICSEXERCISE - EXERCISE 1 OBJECTIVE PROBLEMS103videos
KINEMATICS
- BOOK - MOTIONCHAPTER - HYDROSTATIC, FLUID MECHANICS & VISCOSITYEXERCISE - EXERCISE -3 (SECTION-B) PREVIOUS YEAR PROBLEM7videos
HYDROSTATIC, FLUID MECHANICS & VISCOSITY
- BOOK - MOTIONCHAPTER - KINETIC THEORY OF GASES EXERCISE - EXERCISE-3 SECTION-B16videos
KINETIC THEORY OF GASES
Similar Questions
Knowledge Check
- Question 1 - Select One
The x-t graph of a particle moving along a straight line is shown in figure
The a-t graph of the particle is correctly shown byA B
B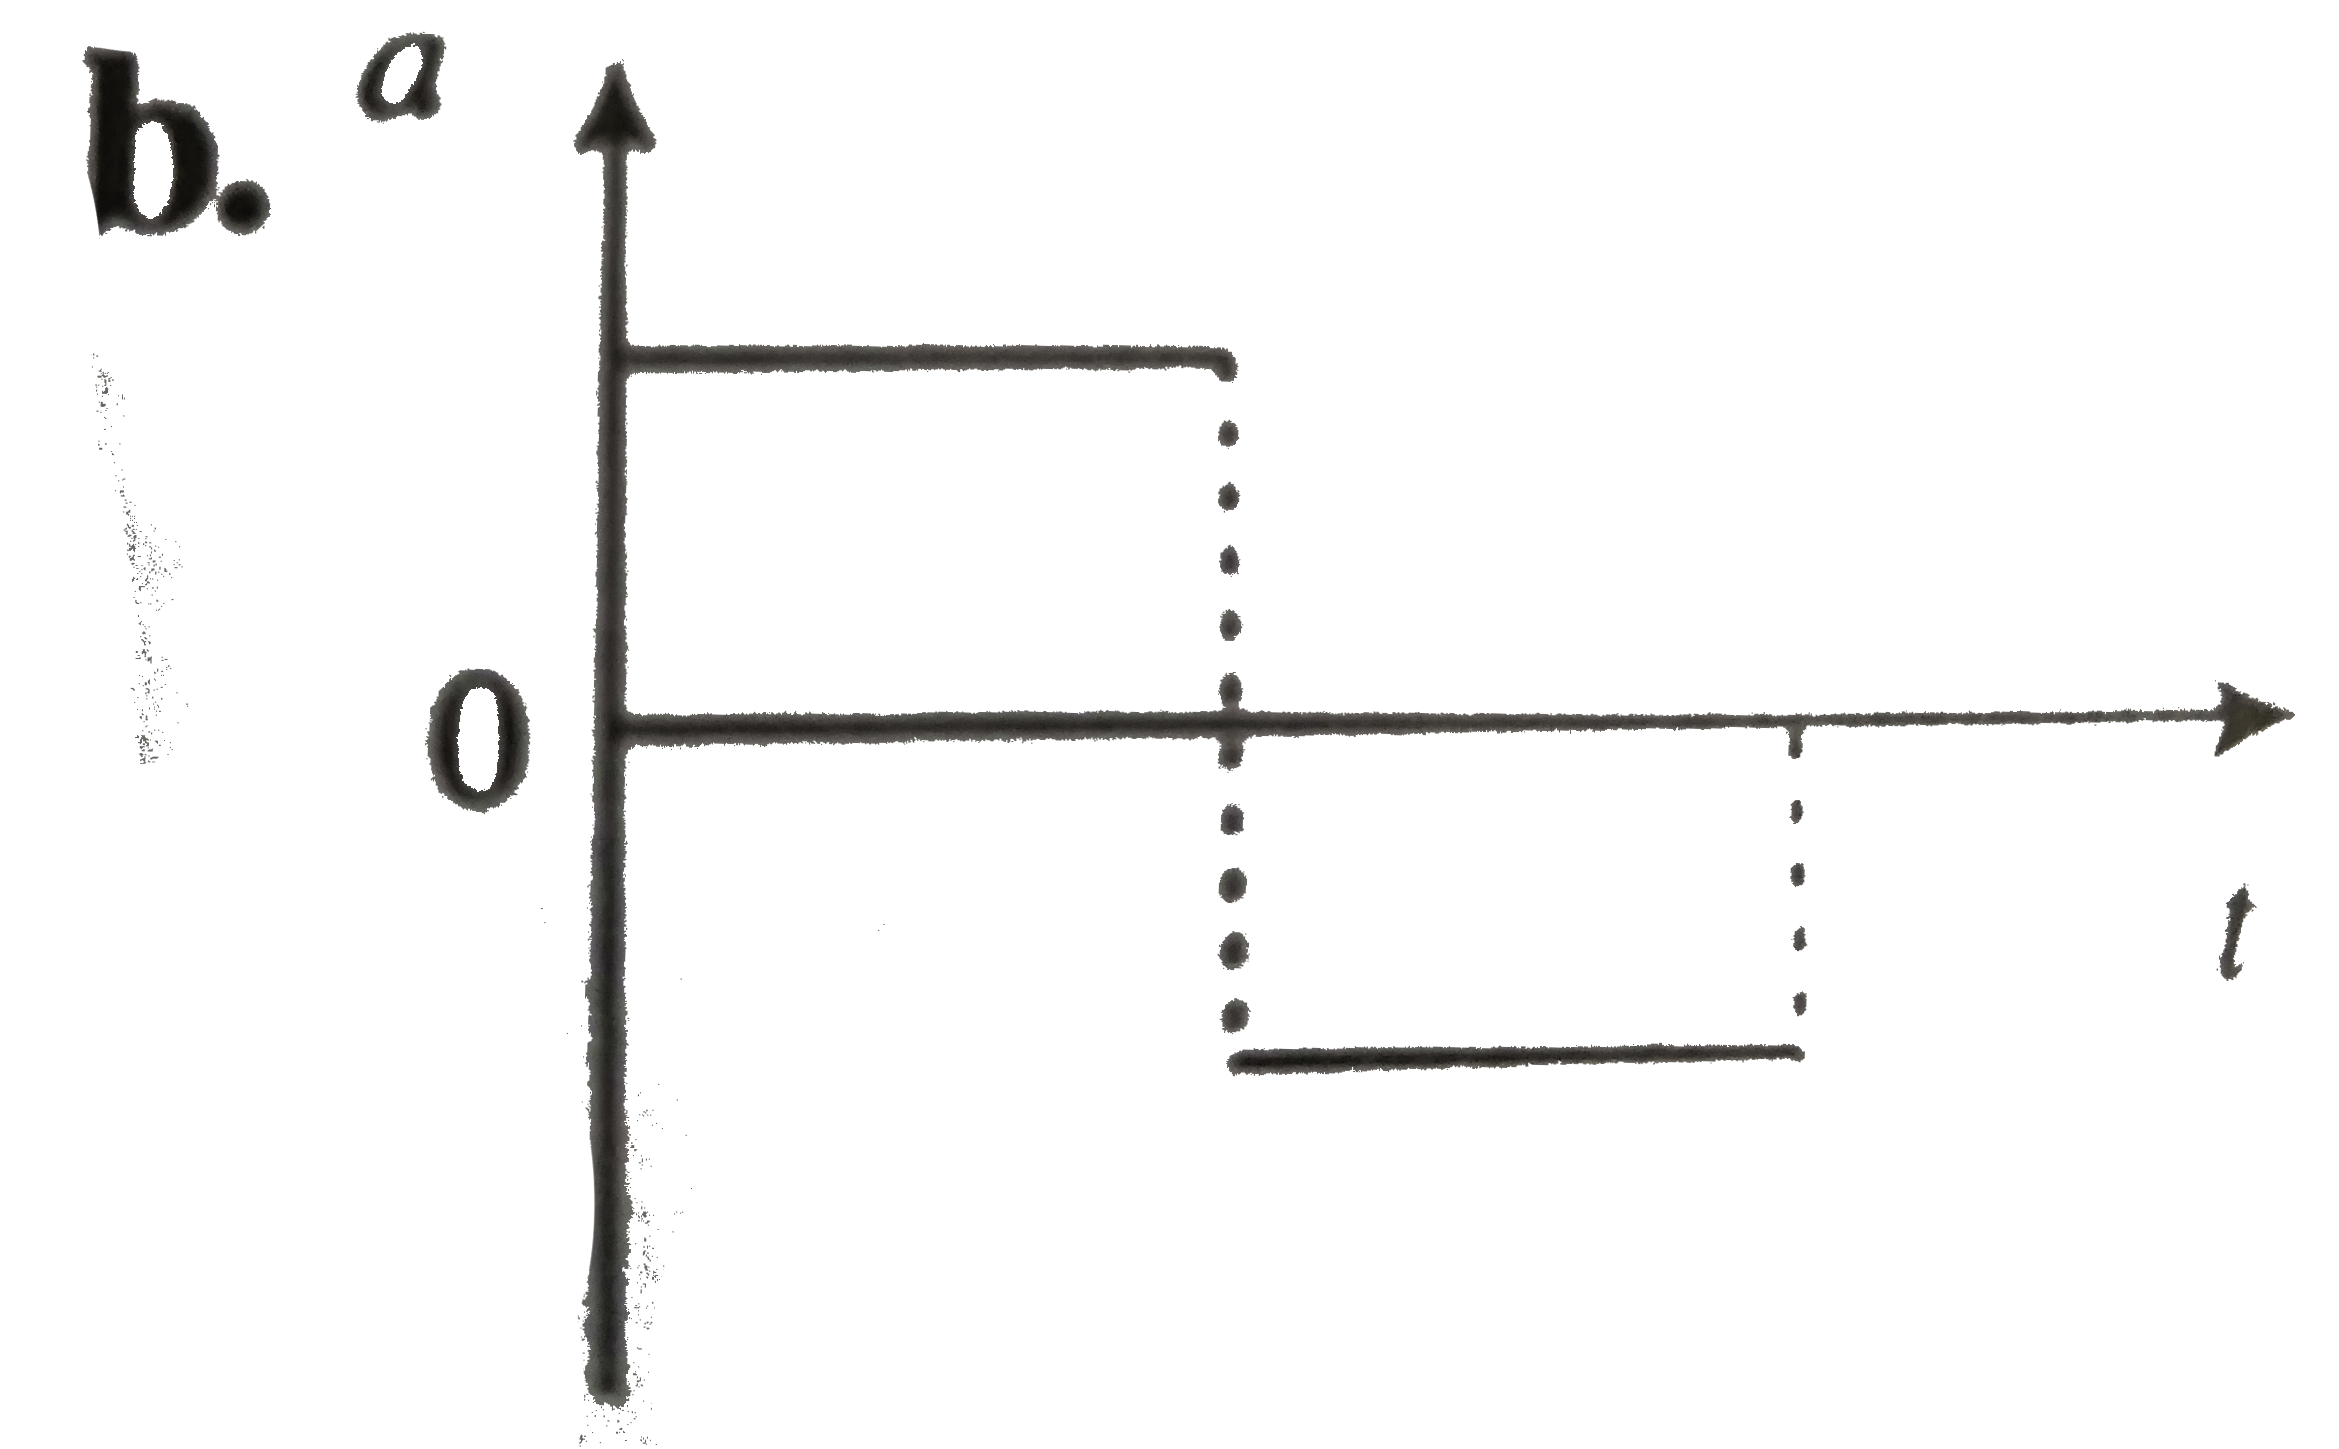 C
C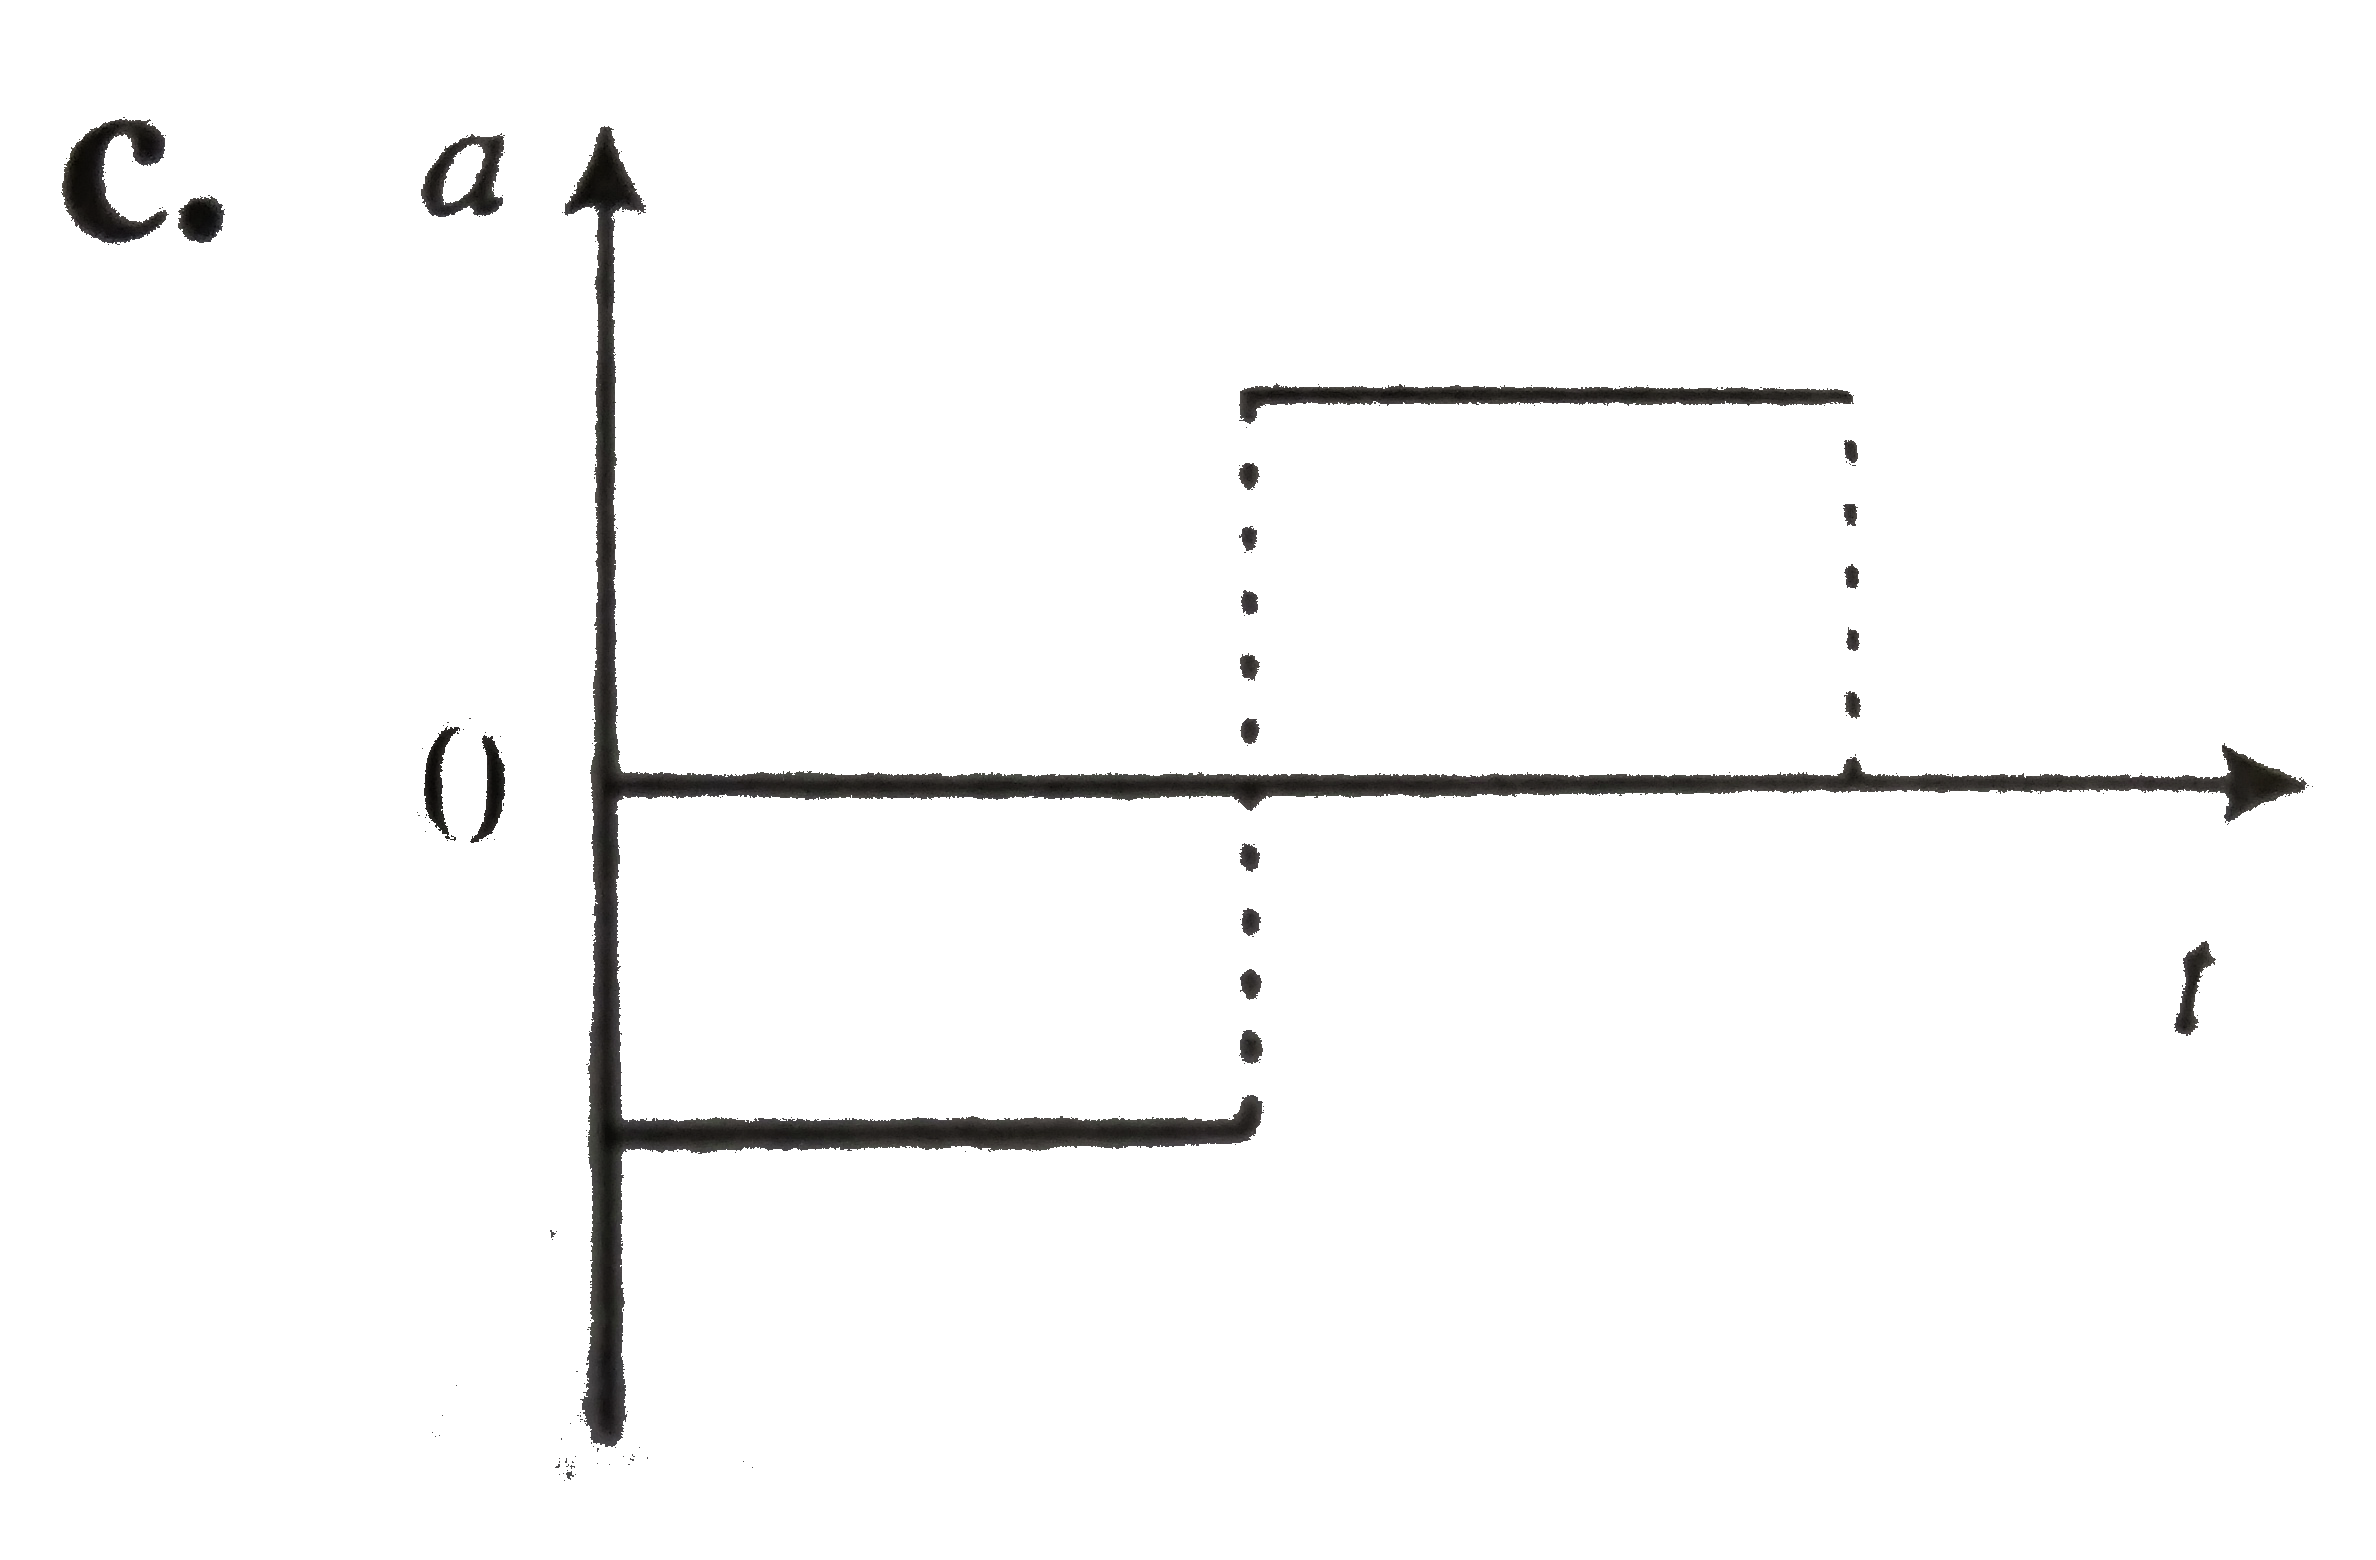 D
D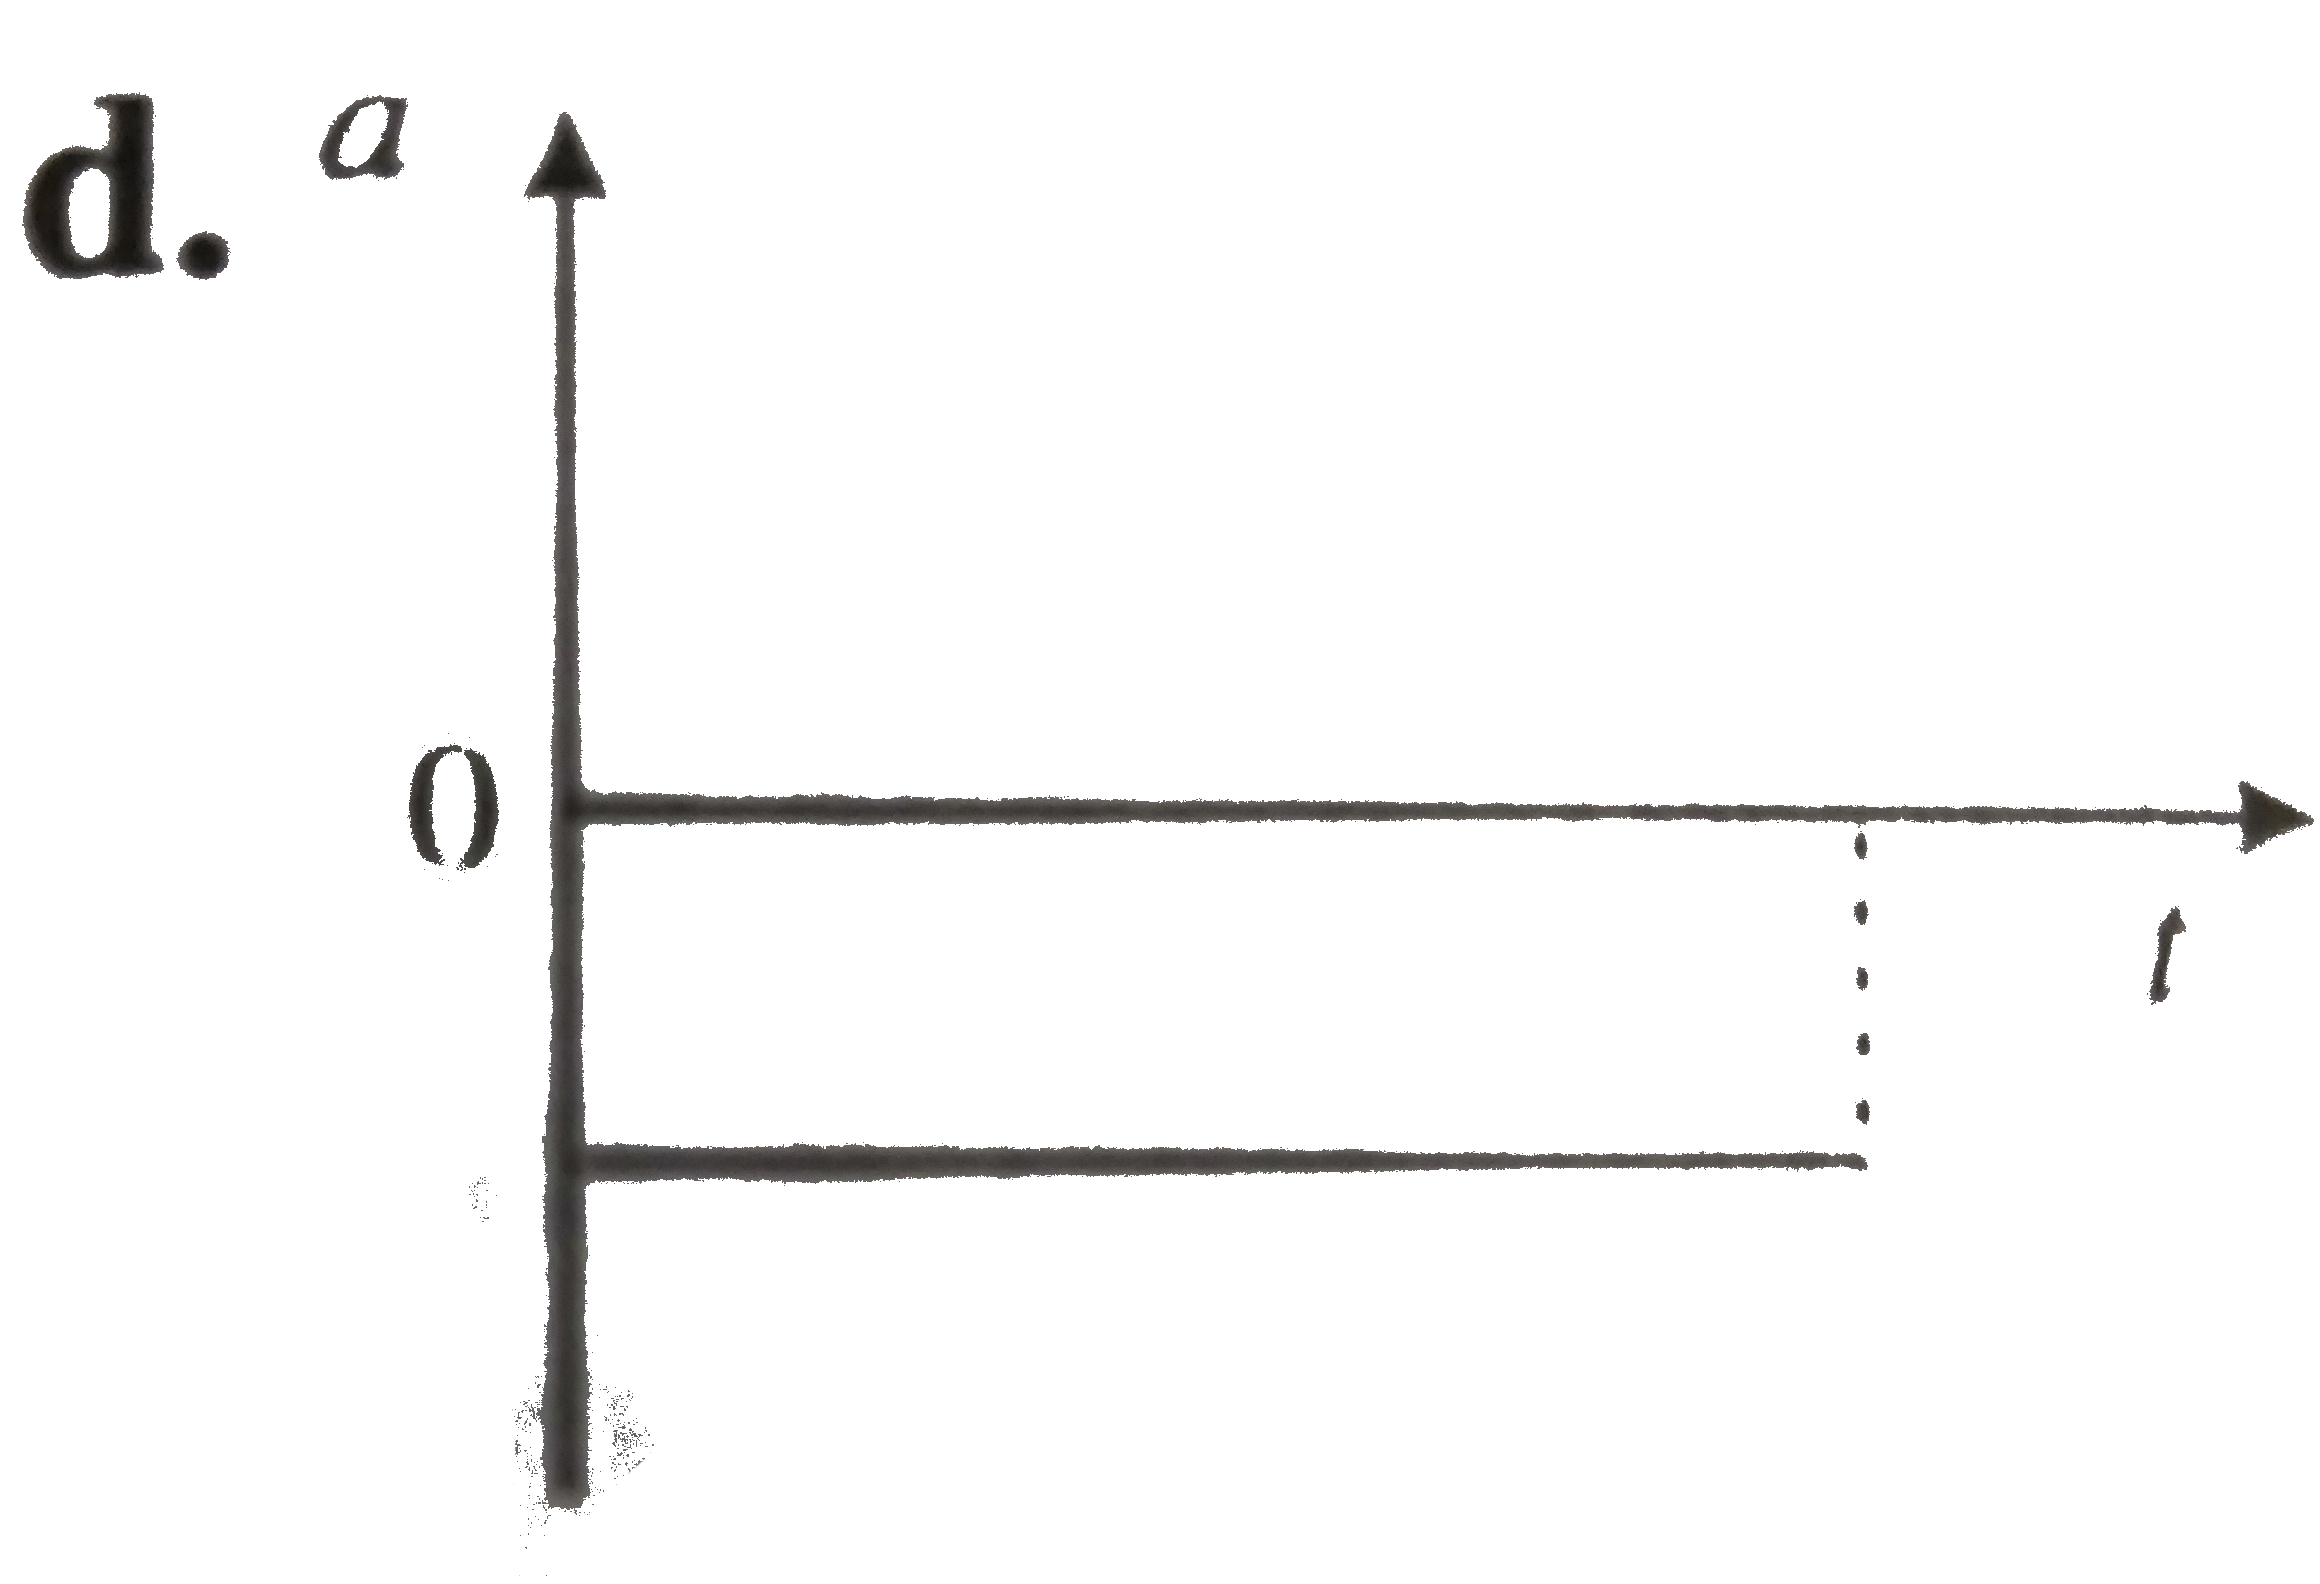
- Question 2 - Select One
The x−t graph of particle moving along a straight line is shown in figure
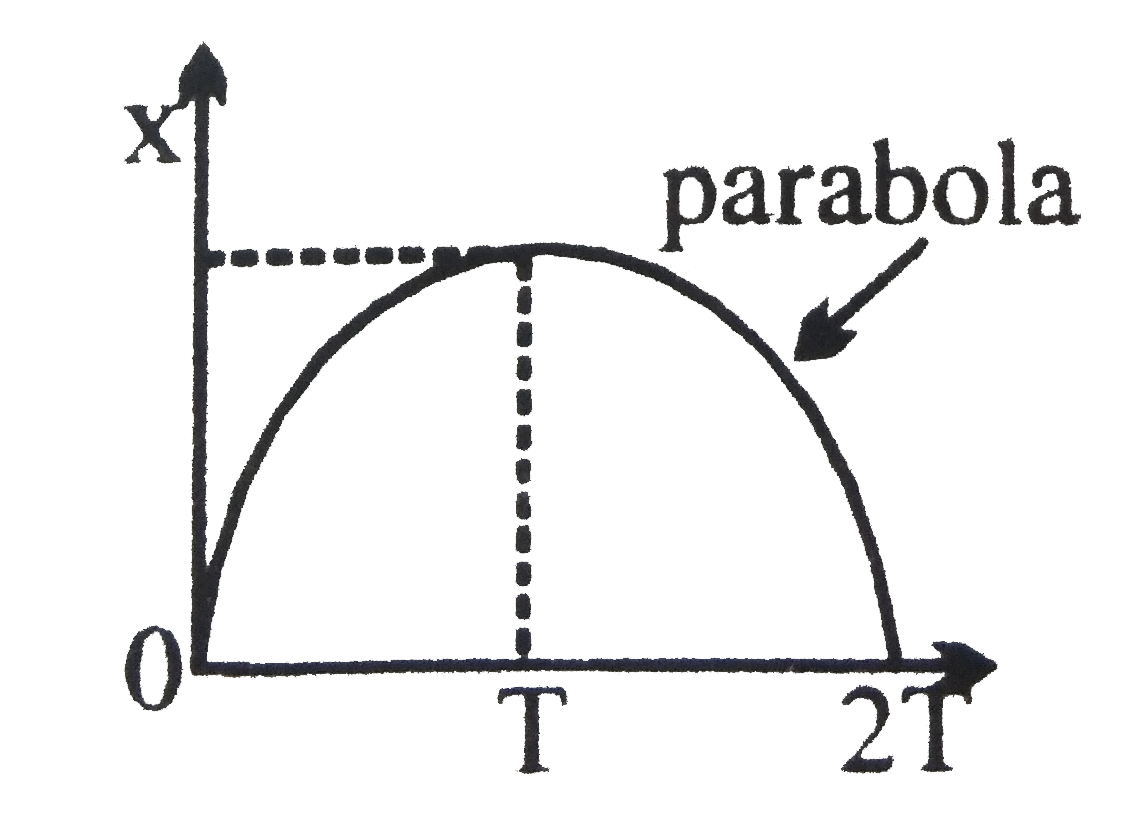
The v−t graph of the particles is correctly shown byA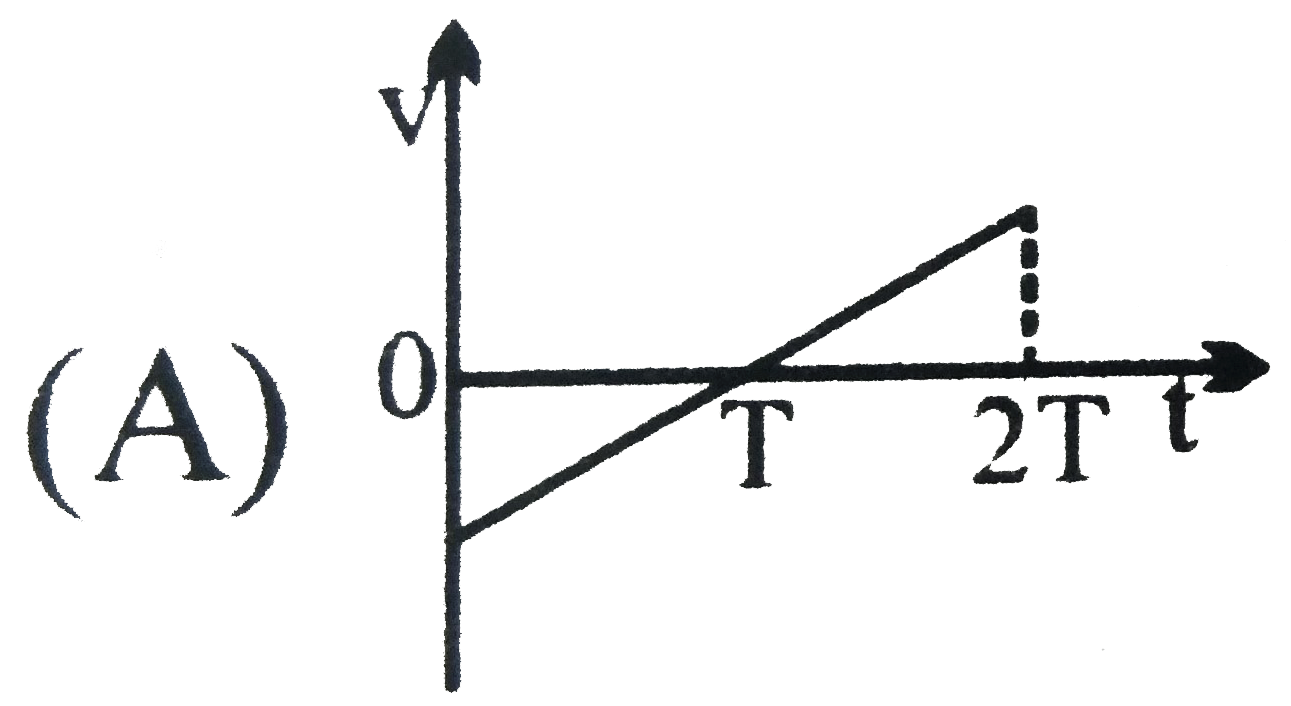 B
B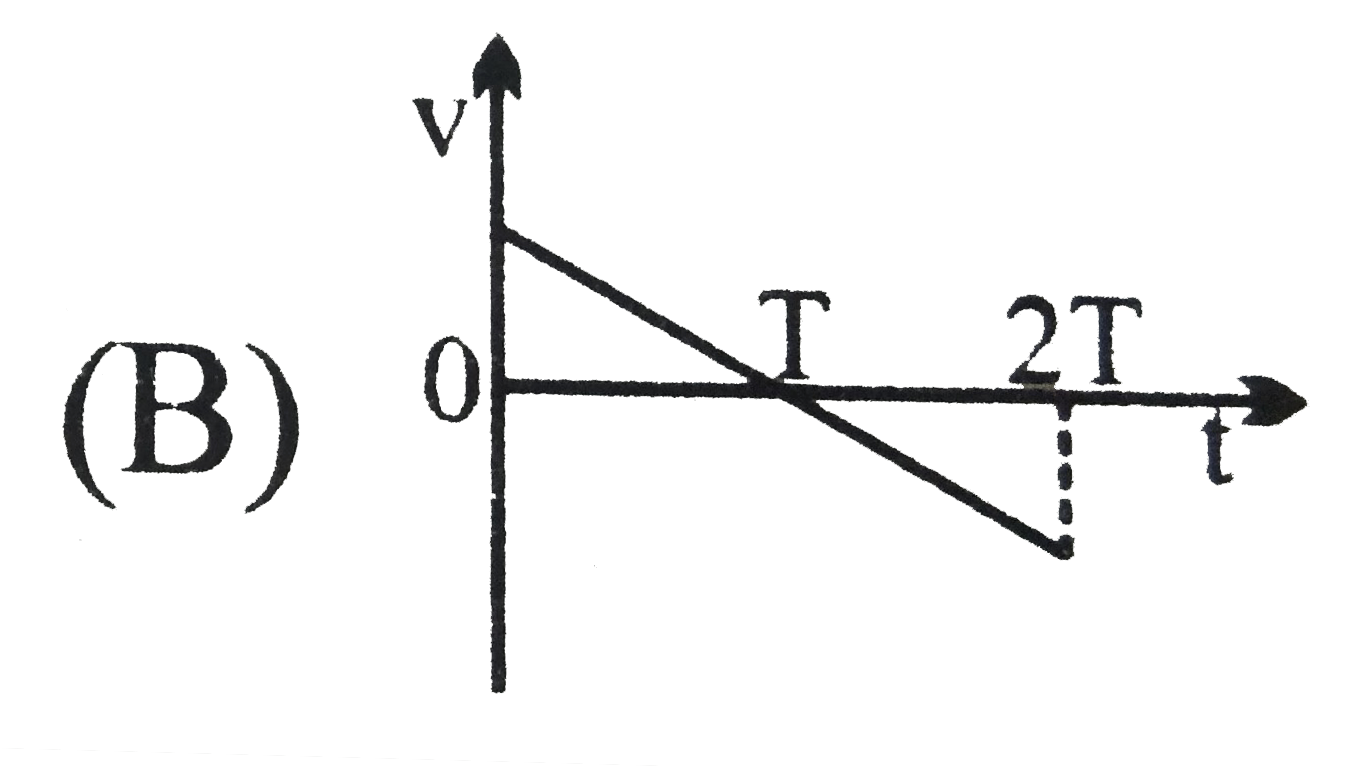 C
C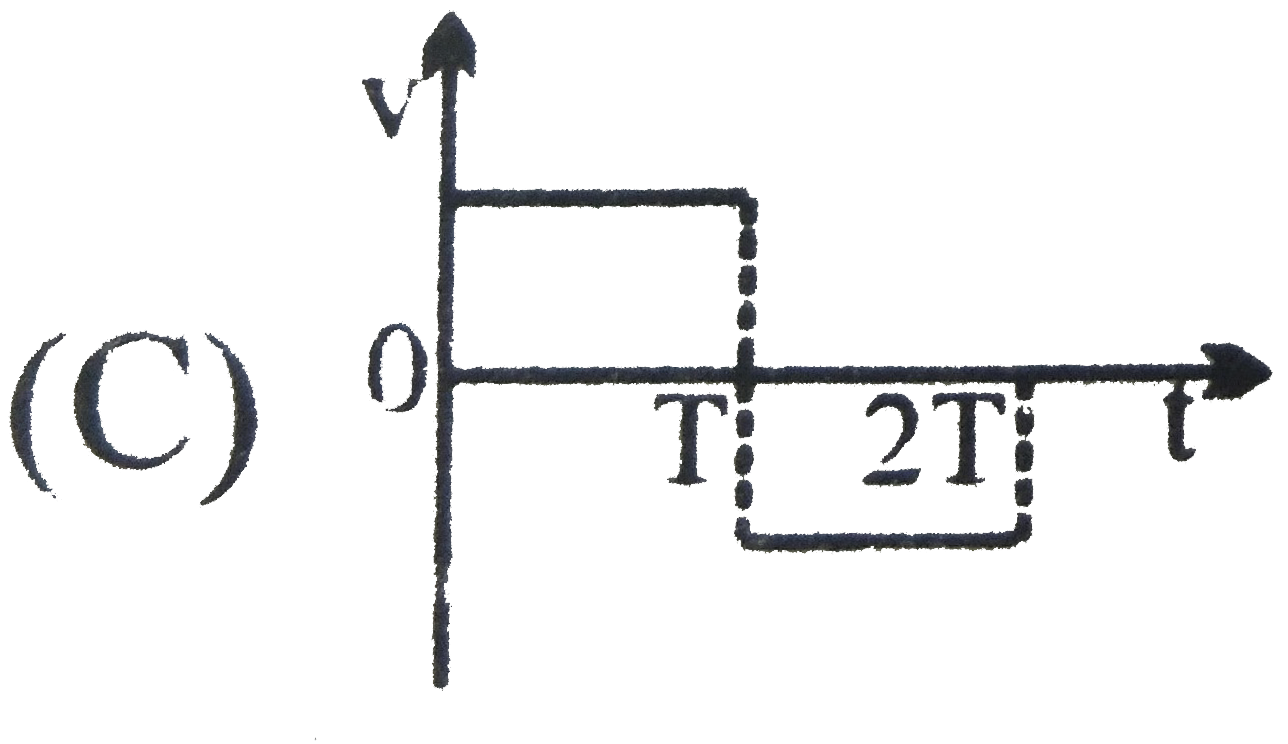 D
D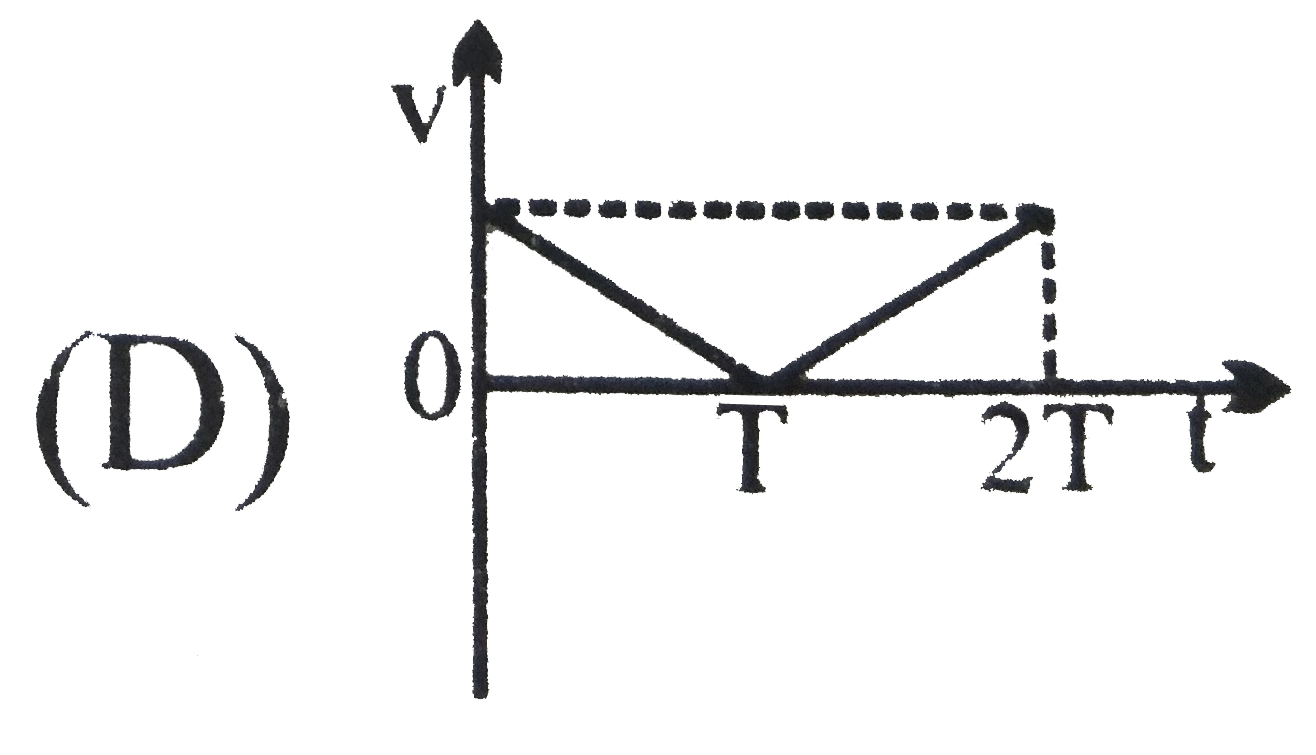
- Question 3 - Select One
The x−t graph of particle moving along a straight line is shown in figure
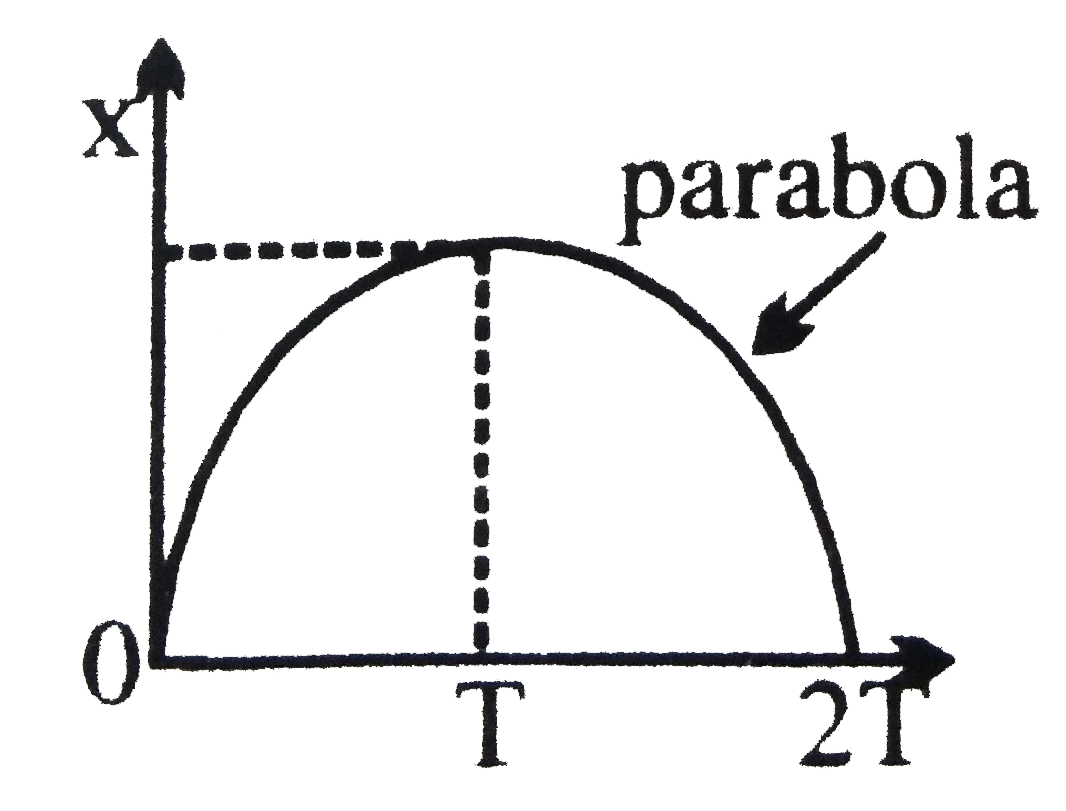
The a−t graph of the particle is correctly shown byA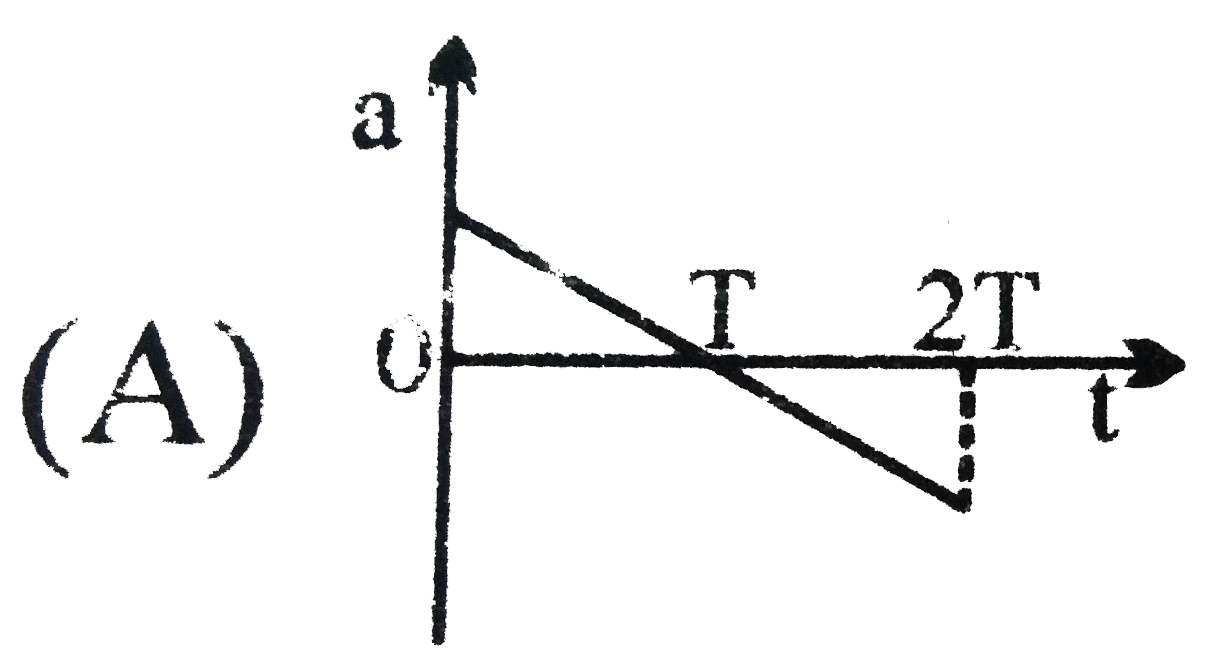 B
B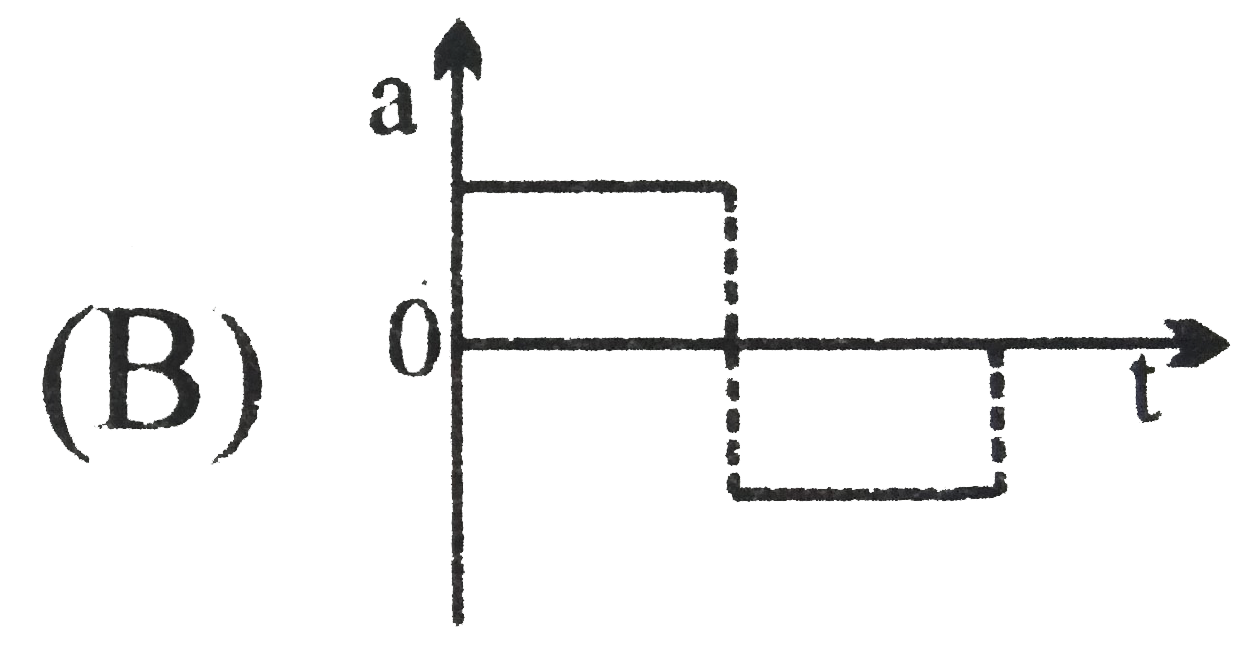 C
C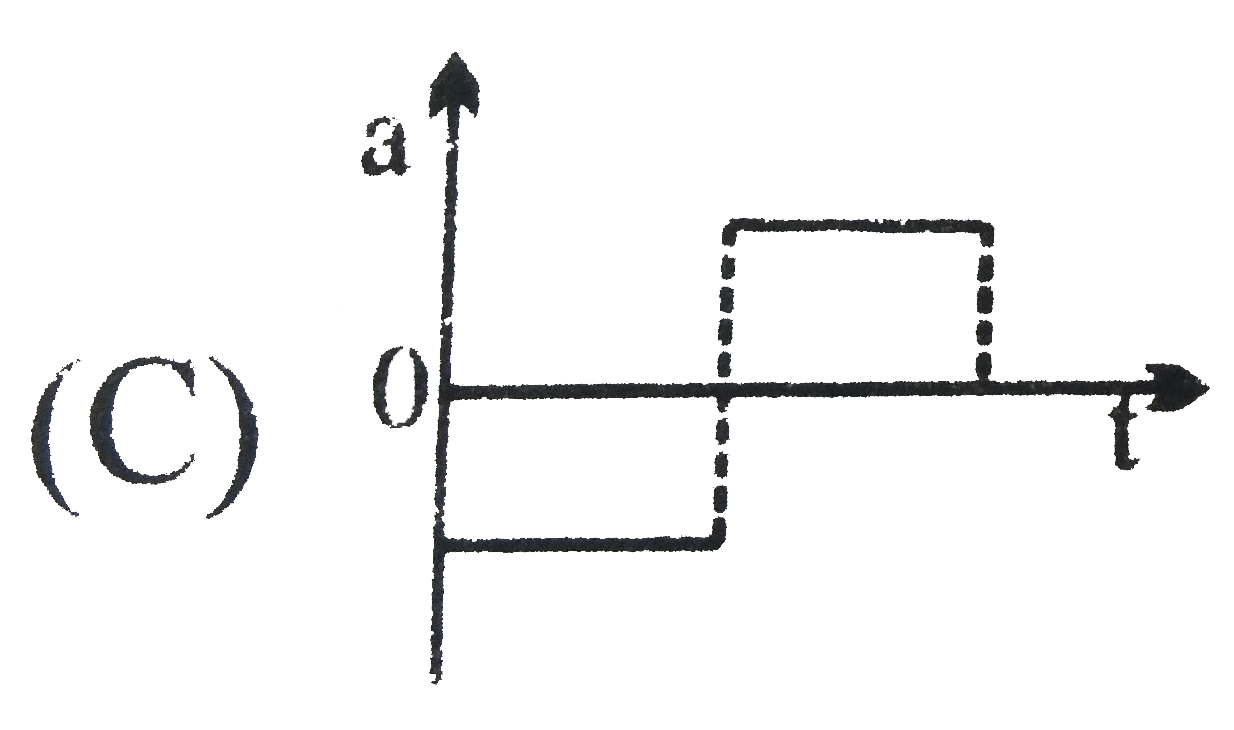 D
D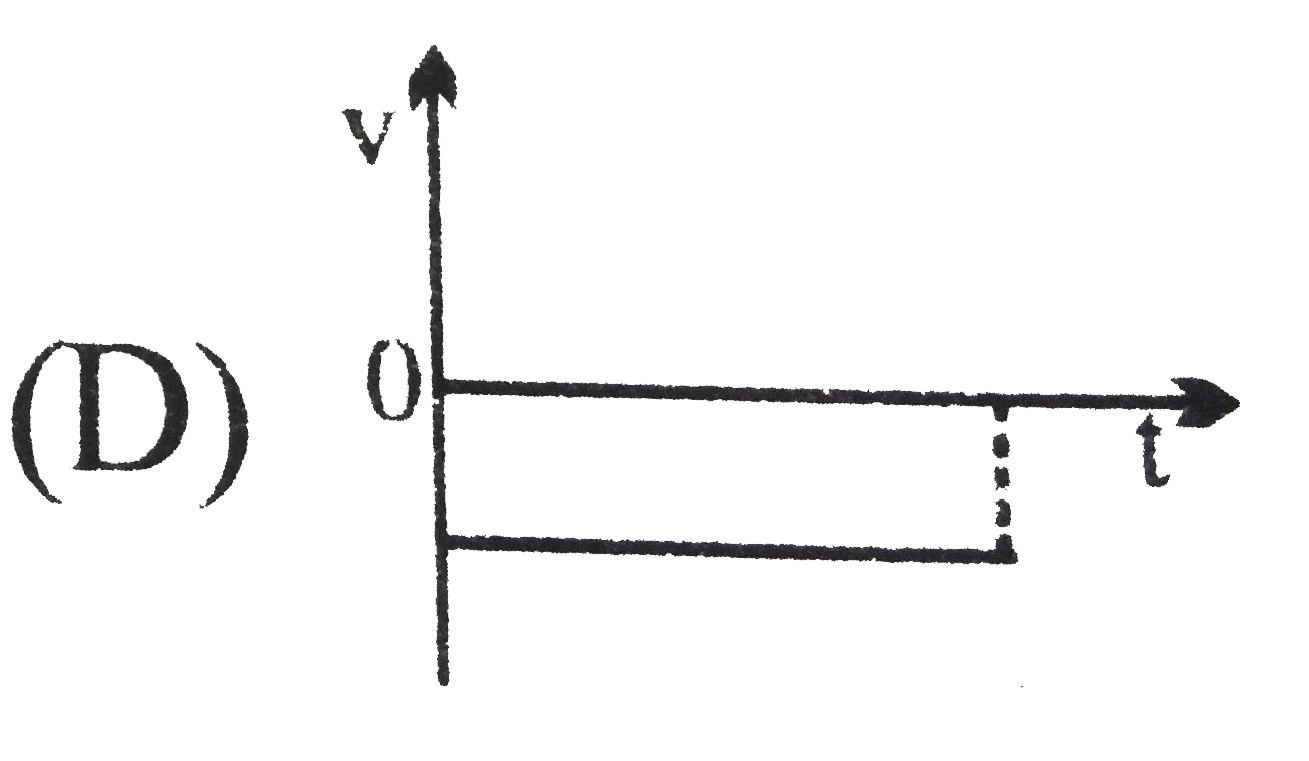
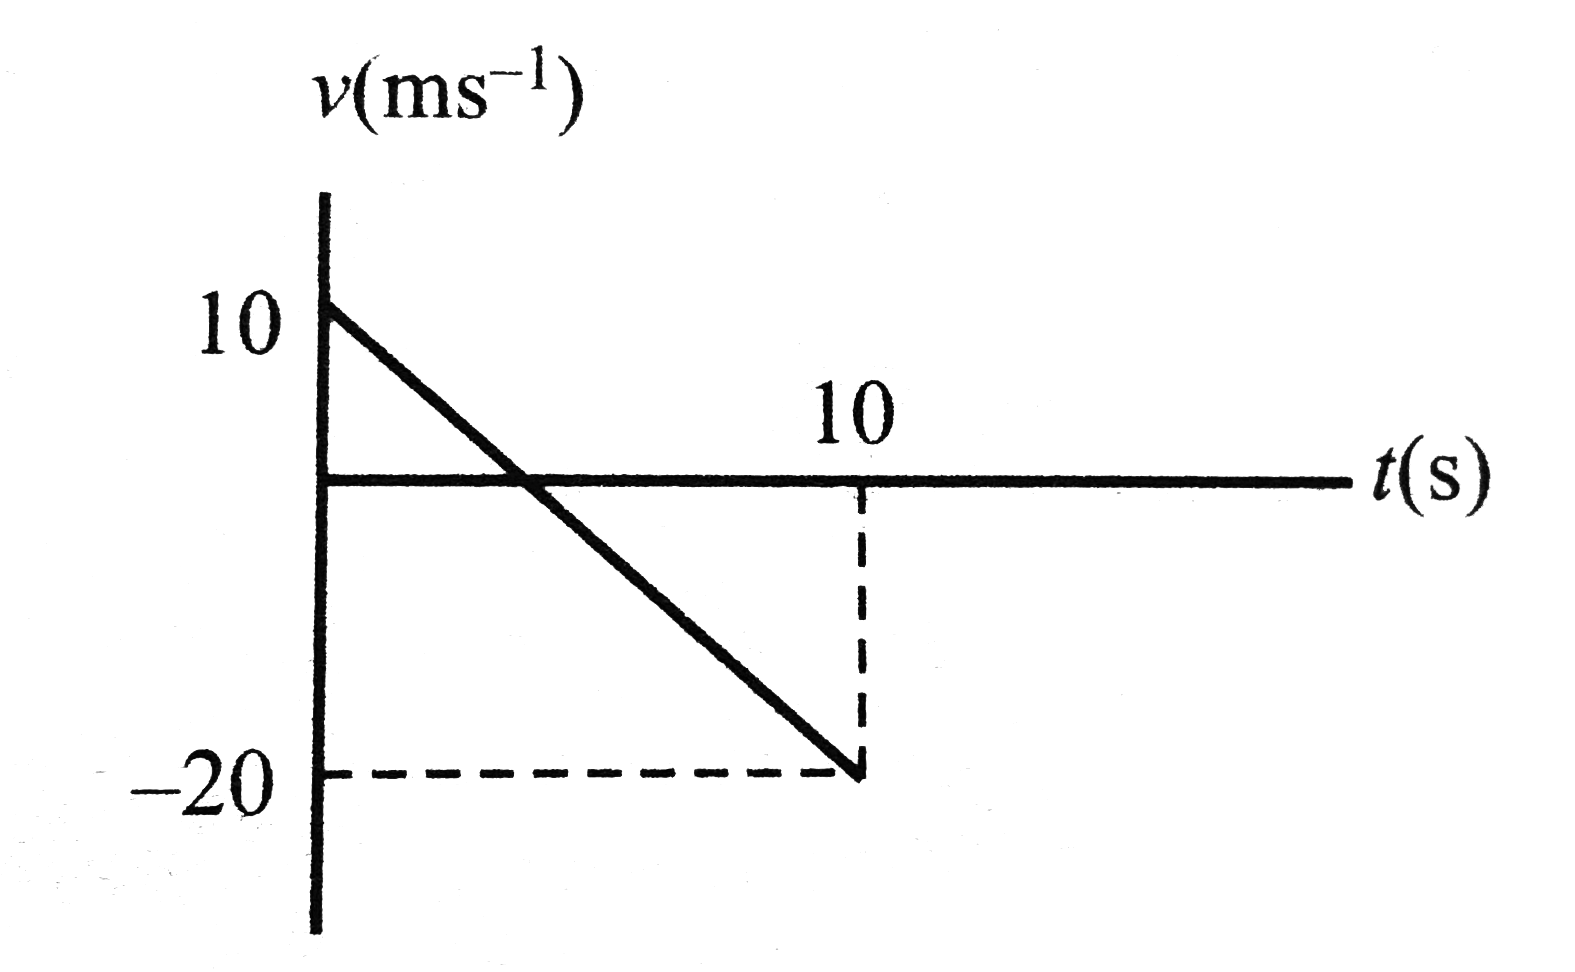
The velocity-time graph of a particle moving in a straight line is shown in figure. The mass of the particle is 2kg. Work done by all the forces acting on the particle in time interval between t=0 to t=10s is
 View Solution
Displacement time graph of a particle moving in a straight line is a shown in figure.
 View Solution
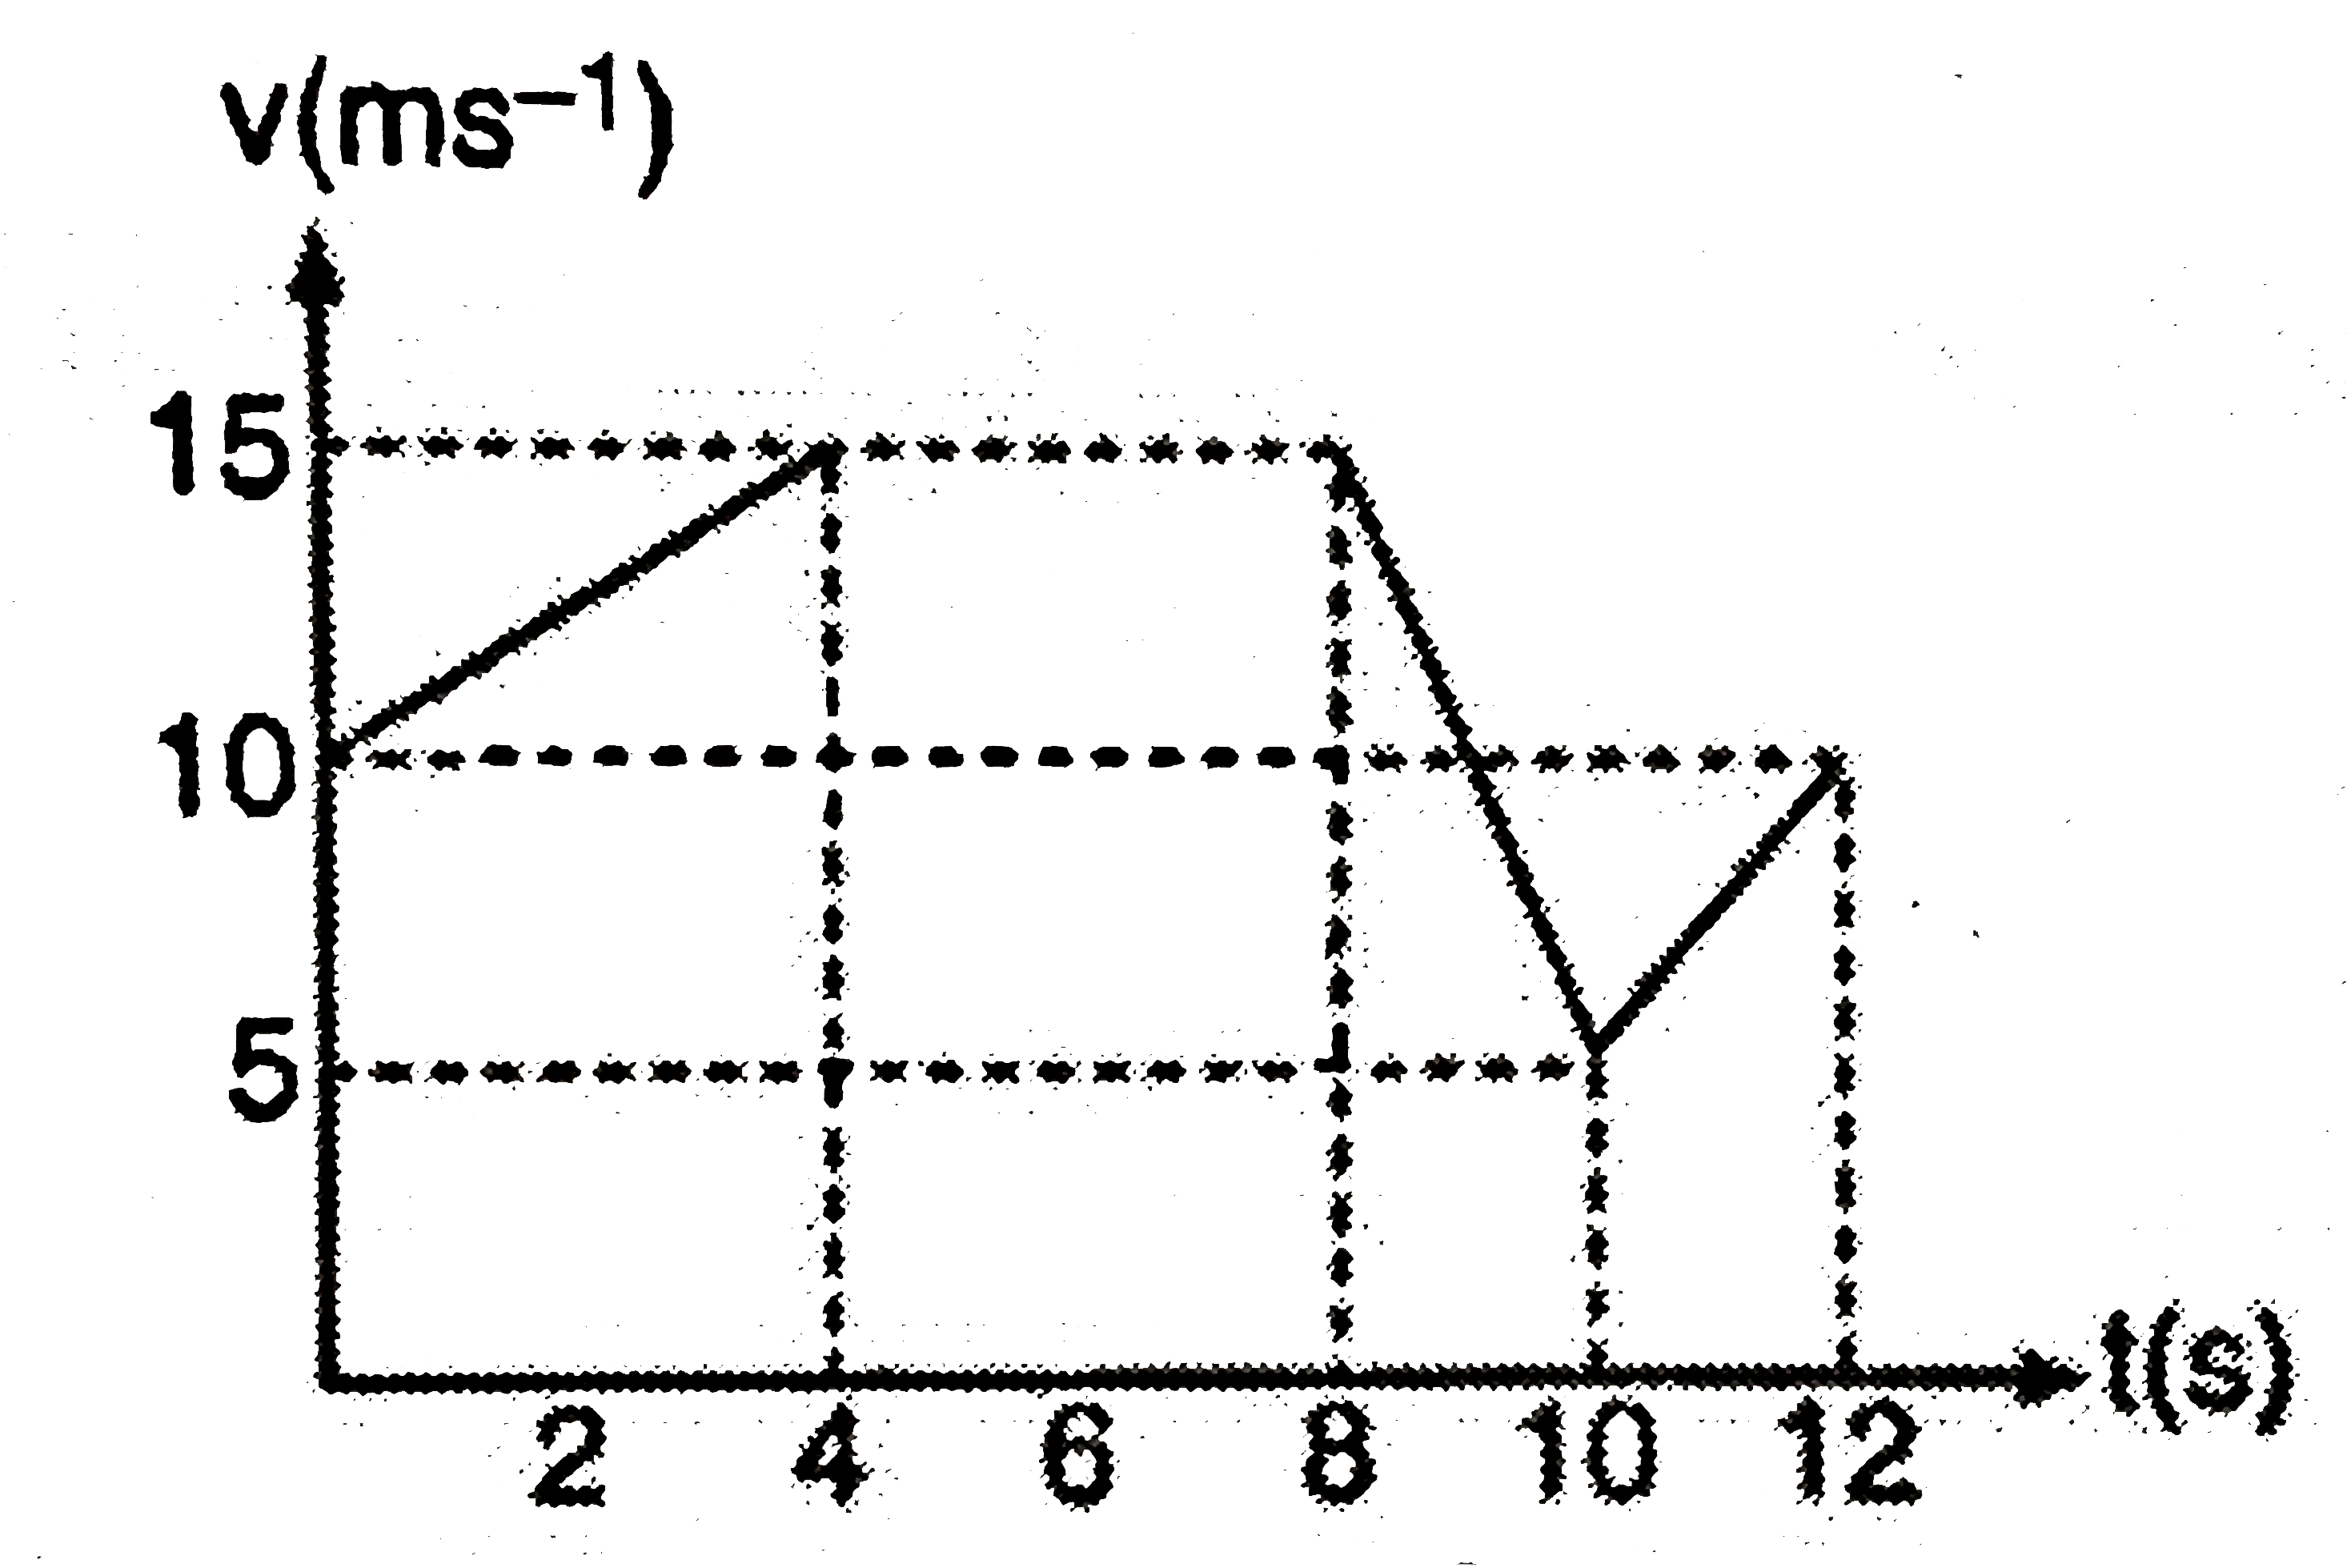
The velocity -time (v−t) graph of a particle moving in a straight line is shown in figure. The acceleration of the particle at t=9 is:
 View Solution
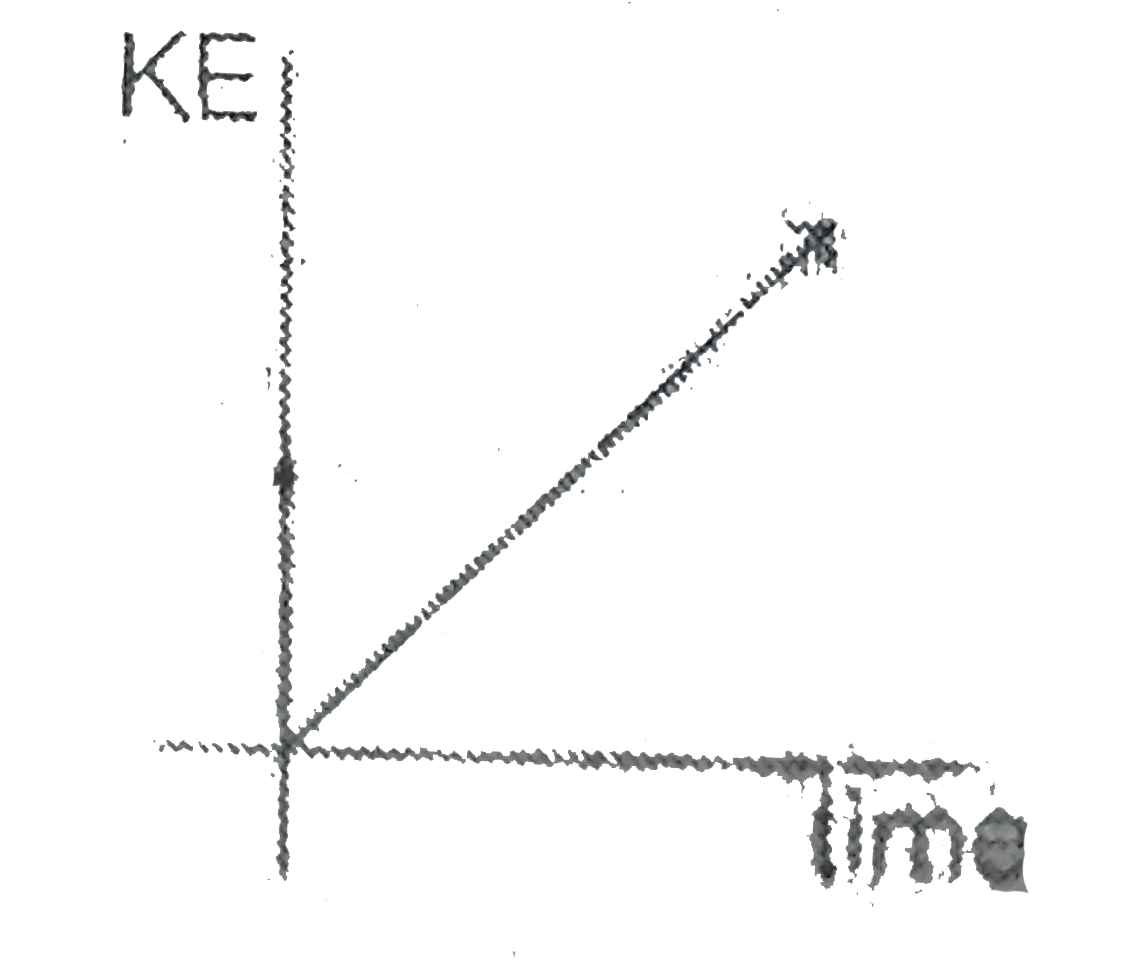
The kinetic energy (KE) versus time graph for a particle moving along a straight line is as shown in the figure. The force versus time graph for the particle may be
 View Solution
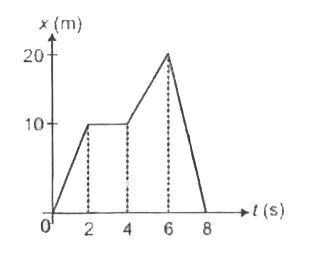
The position (x) - time (t) graph for a particle moving along a straight line is shown in figure. The average speed of particle in time interval t = 0 to t = 8 s is
 View Solution


