The velocity- time graph of the particle moving along a straight line is shown. The rate of acceleration and deceleration is constant and it is equal to 5ms−2. If the average velocity during the motion is 20ms−1, then the value of t is

Video Solution
Text Solution
5s
|
Topper's Solved these Questions
- KINEMATICSBOOK - MOTIONCHAPTER - KINEMATICSEXERCISE - EXERCISE 3 SUBJECTIVE PROBLEMS (Level-2)
15 Videos
- KINEMATICSBOOK - MOTIONCHAPTER - KINEMATICSEXERCISE - EXERCISE 4 PREVIOUS YEAR (LEVEL 1)
22 Videos
- KINEMATICSBOOK - MOTIONCHAPTER - KINEMATICSEXERCISE - EXERCISE 2 OBJECTIVE PROBLEMS (Level-2)
26 Videos
- HYDROSTATIC, FLUID MECHANICS & VISCOSITYBOOK - MOTIONCHAPTER - HYDROSTATIC, FLUID MECHANICS & VISCOSITYEXERCISE - EXERCISE -3 (SECTION-B) PREVIOUS YEAR PROBLEM
7 Videos
- KINETIC THEORY OF GASES BOOK - MOTIONCHAPTER - KINETIC THEORY OF GASES EXERCISE - EXERCISE-3 SECTION-B
16 Videos
Similar Questions
Knowledge Check
The velocity-time graph of a particle moving along a straight line is shown is . The rate of acceleration and deceleration is constant and it is equal to 5ms−2. If the a average velocity during the motion is 20ms−1, Then
 .
.
The value of t is.A5sB10sC20sD5√2sThe velocity-time graph of a particle moving along a straight line is shown is Fig. The rate of acceleration and deceleration is constant and it is equal to 5ms−2. If the a average velocity during the motion is 20ms−1, Then
 .
.
The maximum velocity of the particle isA20ms−1B25ms−1C30ms−1D40ms−1The velocity-time graph of a particle moving along a straight line is shown is Fing. The rate of acceleration and deceleration is constant and it is equal to 5ms−2. If the a average velocity during the motion is 20ms−1, Then
 .
.
The distace travelled with uniform velcoty is .A375 mB125mC300mD450m

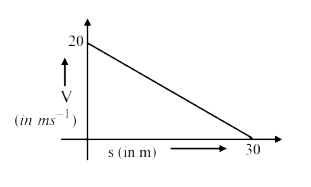
The velocity displacement graph of a particle moving along a straight line is shown in figure.
Then the acceleration displacement graph is.
View SolutionThe velocity-displacement graph of a particle moving along a straight line is shown. The most suitable acceleration-displacement graph will be

View SolutionThe velocity - displacement graph of a particle moving along a straight line is shown
The most suitable acceleration - displacement graph will be

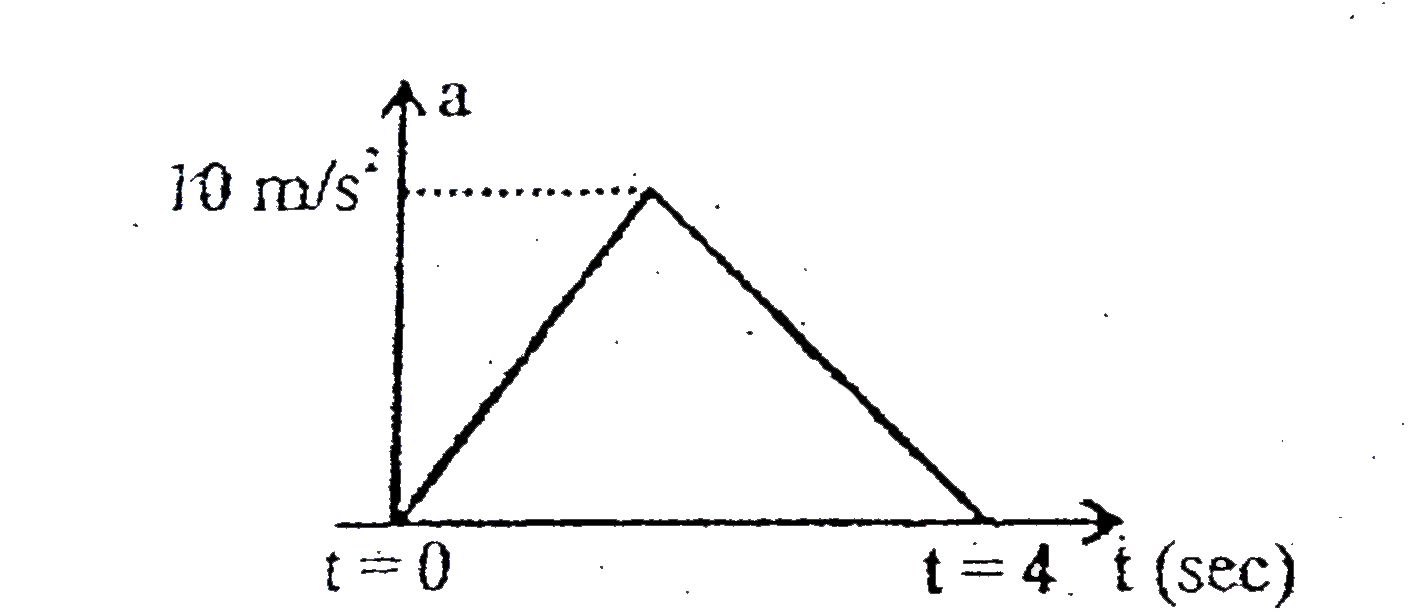
View SolutionAcceleration time graph of a particle moving along a straight line is given. Then average acceleration between t=0 & t=4 is :−

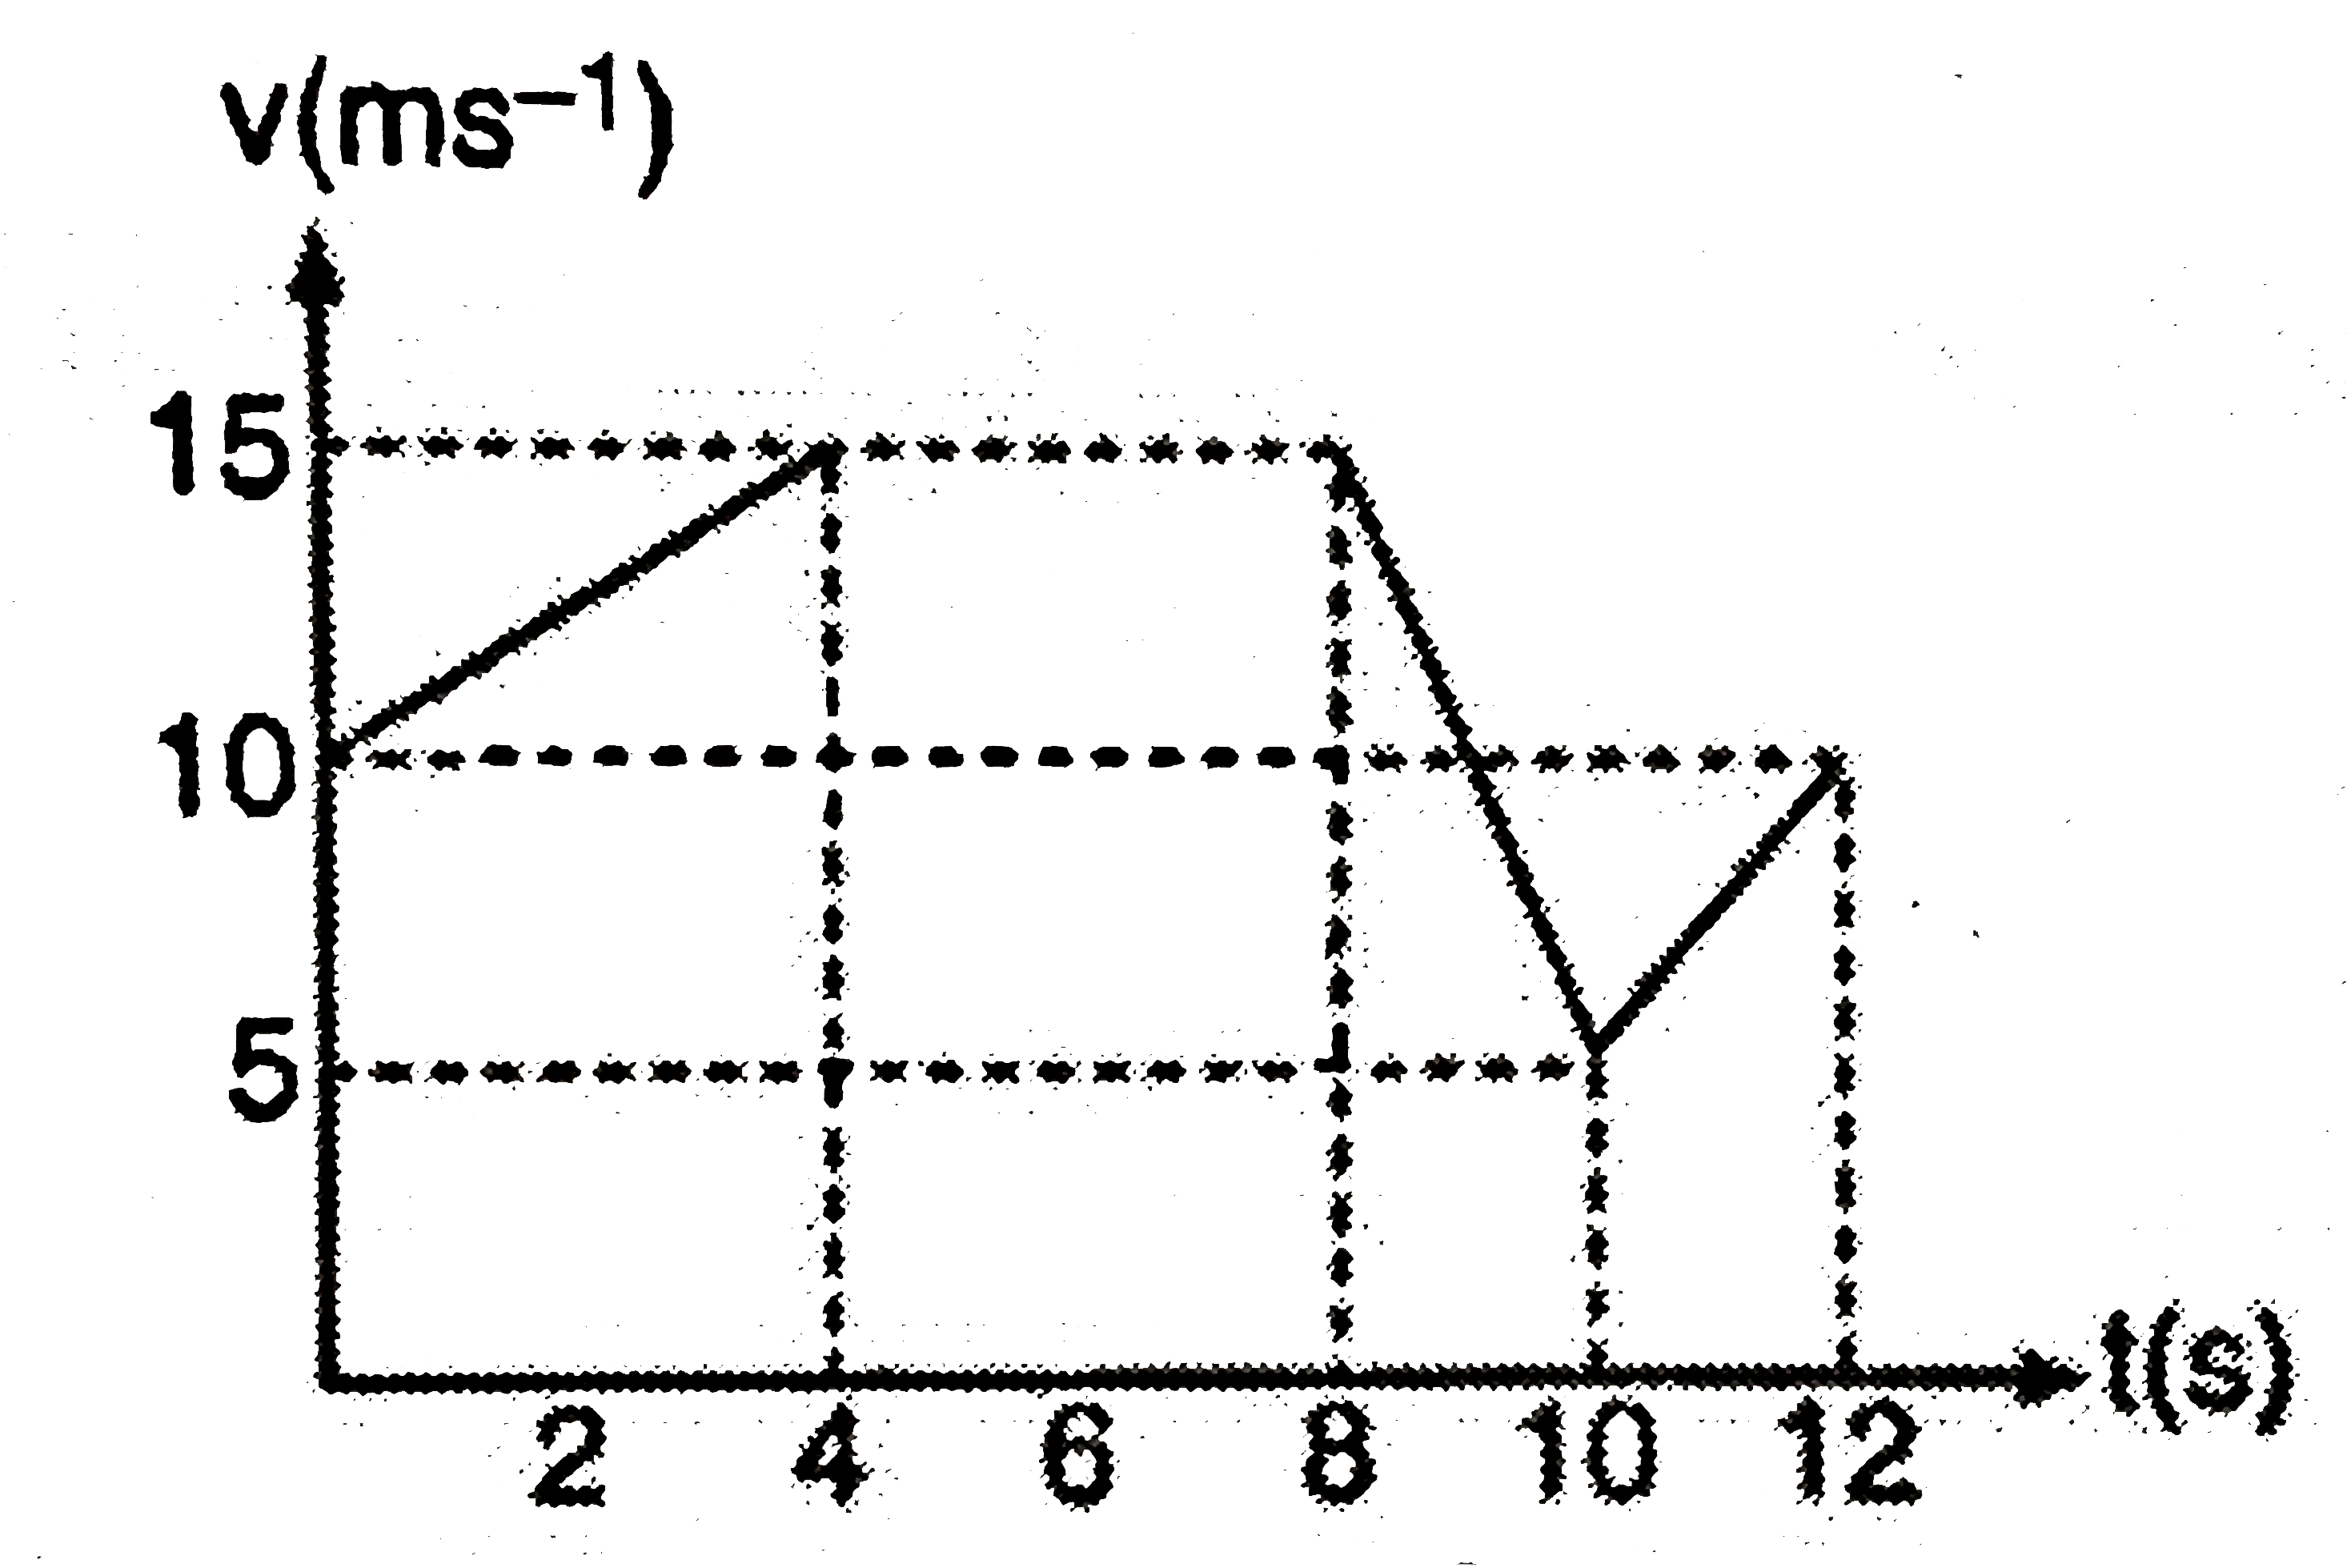
View SolutionThe velocity -time (v−t) graph of a particle moving in a straight line is shown in figure. The acceleration of the particle at t=9 is:

View Solution


