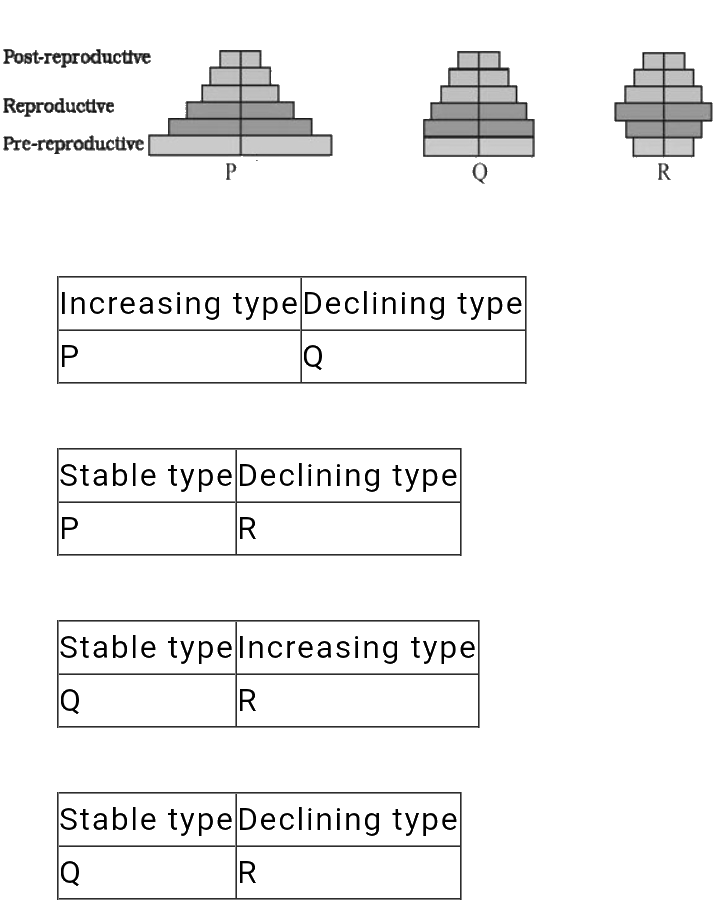
A country with a high rate of population growth took measures to reduce it. The figure below shows age-sex pyramids of populations "A" and "B" twenty years apart. Select the correct interpretation about them
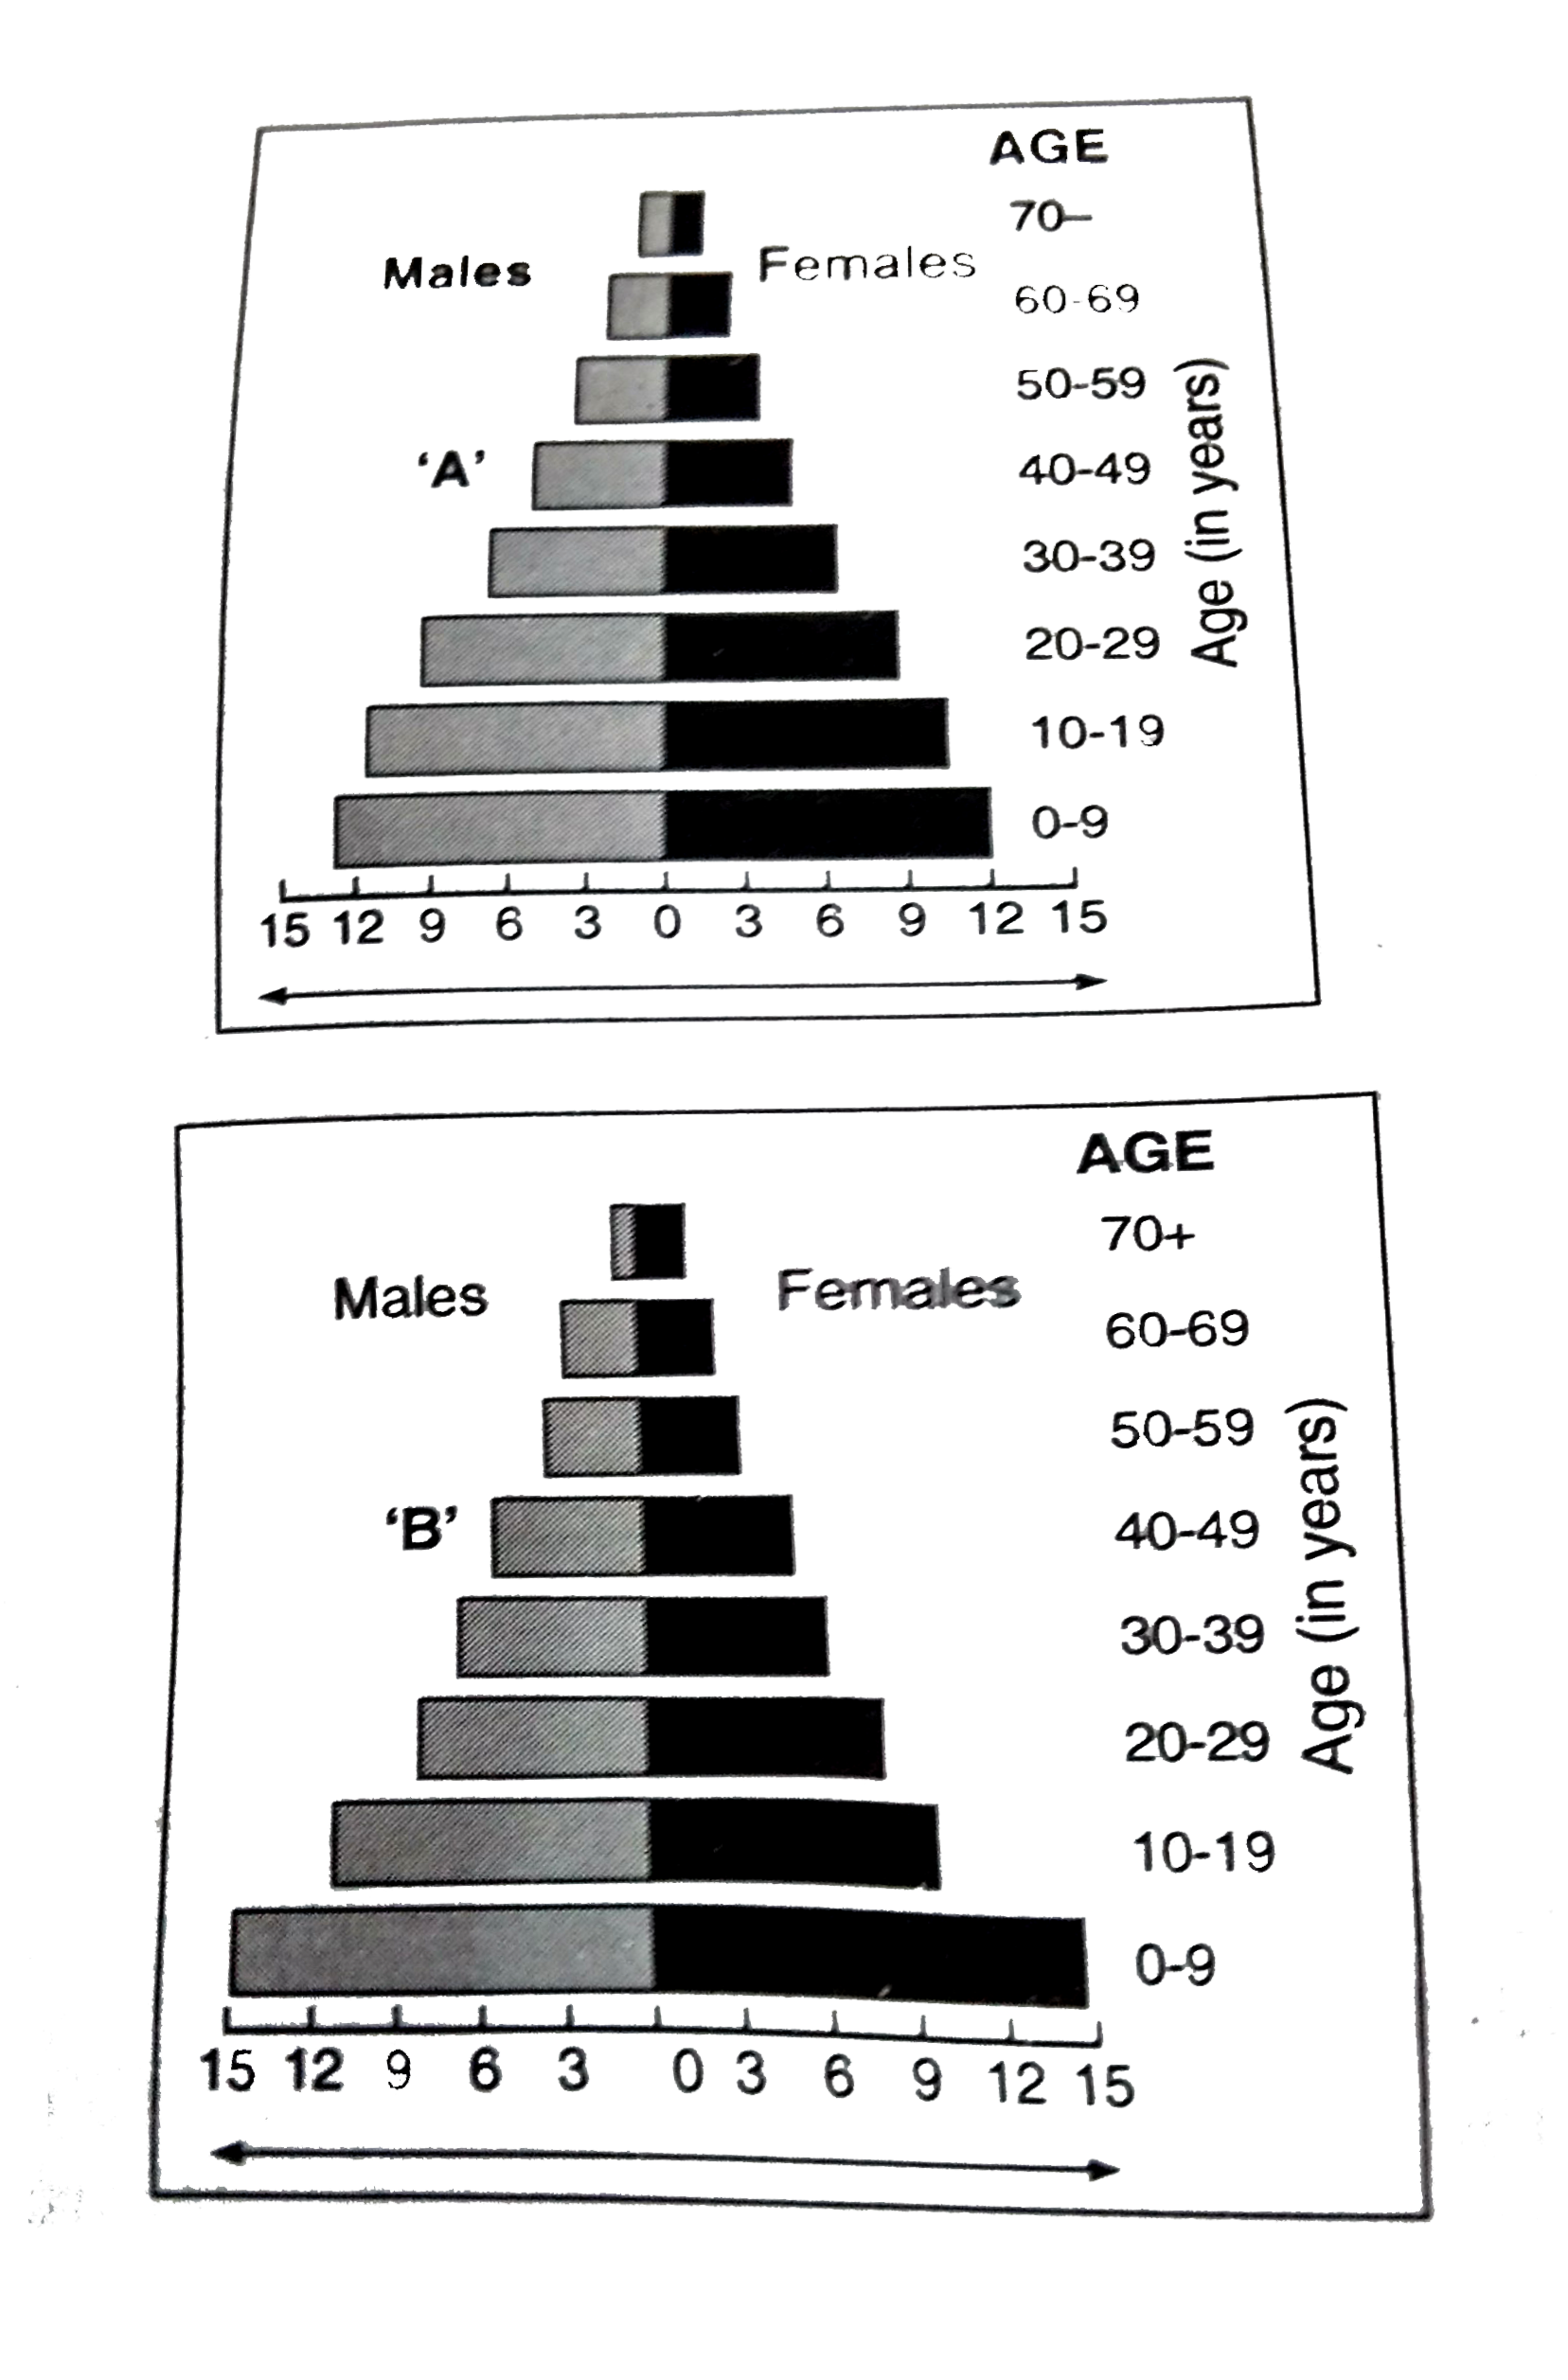
Interpretations:
"A" is more recent and shows slight reduction in the growth rate
"A" is the earlier pyramid and no change has occurred in the growth rate
"B" is earlier pyramid and shows stabilised growth rate
"B" is more recent showing that population is very young
The correct Answer is:A
Topper's Solved these Questions
- BOOK - GRB PUBLICATIONCHAPTER - POPULATION : INTERACTIONS AND ATTRIBUTESEXERCISE - NCERT Corner (Exemplar Problems)32videos
POPULATION : INTERACTIONS AND ATTRIBUTES
- BOOK - GRB PUBLICATIONCHAPTER - PLANT BREEDING AND TISSUE CULTUREEXERCISE - NCERT CORNER15videos
PLANT BREEDING AND TISSUE CULTURE
- BOOK - GRB PUBLICATIONCHAPTER - REPRODUCTION IN ORGANISMSEXERCISE - EXEMPLAR PROBLEMS33videos
REPRODUCTION IN ORGANISMS
Similar Questions
Knowledge Check
- Question 1 - Select One
Representation of age pyramids for human population is given below. Identify A, B and C by selecting the correct option:
 AABCDecliningStableExpandingBABCStableExpandingDecliningCABCExpandingStableDecliningDABCStableDecliningExpanding
 - Question 2 - Select One
Many population colonising a new habitat show a logistic population growth pattern over time, as shown in the figure below.
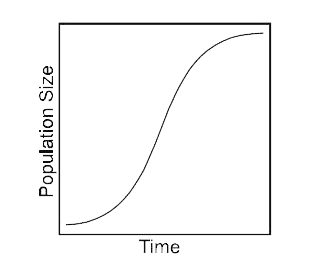
In such a population, the POPULATION growth rateAstays constant over timeBincreases and then reaches an asymptoteCdecreases over timeDincreases to a maximum and then decrease - Question 3 - Select One
Age-sex sturcture of a population can be depicted in the form of a pyramid by plotting the percentage of population of each sex in each age class. Two age sex pyramids are given here.
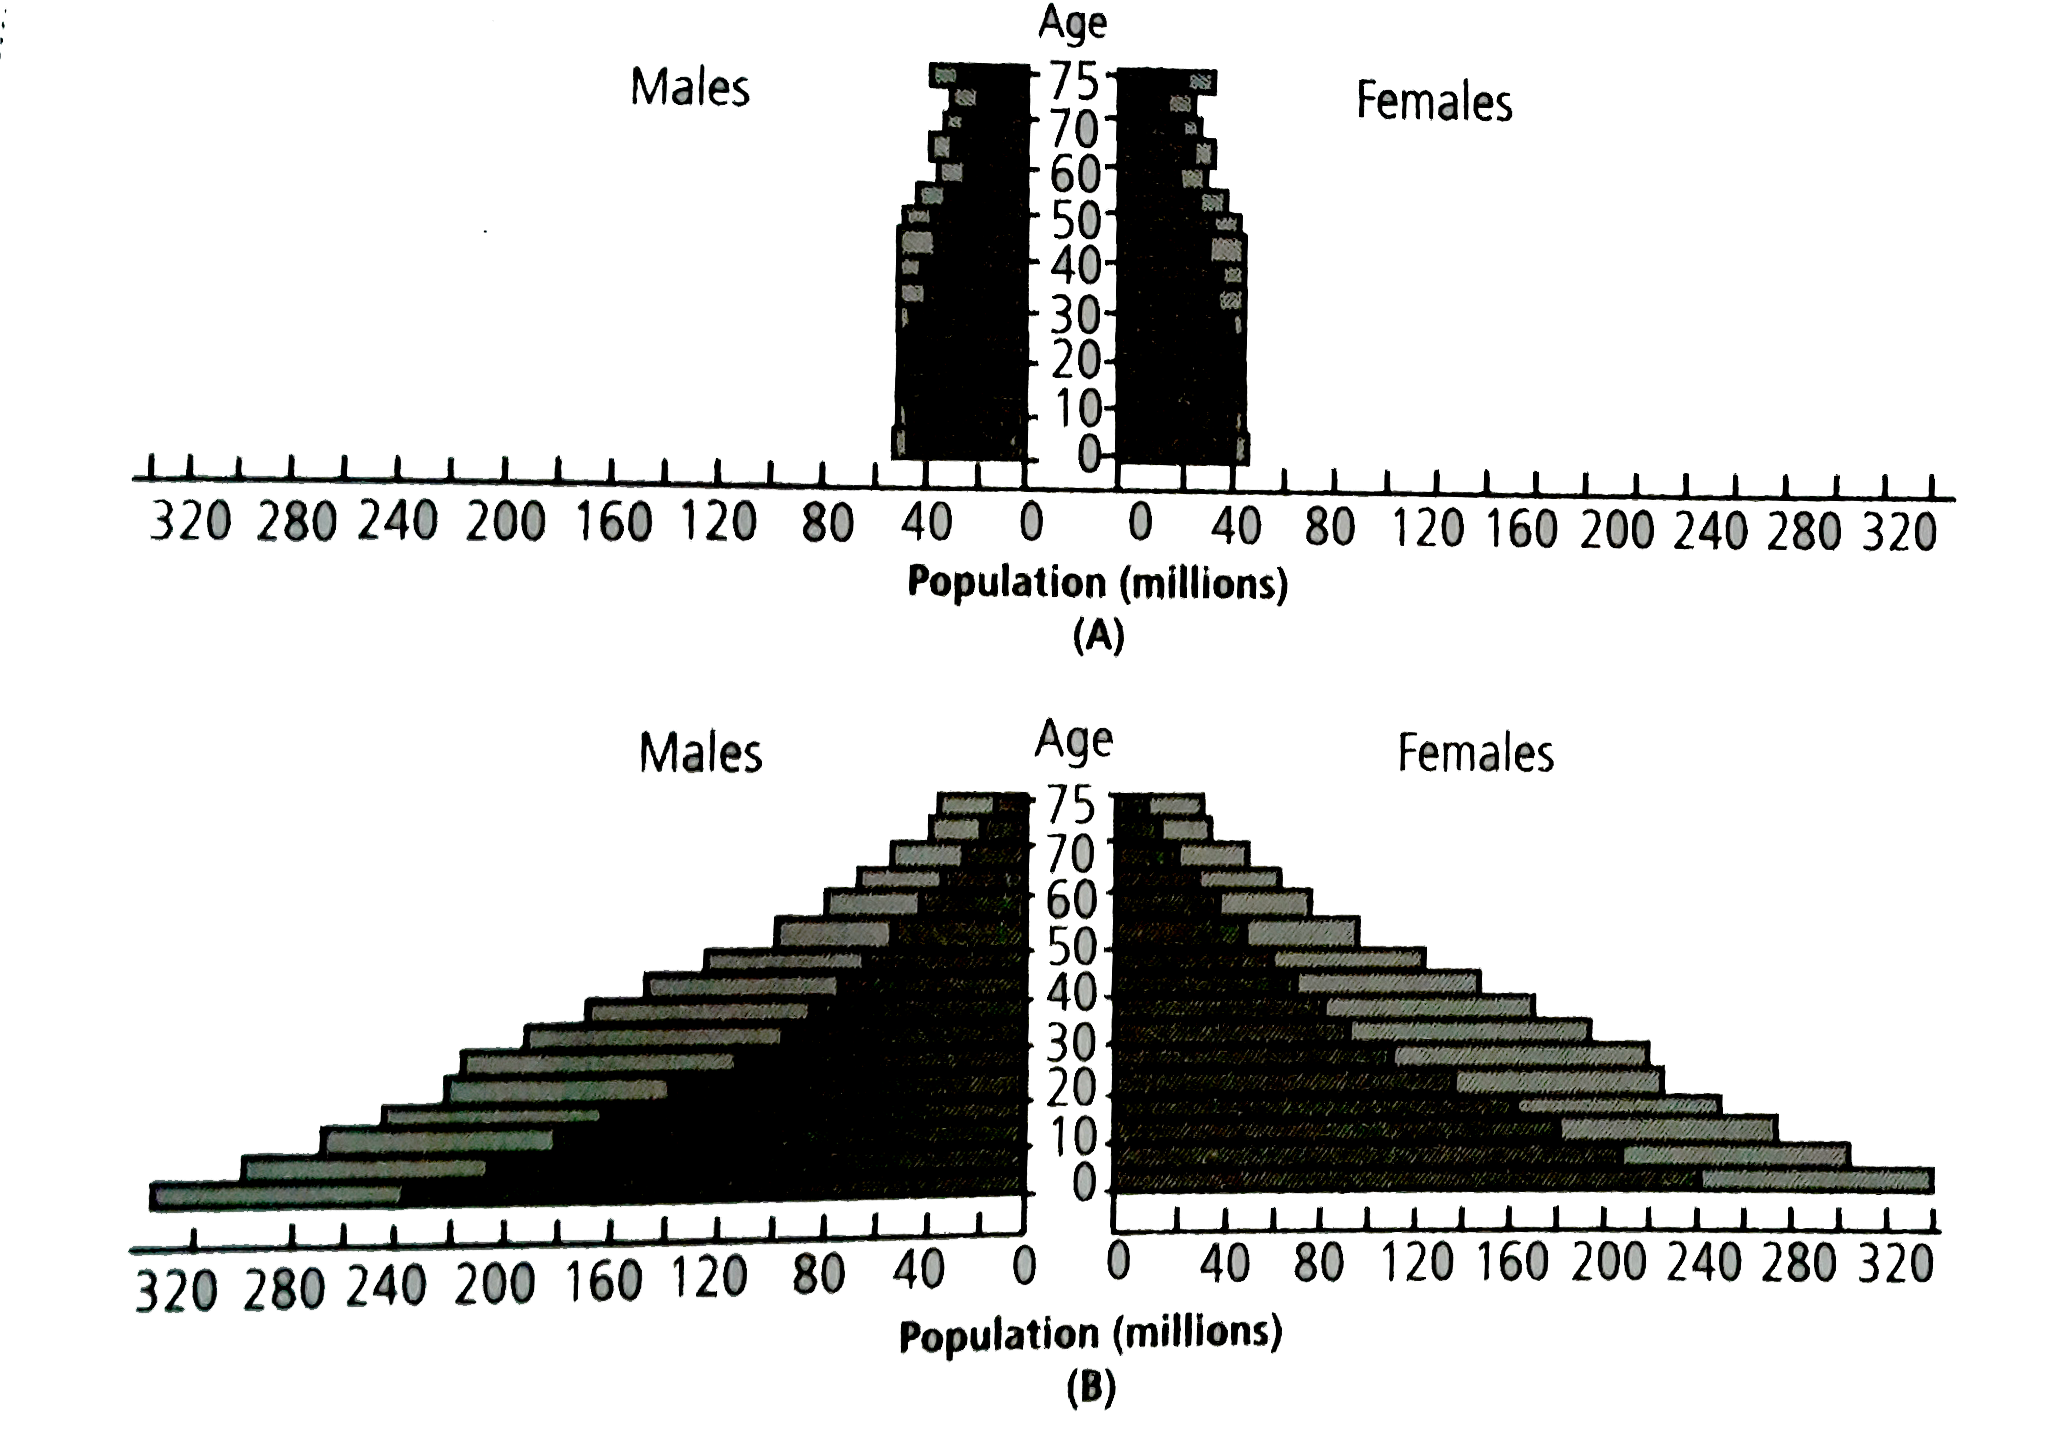
Study carefully the above age-sex pyramids and select the correct statements regarding these.AA represents the age-sex pyramid for a developed country and B represents the age-sex pyramid for a developing country.BB is a much less steep pyramid, representing a radpdly growing population, like that of india, as it has a much larger number of young people.CA is a stepper pyramid, which represents a nearly stable populationDAll of these
Representation of age pyramids for the human population is given below. Identify A, B, and C by selecting the correct option .
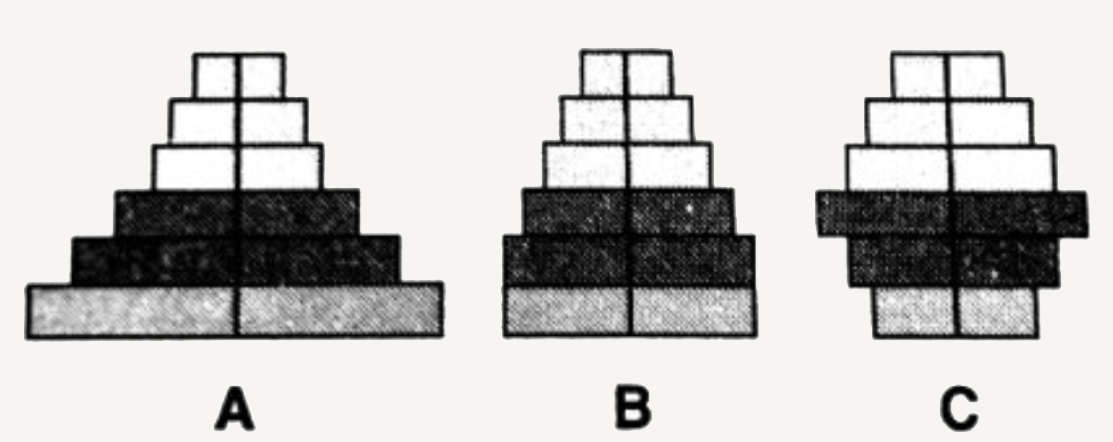 View Solution
Representation of age pyramids for the human population is given below. Identify A, B, and C by selecting the correct option .
 View Solution
The births and deaths of four populations A, B, C and D in a year are given below. Which population has the highest growth rate?
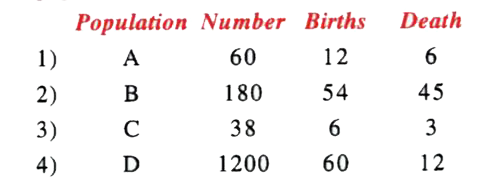 View Solution
Age-sex sturcture of a population can be depicted in the form of a pyramid by plotting the percentage of population of each sex in each age class. Two age sex pyramids are given here.

Study carefully the above age-sex pyramids and select the correct statements regarding these.View SolutionRead the following text and answer the following question on the basis of the same :
Growth of population with time shows specific and predictable patters. Two types of growth patter of populaiton are exponetial and logistic growth . When resource in the habitat are unlimited each species has the ability to relize fully its innate potential to grow in number . Then the population gorws in exponential fashion . When the resource are limited growth curve shows an inital slow rate and then it accelerates and finally slows giving the gorwth curve which is sigmoid .
Study the population growth curves (A and B) in the given graph and select the incorrect statement :
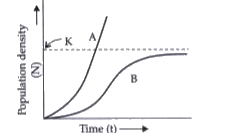 View Solution


