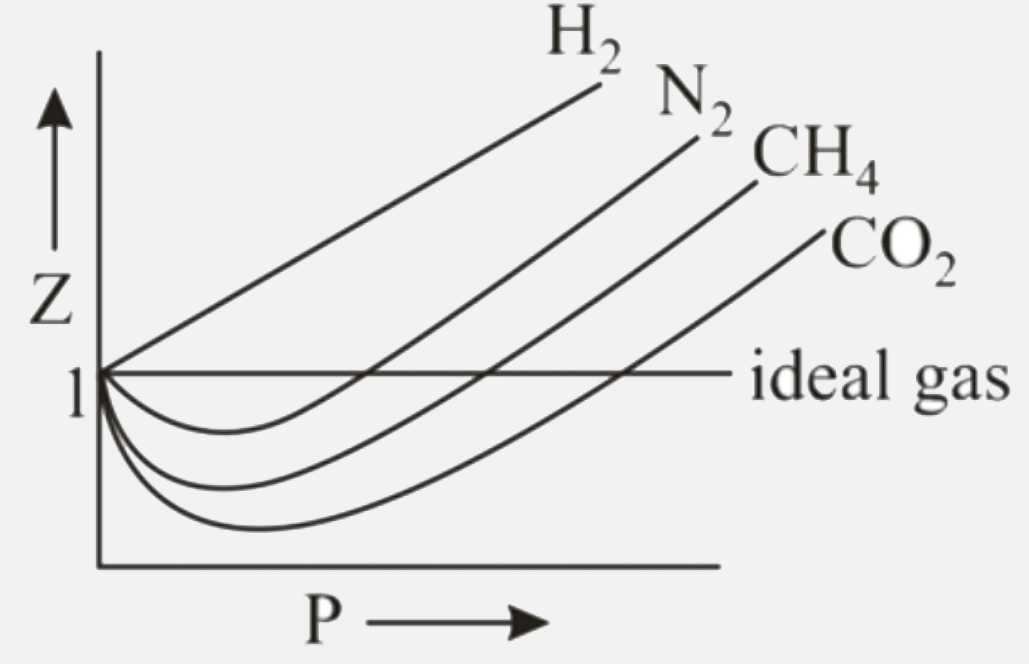
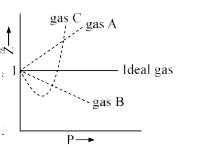
Consider the graph between compressibility factor Z and pressure P,
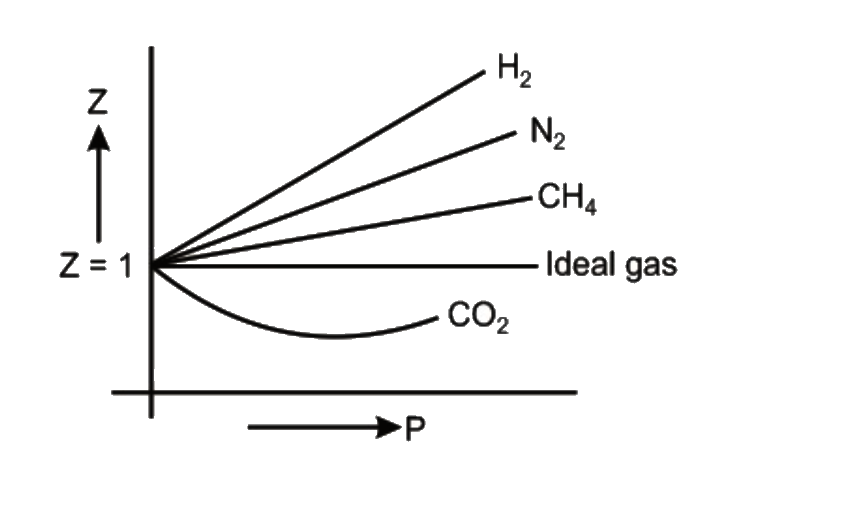
The correct increaing order of ease of liquefaction of the gases shown in the above graph is
H2<N2<CH4<CO2
CO2<CH4<N2<H2
H2<CH4<N2<CO2
CH4<H2<N2<CO2
The correct Answer is:A
Step by step video, text & image solution for Consider the graph between compressibility factor Z and pressure P, The correct increaing order of ease of liquefaction of the gases shown in the above graph is by Chemistry experts to help you in doubts & scoring excellent marks in Class 12 exams.
Topper's Solved these Questions
Similar Questions
Knowledge Check
- Question 1 - Select One
Consider the graph between compressibility factor Z and pressure P:
The correct increasing order of ease of liquefaction of the gases shown in the above graph isAH2<N2<CH4<CO2BCO2<CH4<N2<H2CH2<CH4<N2<CO2DCH4<H2<N2<CO2 - Question 2 - Select One
Consider the graph between compressibility factor Z and pressure P:
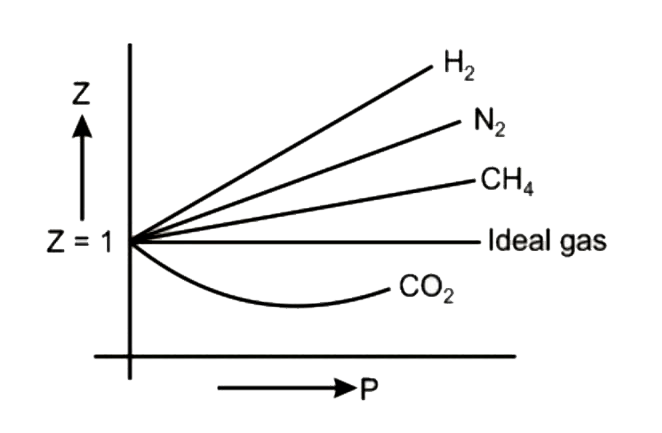
The correct increasing order of ease of liquefaction of the gases shown in the above graph is:AH2<N2<CH4<CO2BCO2<CH4<N2<H2CH2<CH4<N2<CO2DCH4<H2<N2<CO2 - Question 3 - Select One
Real gases deviated from ideal behaviour due to the following two faulty assumptions of kinetic theory of gases :
(i) Actual volume occupied by the gas molecule is negligible as compared to the total volume of the gases
(ii) Forces of attraction and repulsion among gas molecules are negligible
To explain the extent of deviation of the real gas from ideal behaviour in terms of compressibility or compression factor (z), which is the function of pressure and temperature for real gases z=P0V0nRT For ideal gases z=1. for real gases either z>1 or z>1.
When z>1, then it is less compressible because force of repulsion dominates over force of attraction. When z<1, force of attraction dominates over the repulsion and it is more compressible.
Graph in between z and P is shown below on increasing the temperature, z increases and approaches to unity. Graph between z and p at different temperature are as under
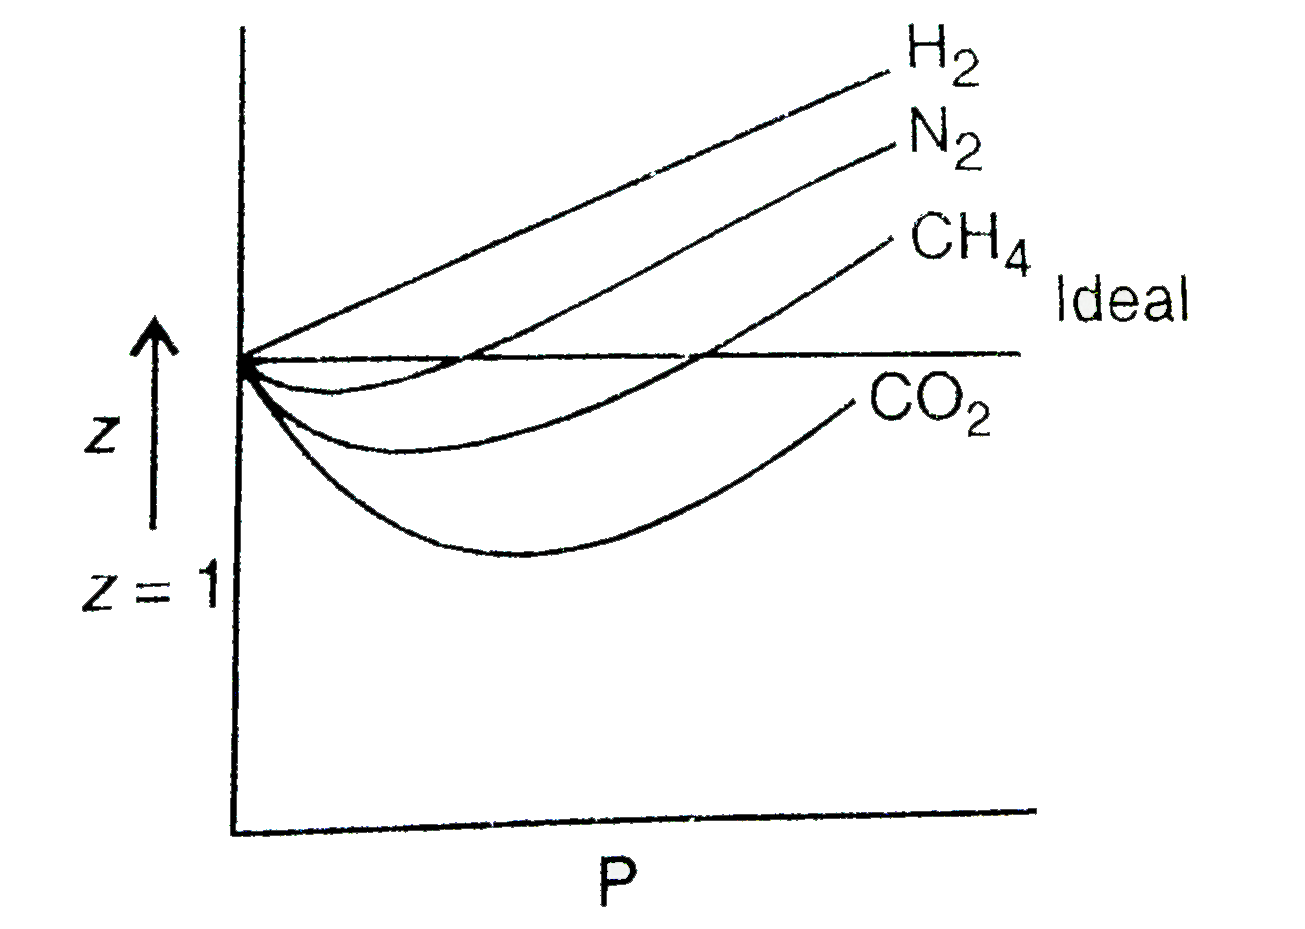
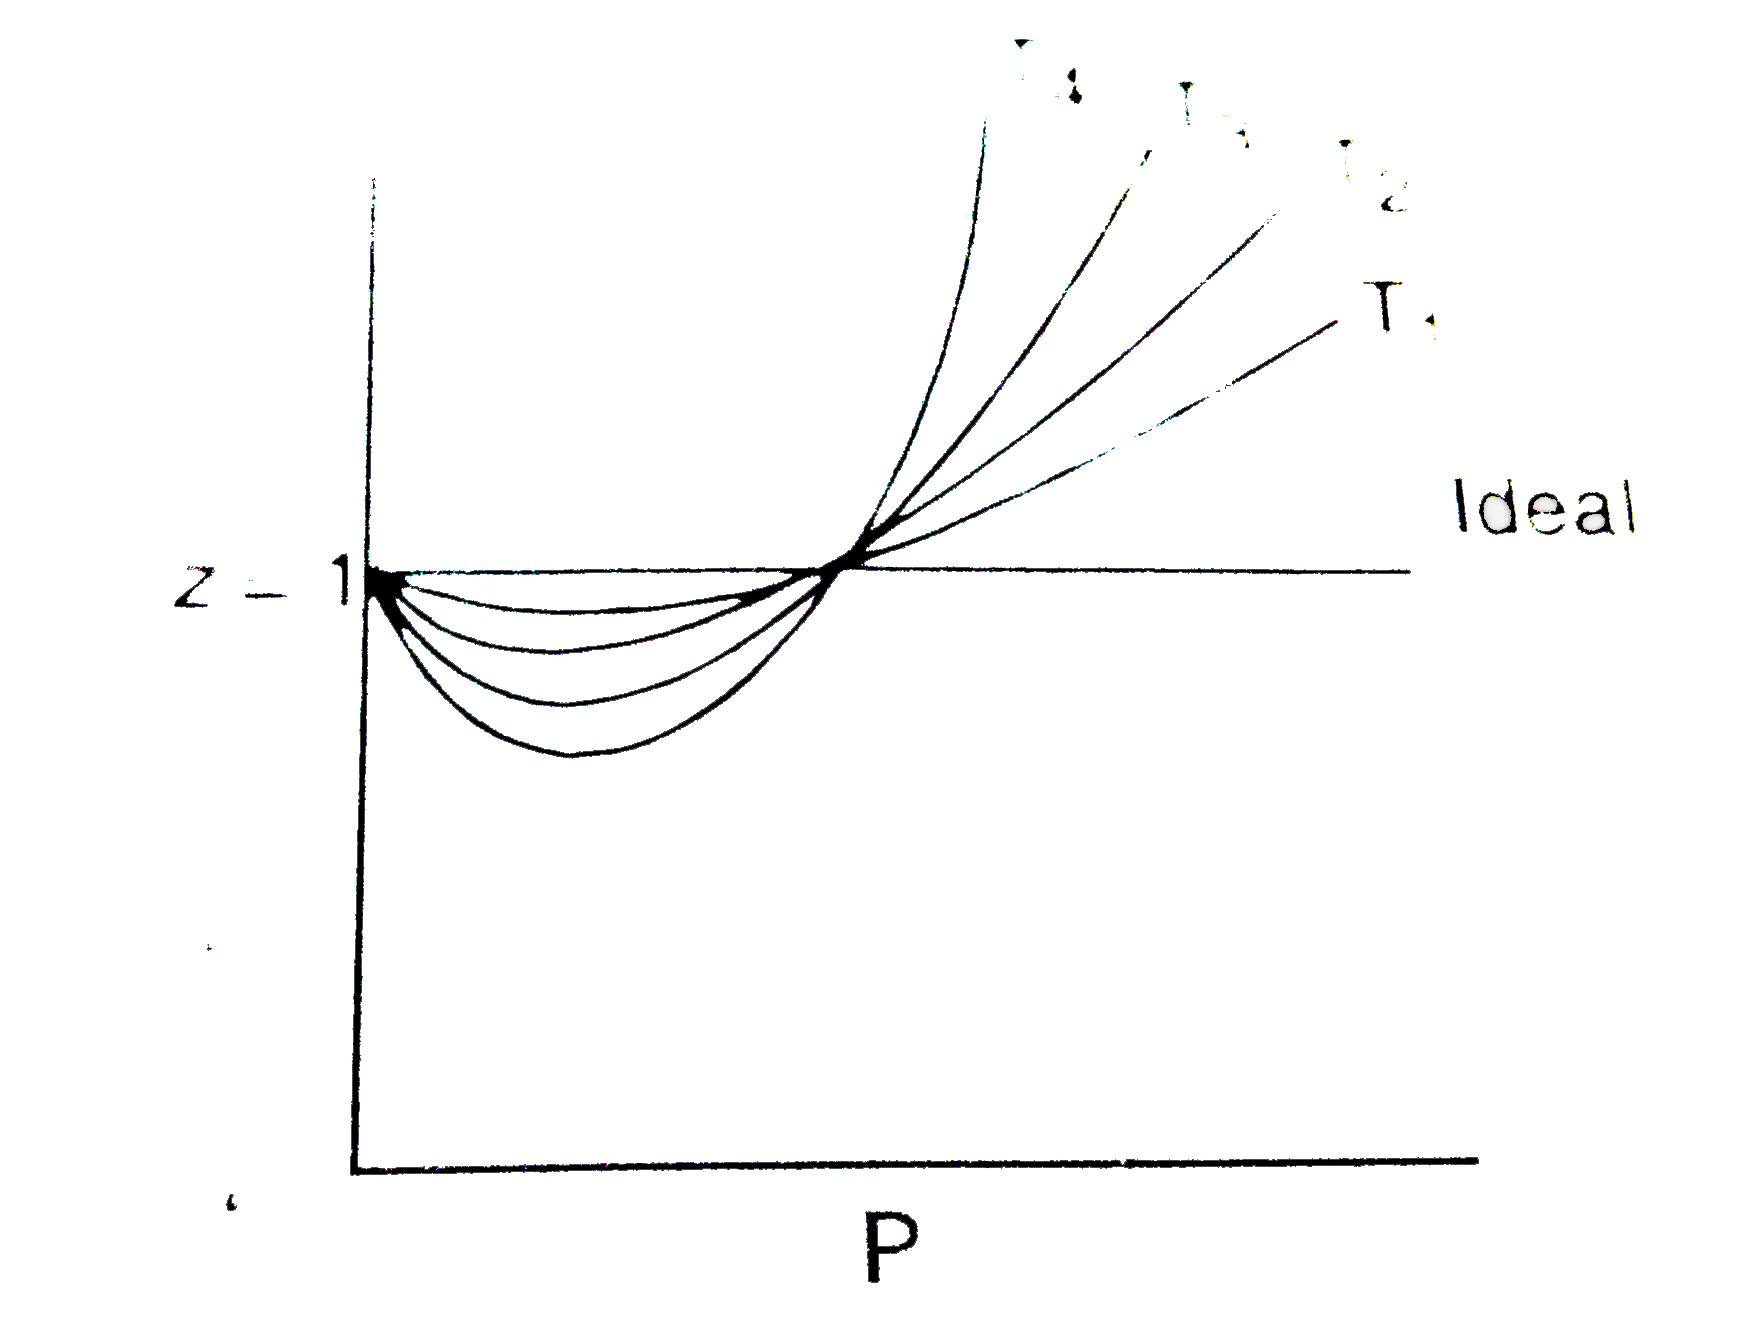
Answer the following questions on the basis of above write up :
What is correct increasing order of liquefibility of the gases shown in the above graph ?AH2<N2<CH4<CO2BCO2<CH4<N2<H2CH2<CH4<N2<CO2DCH4<H2<N2<CO2
Choose the correct graph between pressure and volume of ideal gas.
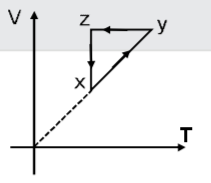 View Solution
The given graph represents the variations of compressibility factor Z=pv/nRT vs P for three real gases Which of the following statements is wrong?
 View Solution
Following graph is obtained for four different reactions
On the basis of above graph, correct increasing order of reaction is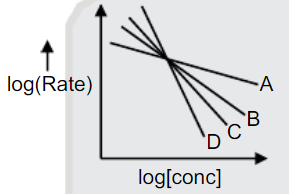 View Solution
Graph between speed v of sound in air and pressure P at a constant temperature is given by
View Solution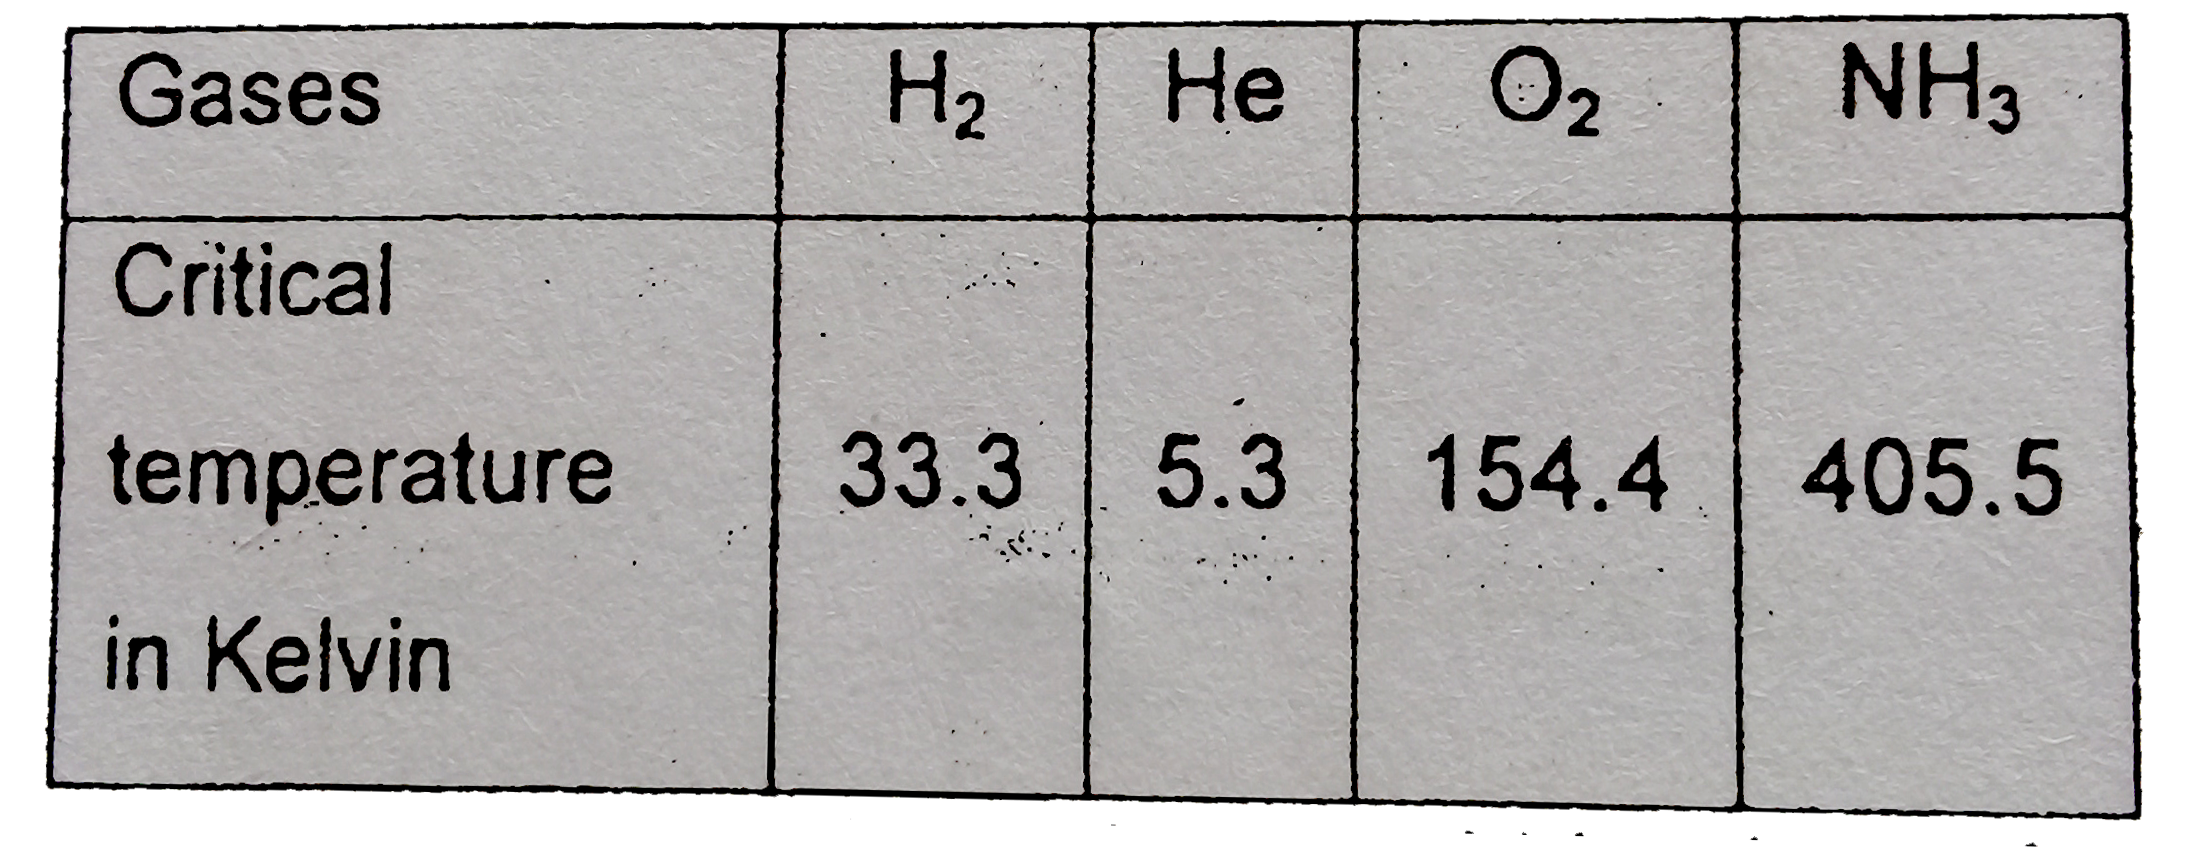
Gases possess characteristic critical temperature which depends upon the magnitude of intermolecular forces between the particles. Following are the critical tempeatures of some gases. From the above data what would be the order of liquefaction of these gases? Start writing the order from the gas liquefying first.View Solution


