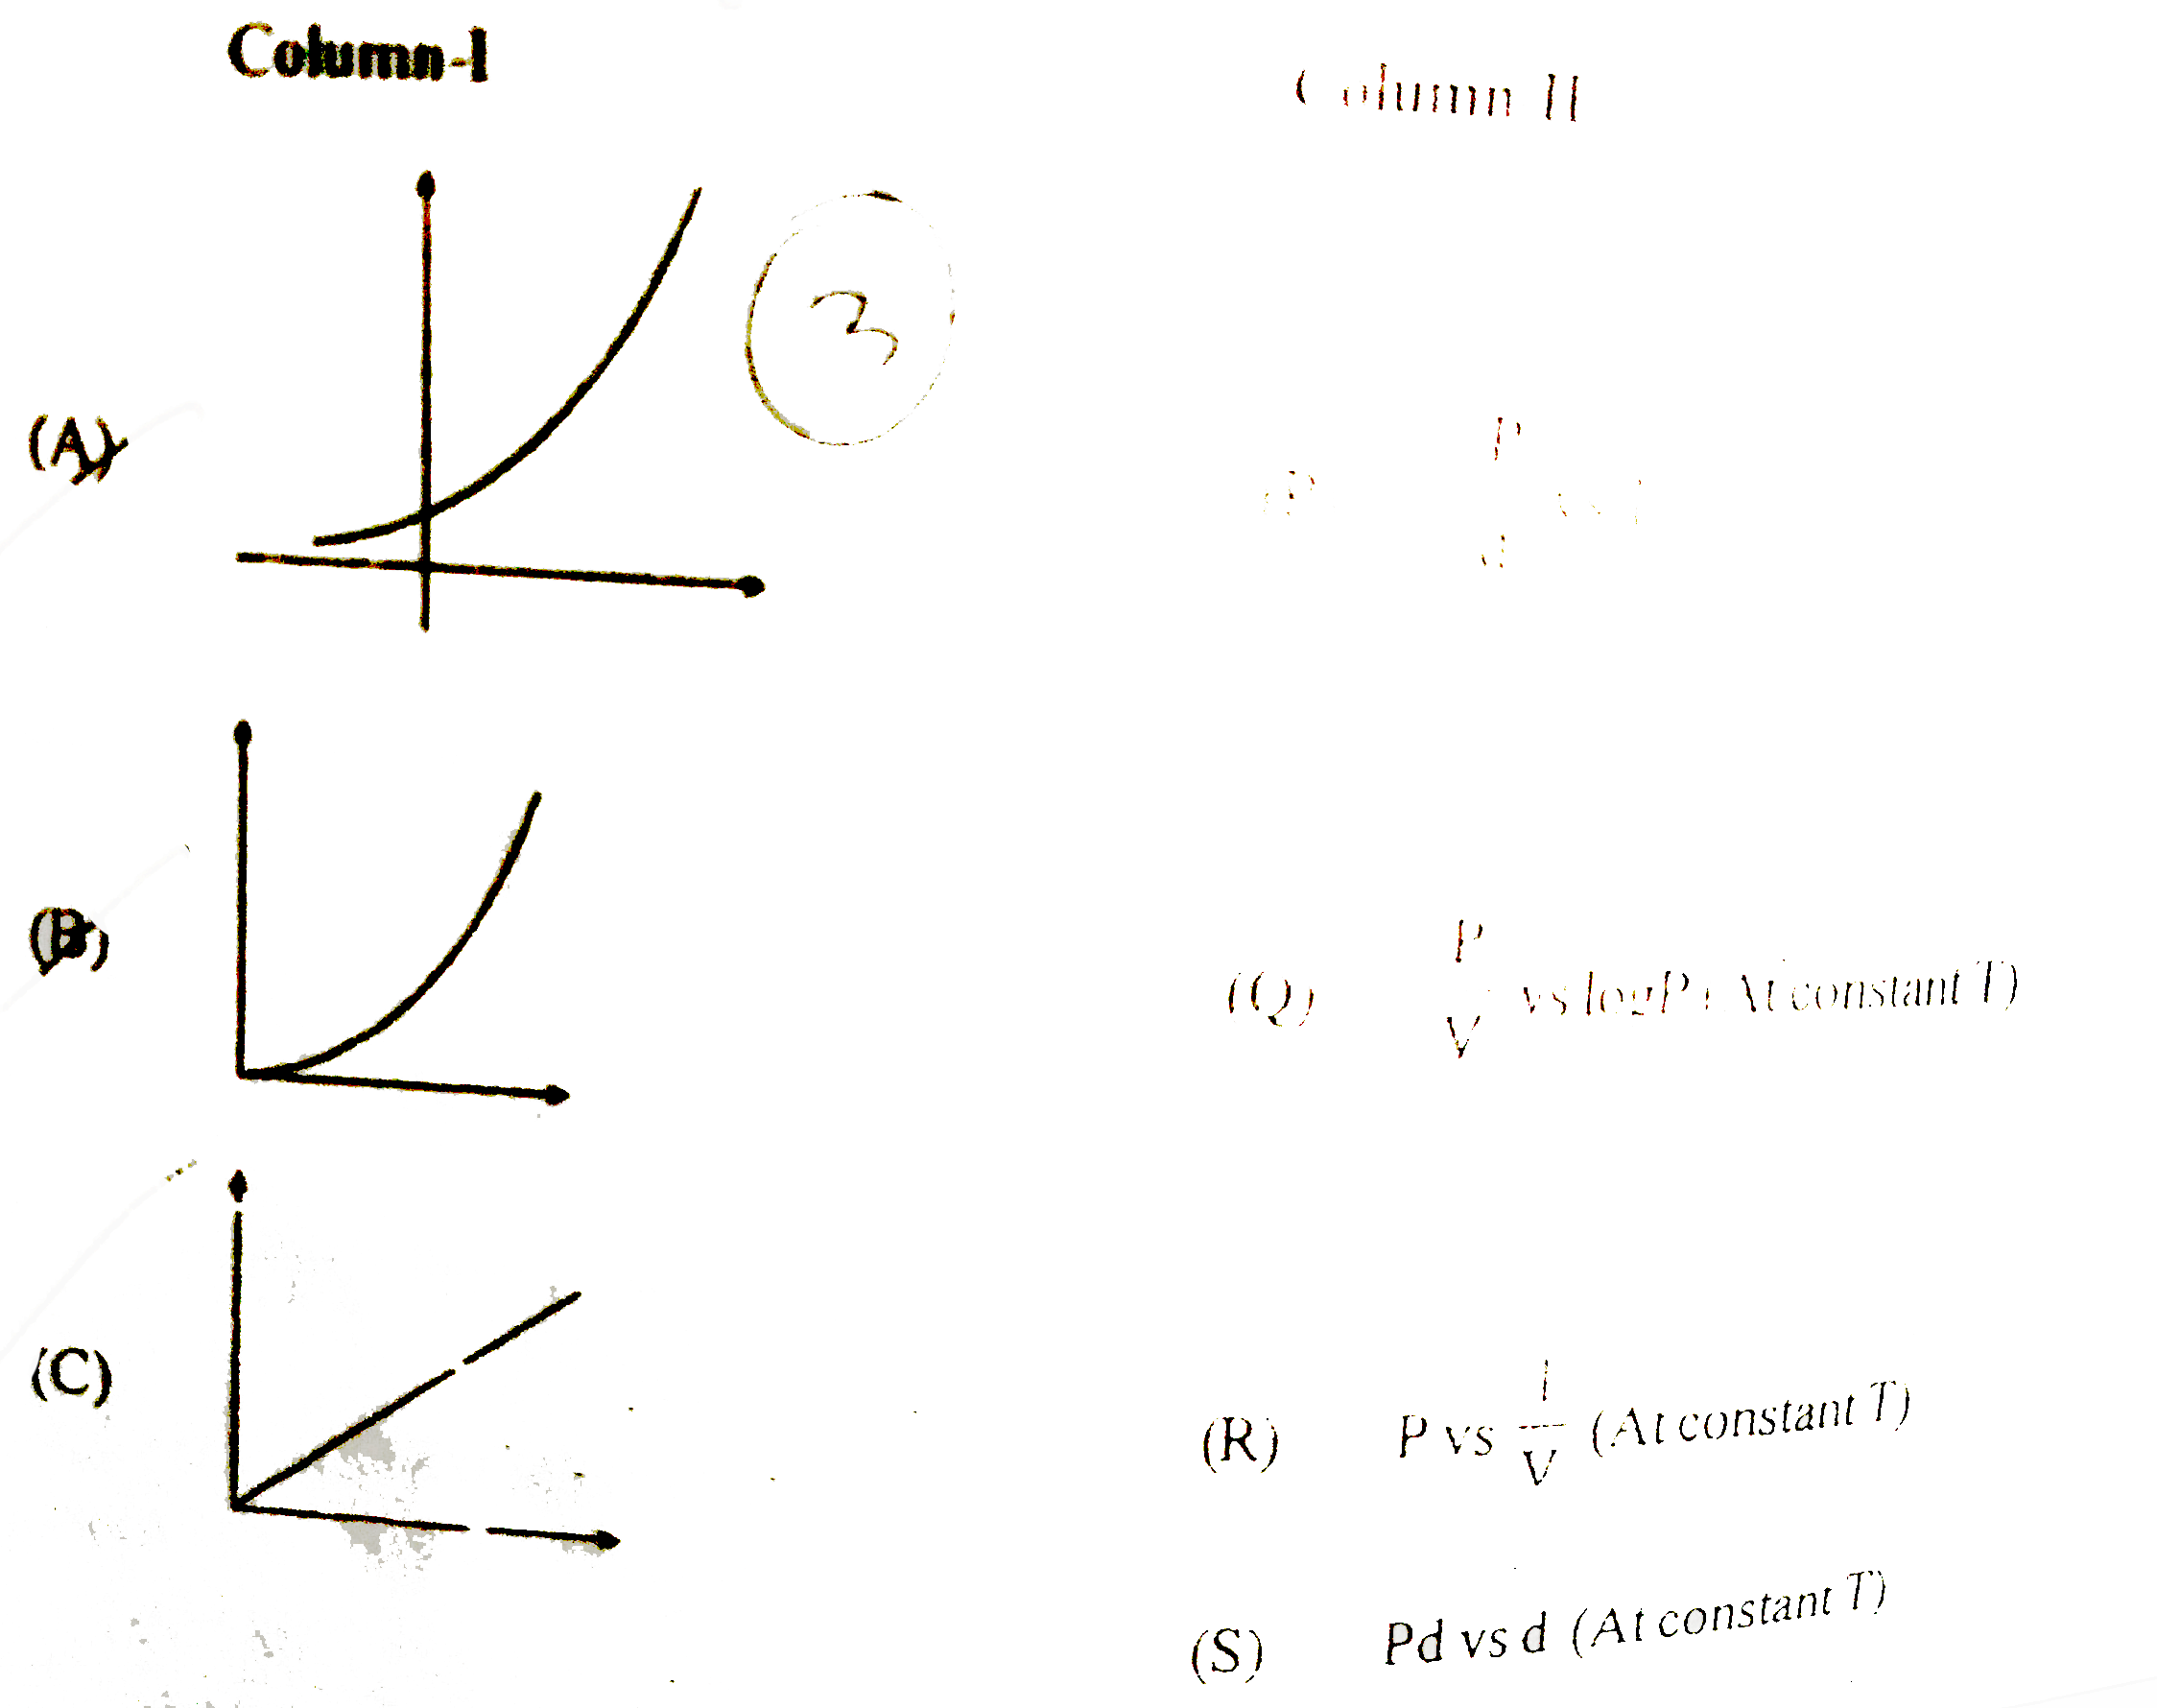
Which of the following diagrams correctly describes behaviour of a fixed mass of an ideal gas? (T is measured in K)
A

B

C

D

Text Solution
The correct Answer is:C
|
Topper's Solved these Questions
- GASEOUS STATEBOOK - SURA PUBLICATIONCHAPTER - GASEOUS STATEEXERCISE - EVALUATION (ANSWER THESE QUESTIONS BRIEFLY :
34 Videos
- GASEOUS STATEBOOK - SURA PUBLICATIONCHAPTER - GASEOUS STATEEXERCISE - ADDITIONAL QUESTIONS (ADDITIONL CHOOSE THE CORRECT ANSWER)
60 Videos
- ENVIRONMENTAL CHEMISTRY BOOK - SURA PUBLICATIONCHAPTER - ENVIRONMENTAL CHEMISTRY EXERCISE - 5 MARKS
1 Videos
- GOVT. MODEL QUESTION PAPER - IBOOK - SURA PUBLICATIONCHAPTER - GOVT. MODEL QUESTION PAPER - IEXERCISE - PART-D
16 Videos
Similar Questions
Knowledge Check
Which of the following diagram correctly describes the behaviour of a fixed mass of an ideal gas ? (T is measured in K)
A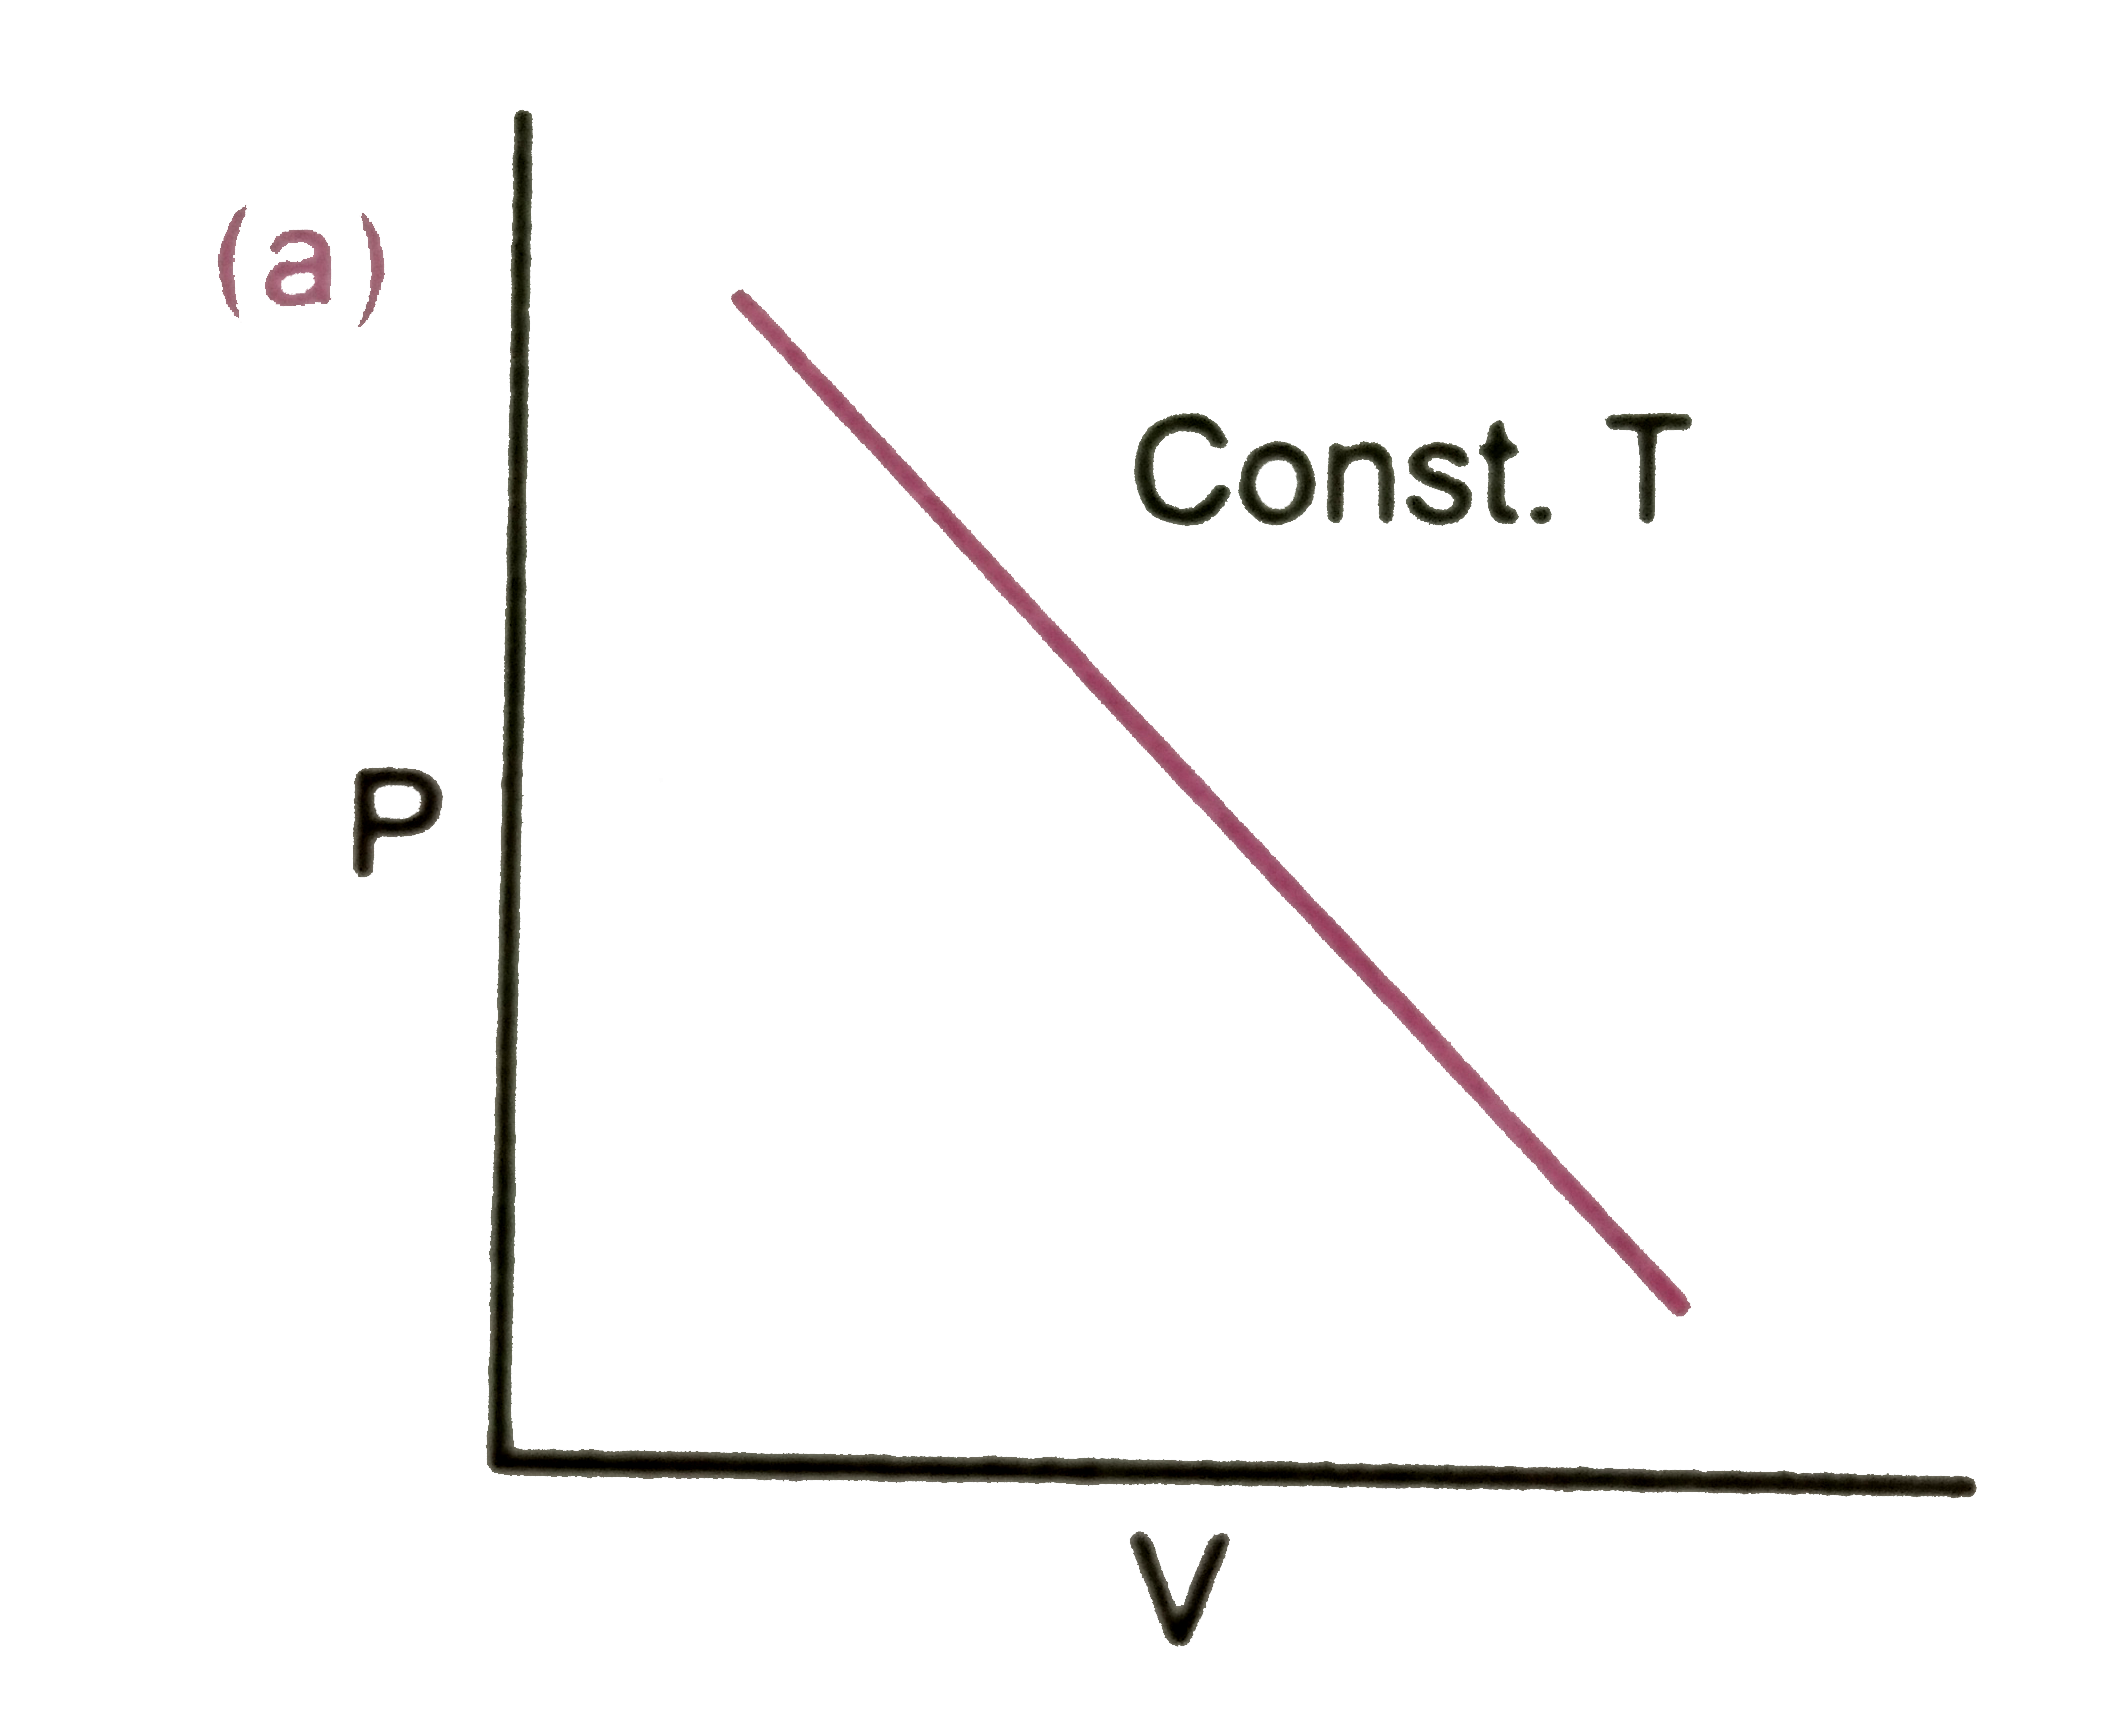 B
B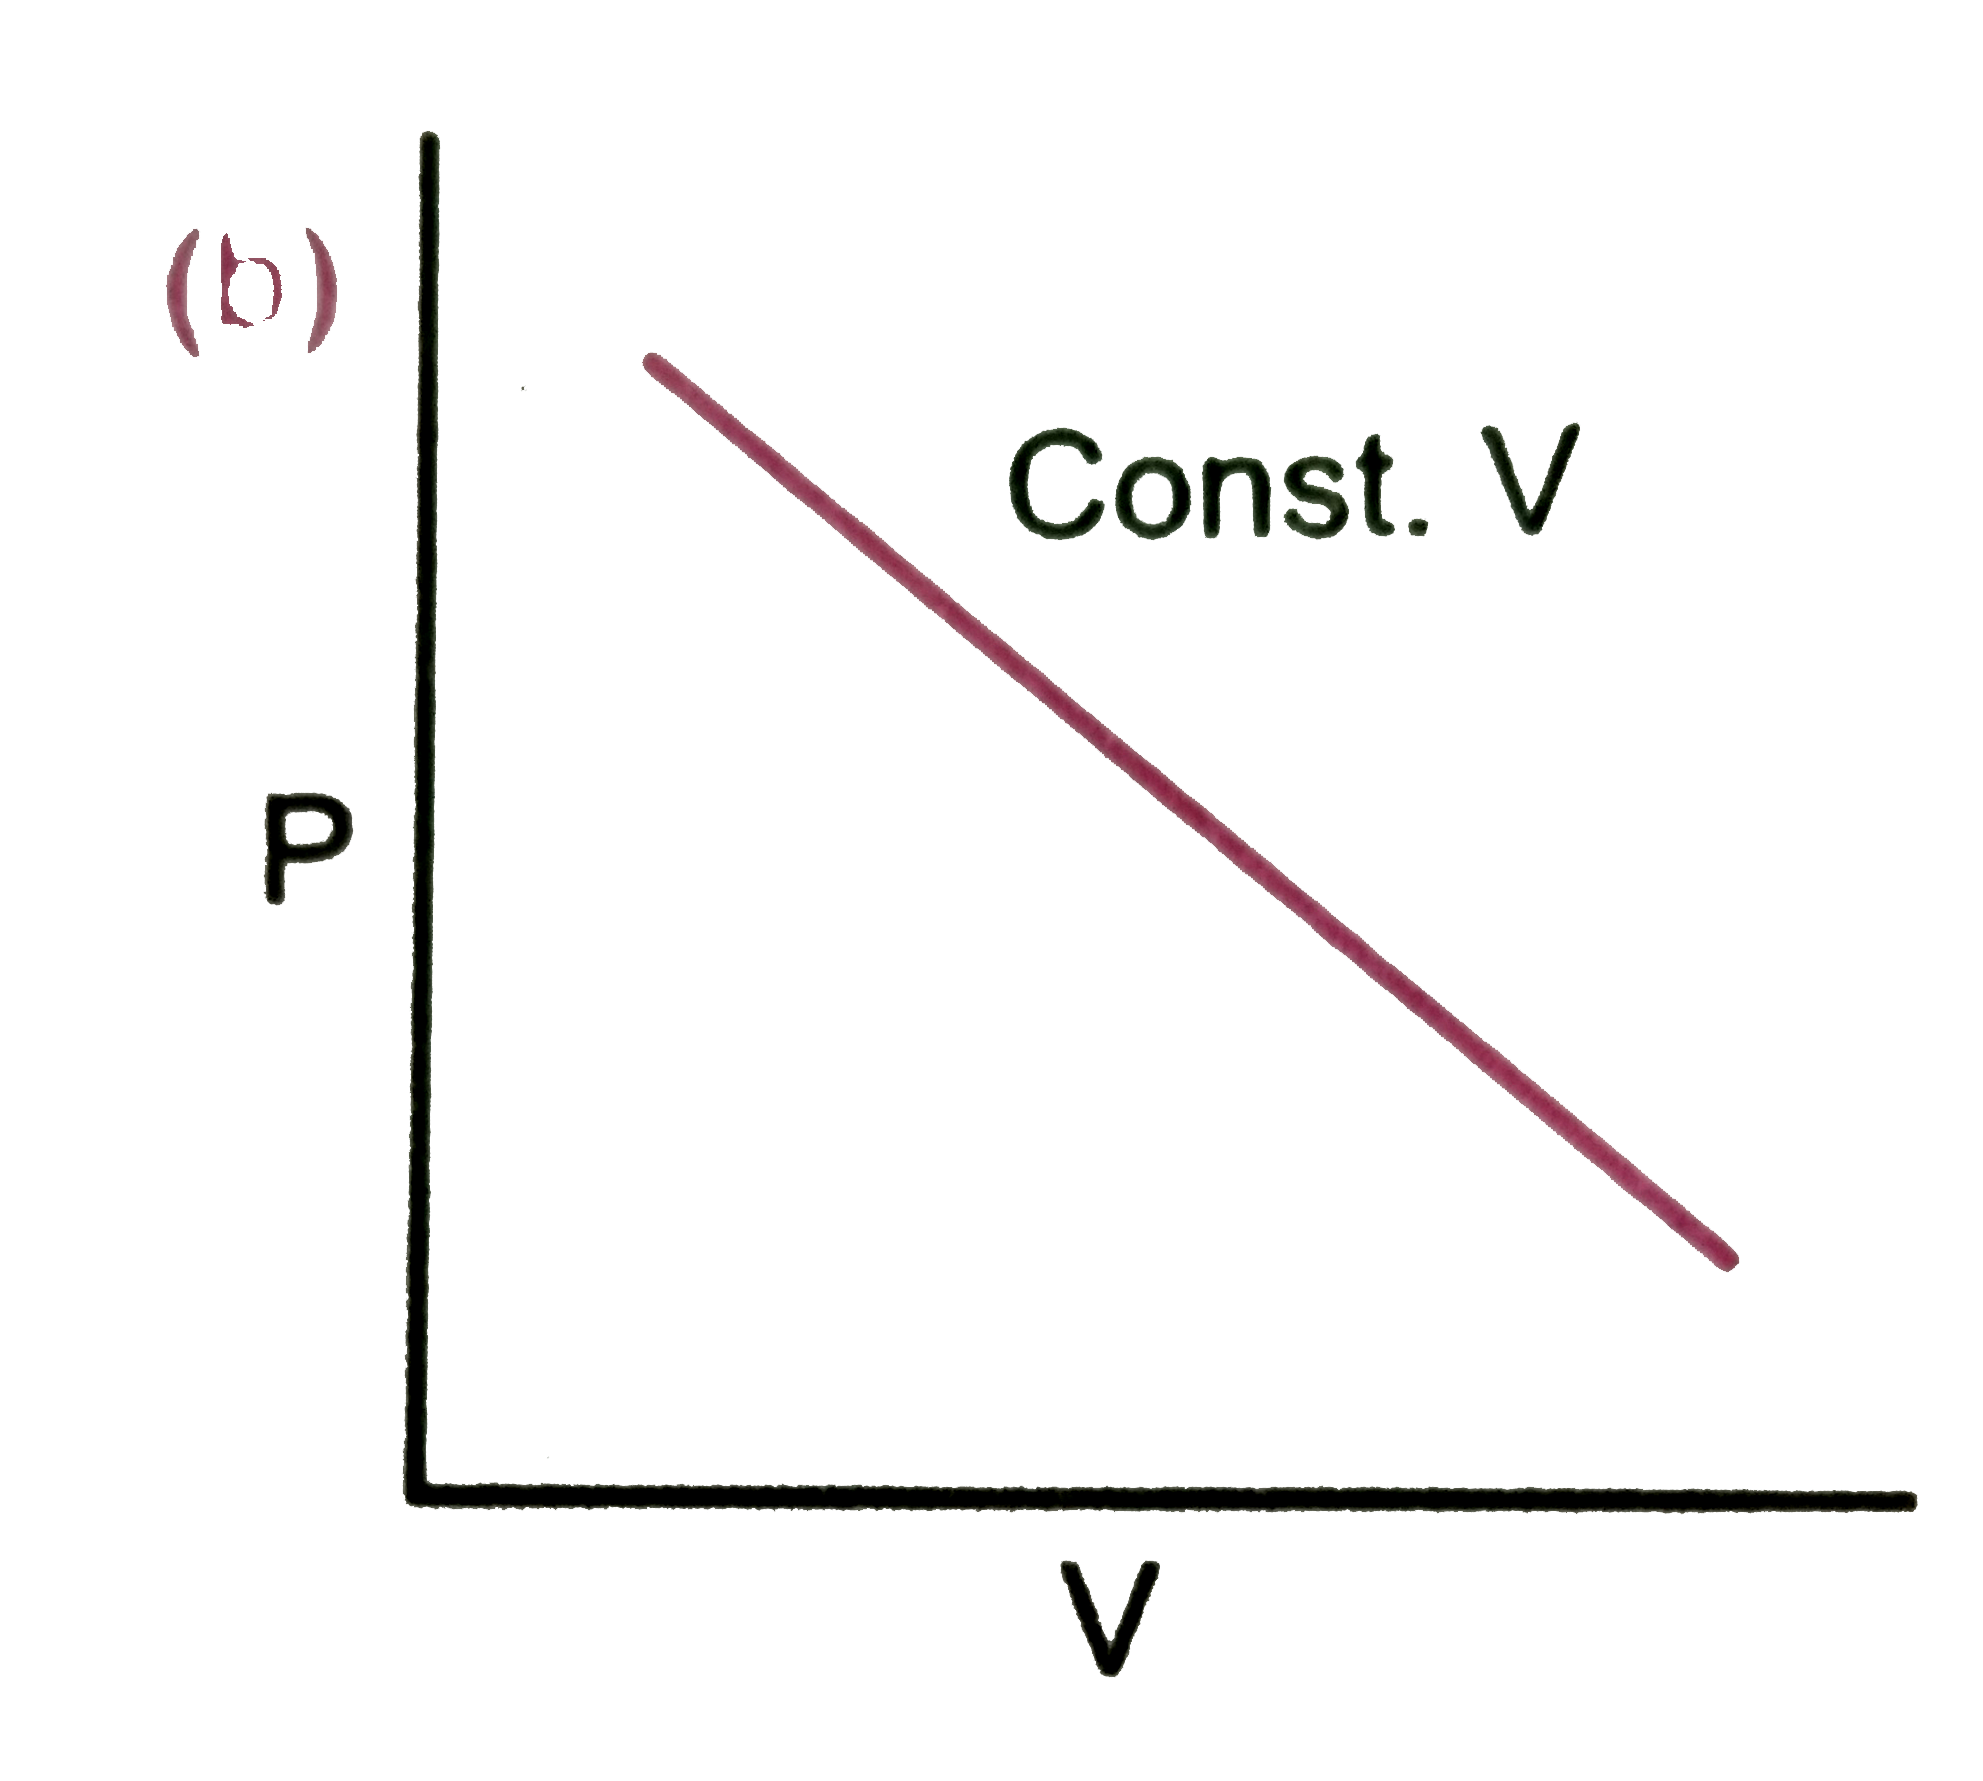 C
C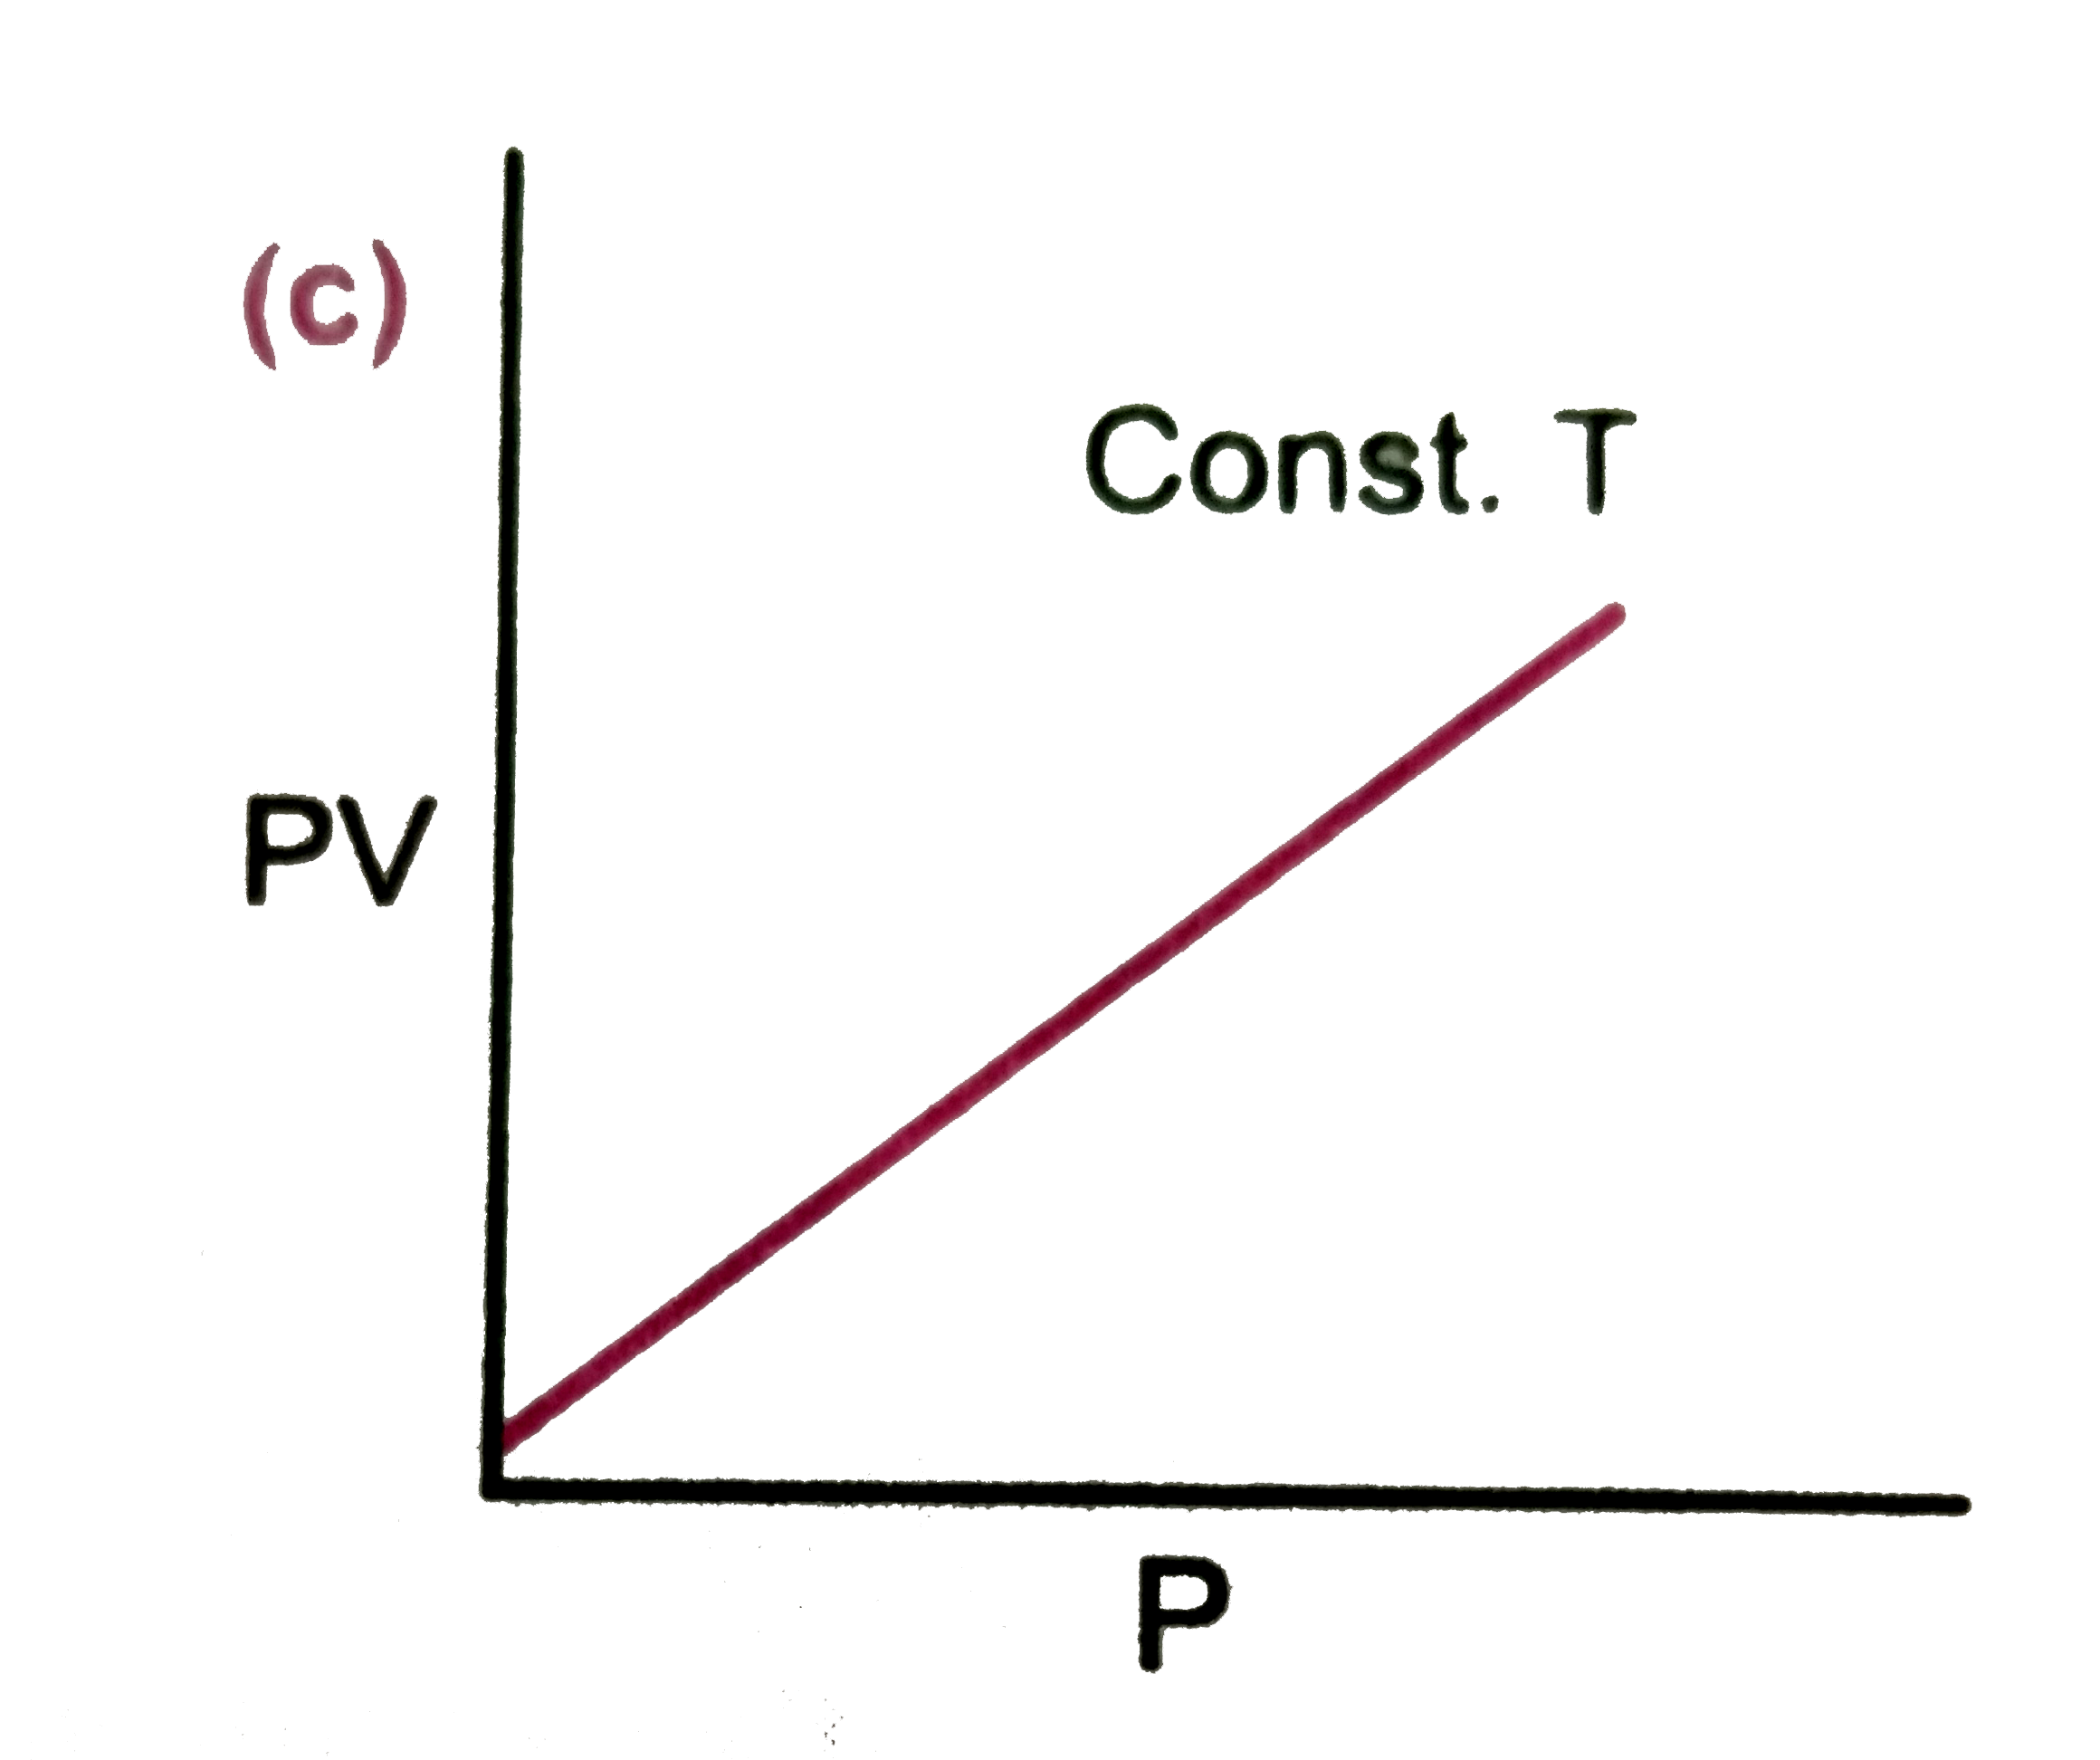 D
D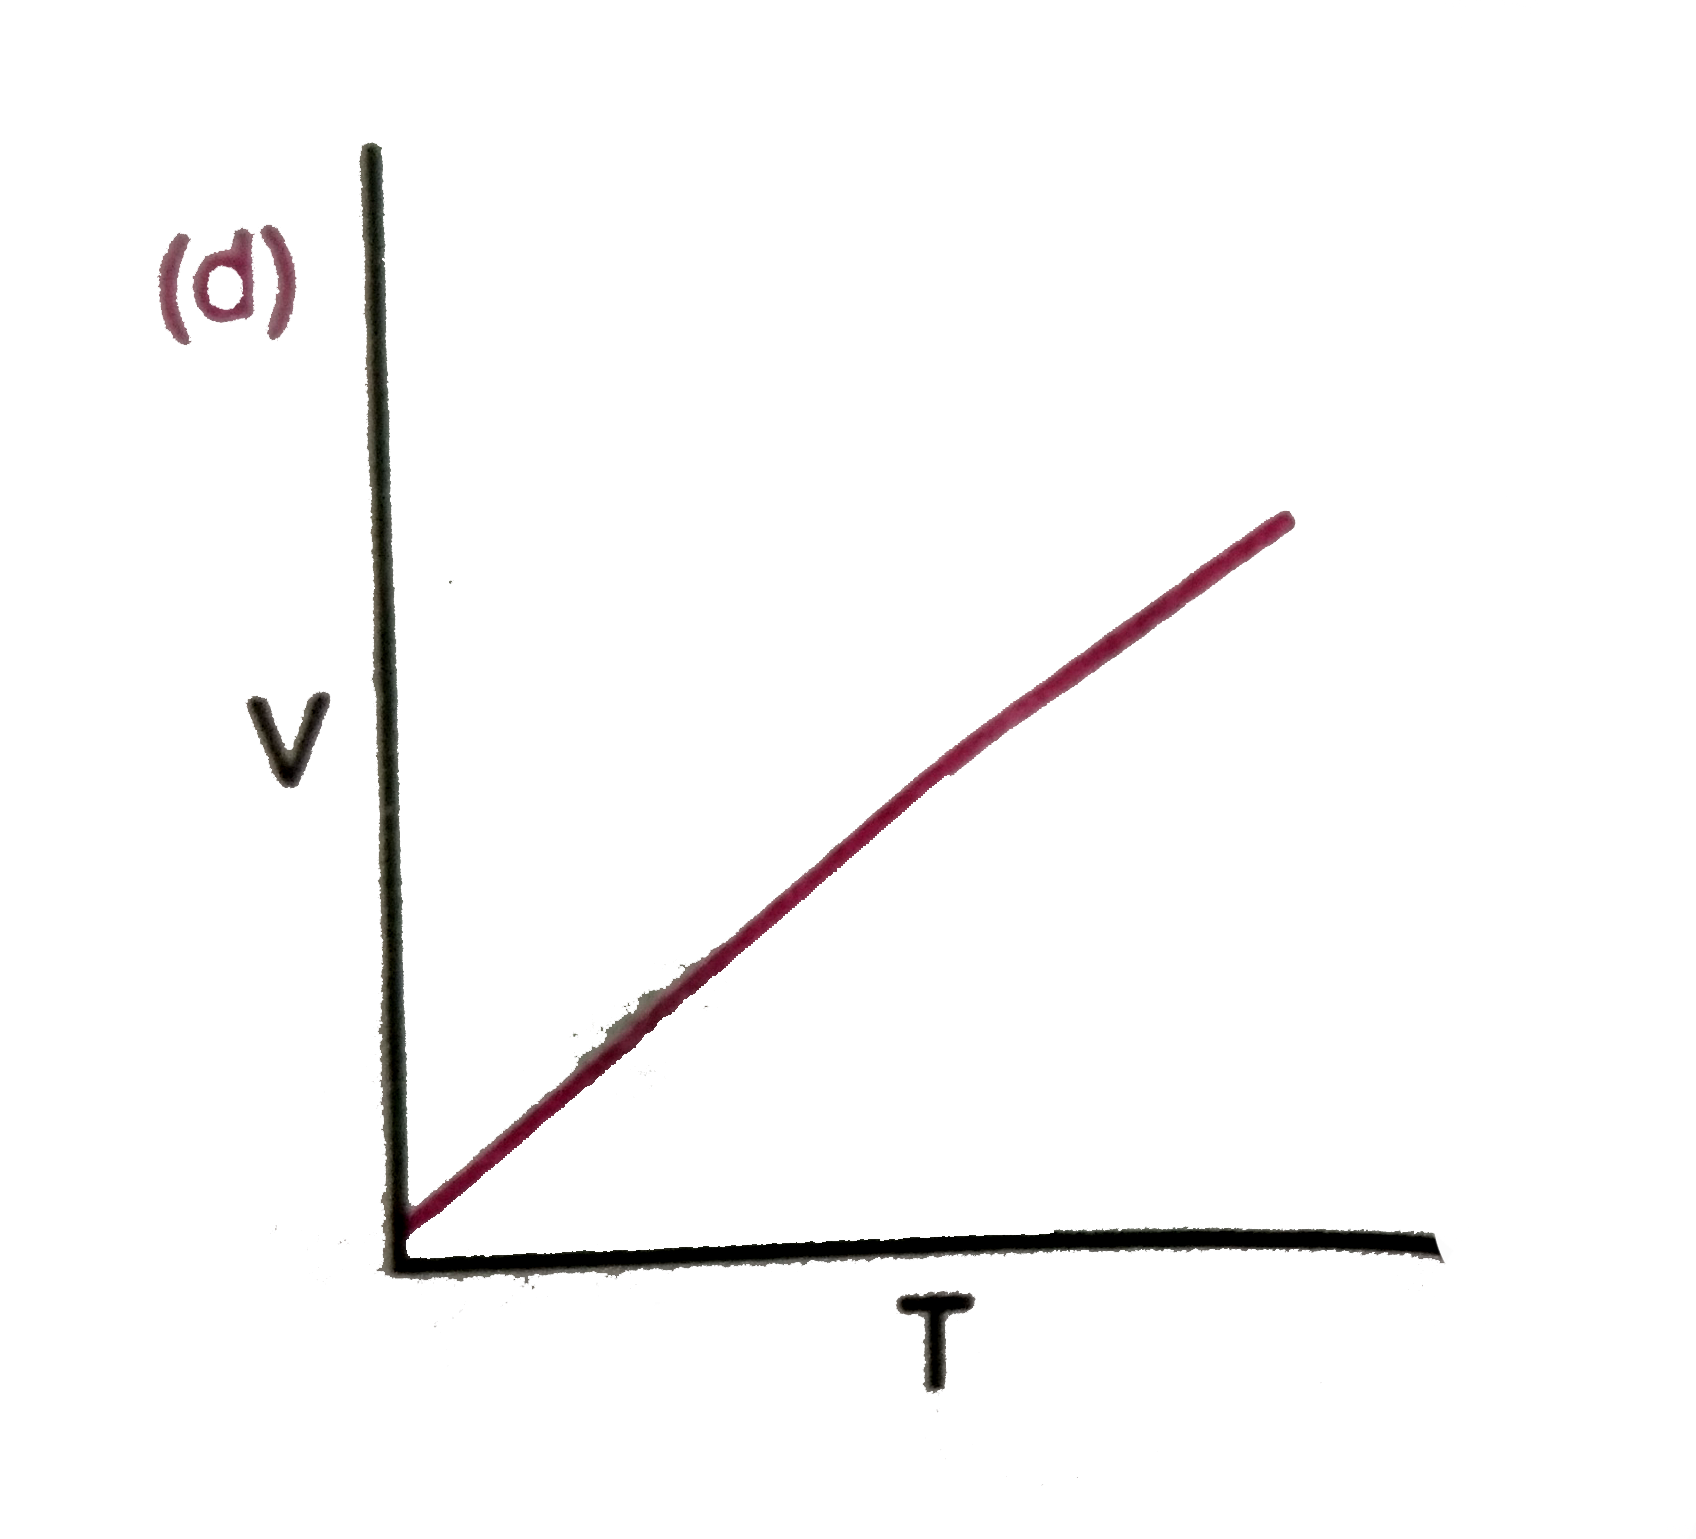
Which of the following diagrams correctly decribes the behavior of a fixed mass of an ideal gas ? (T is measured in K)
A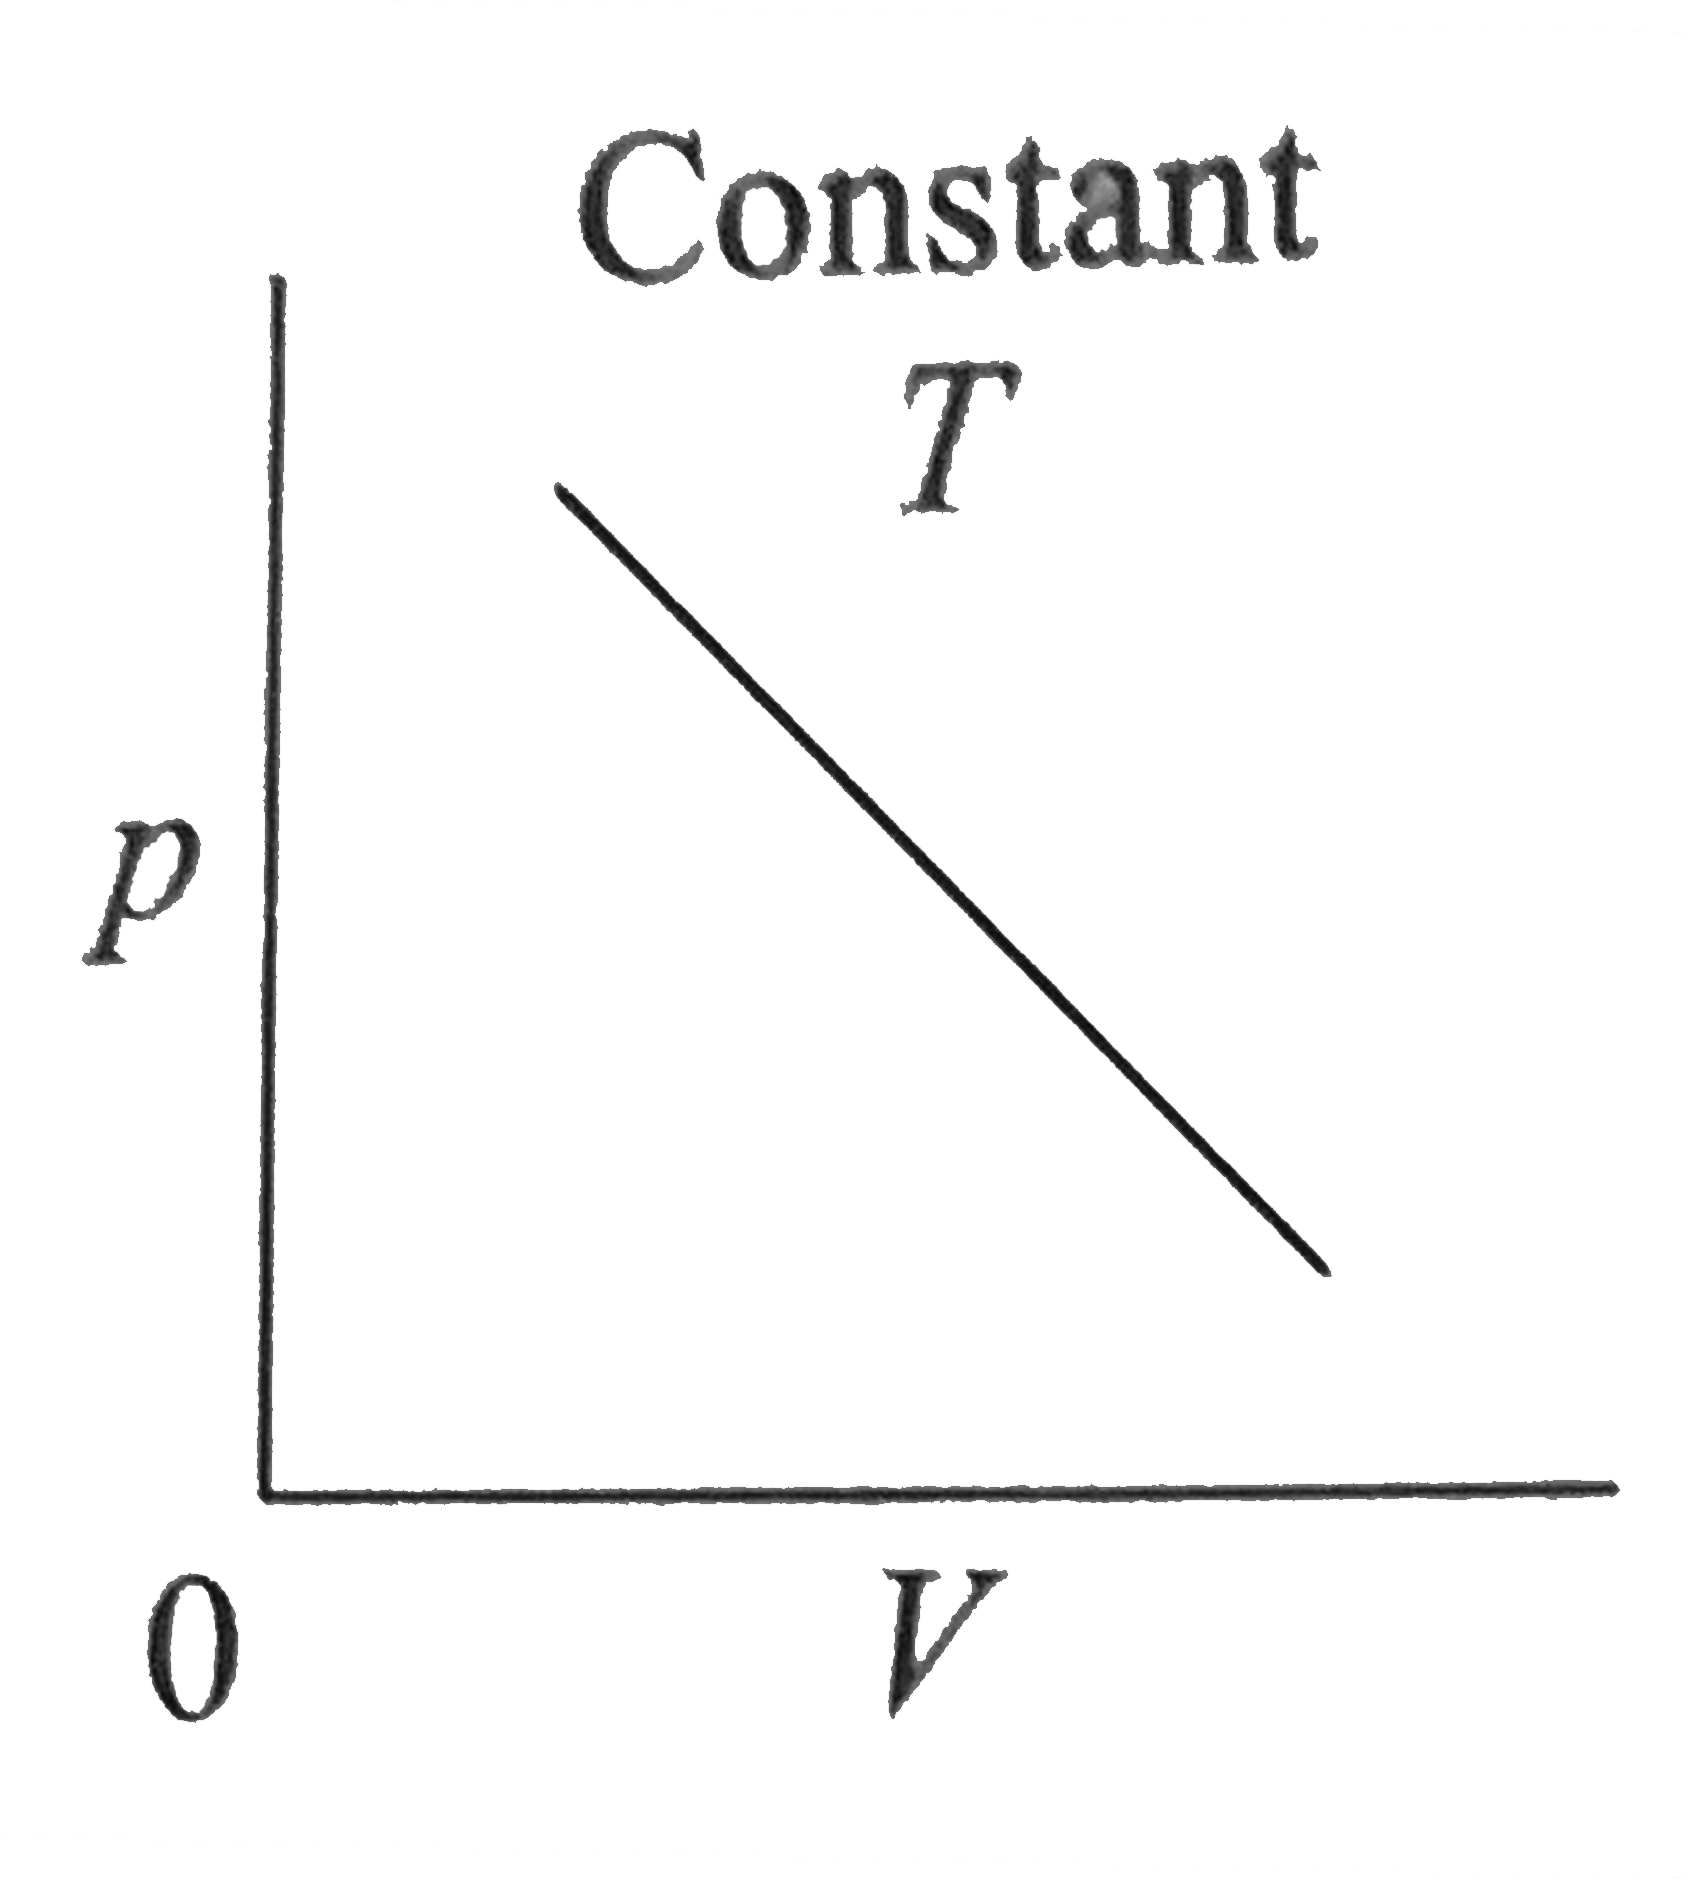 B
B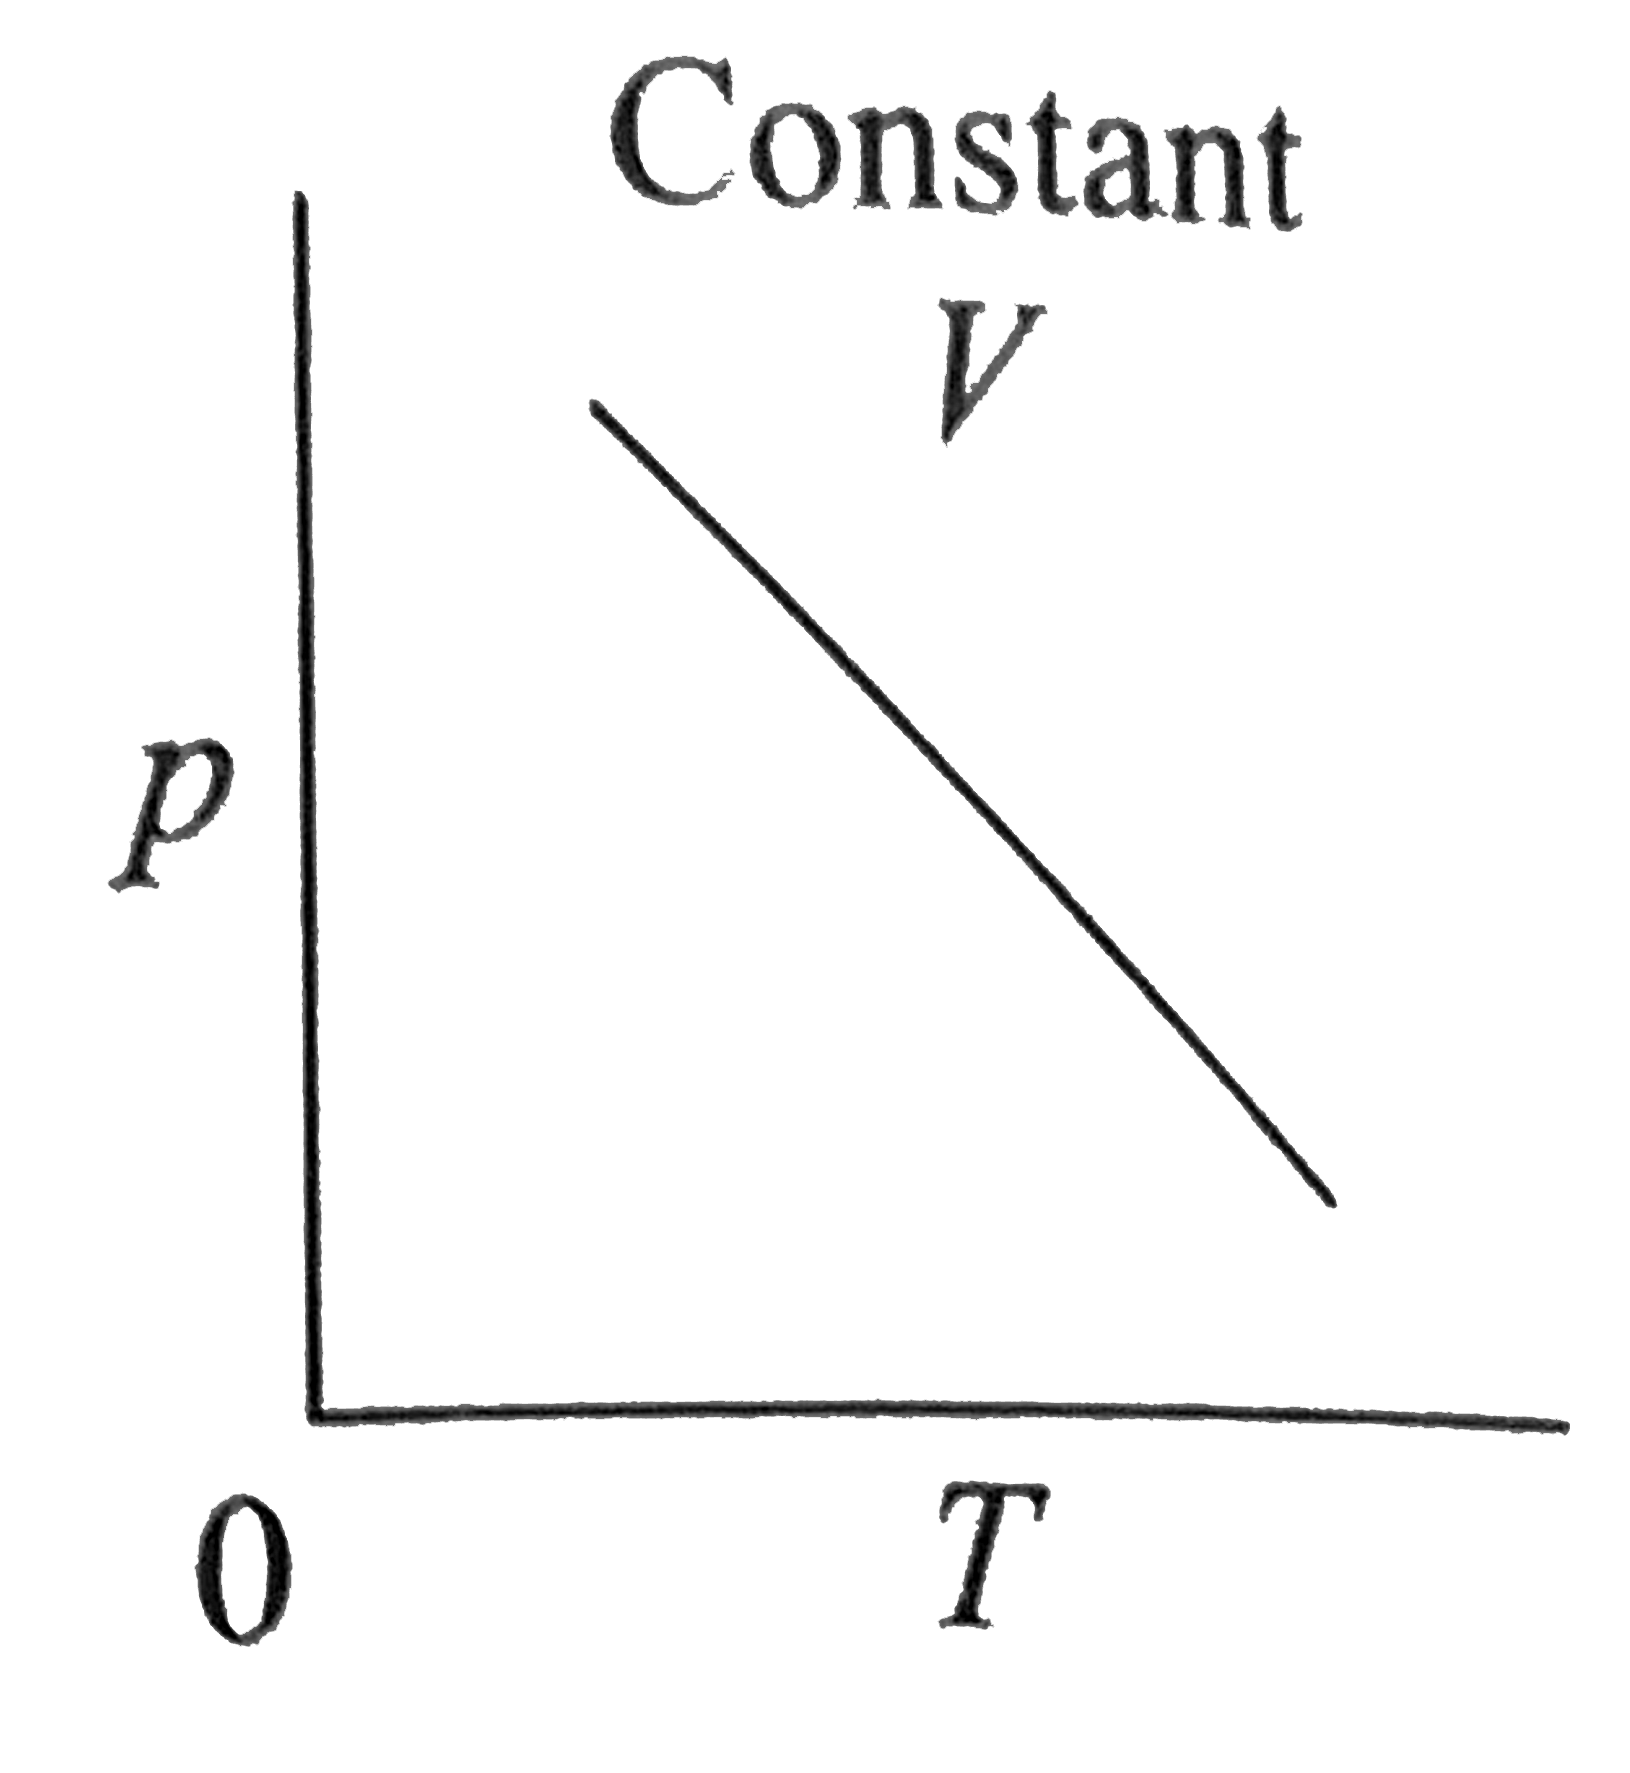 C
C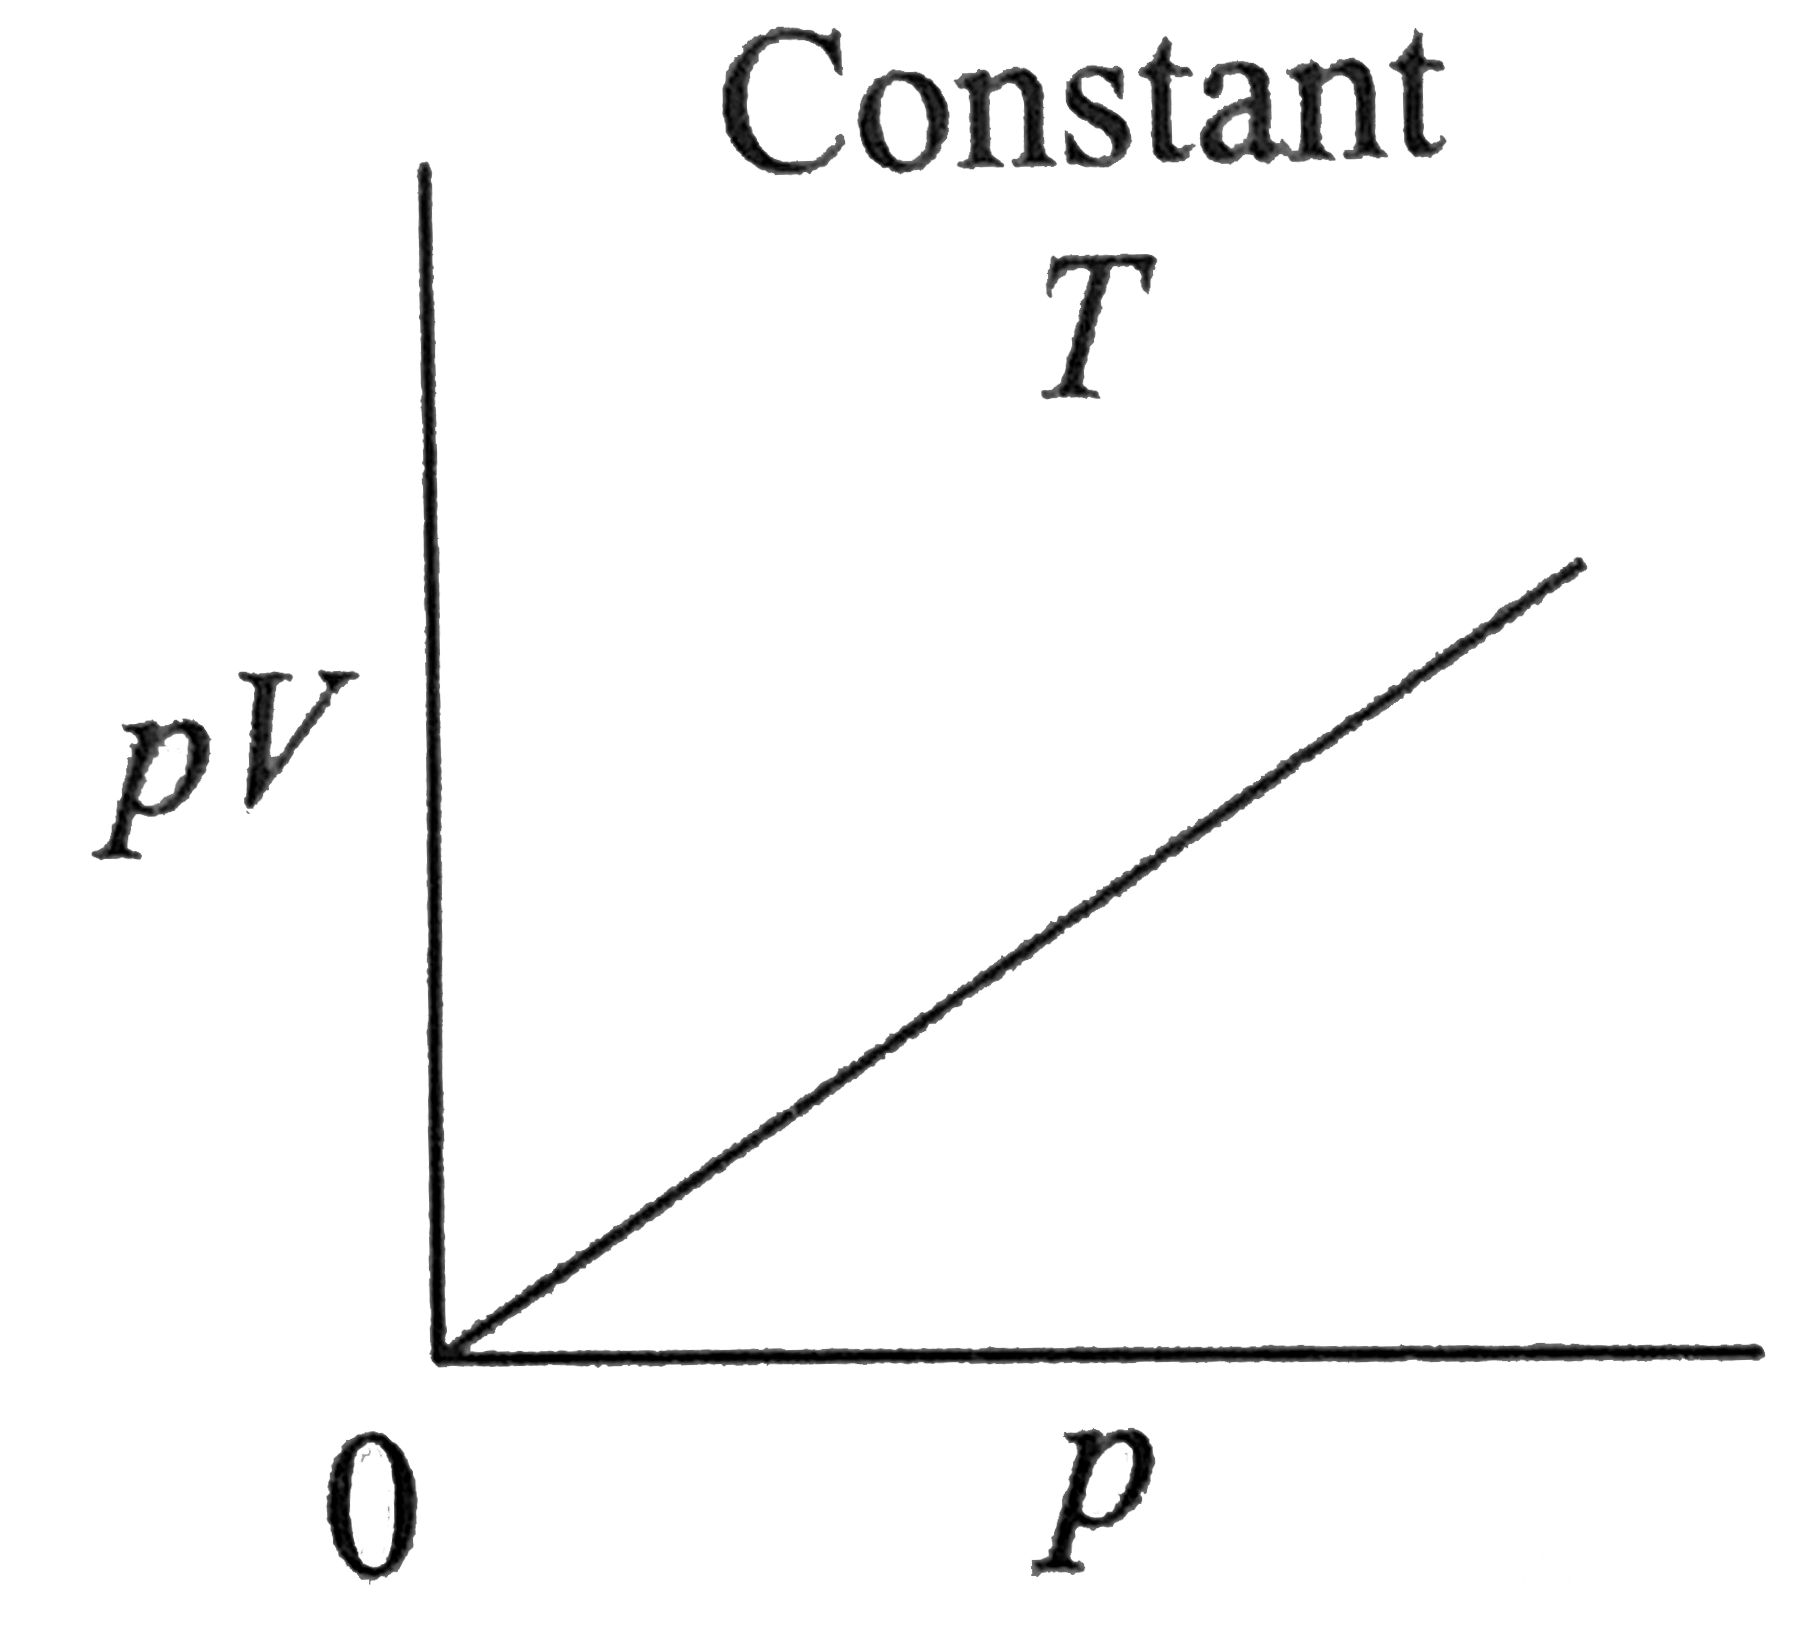 D
D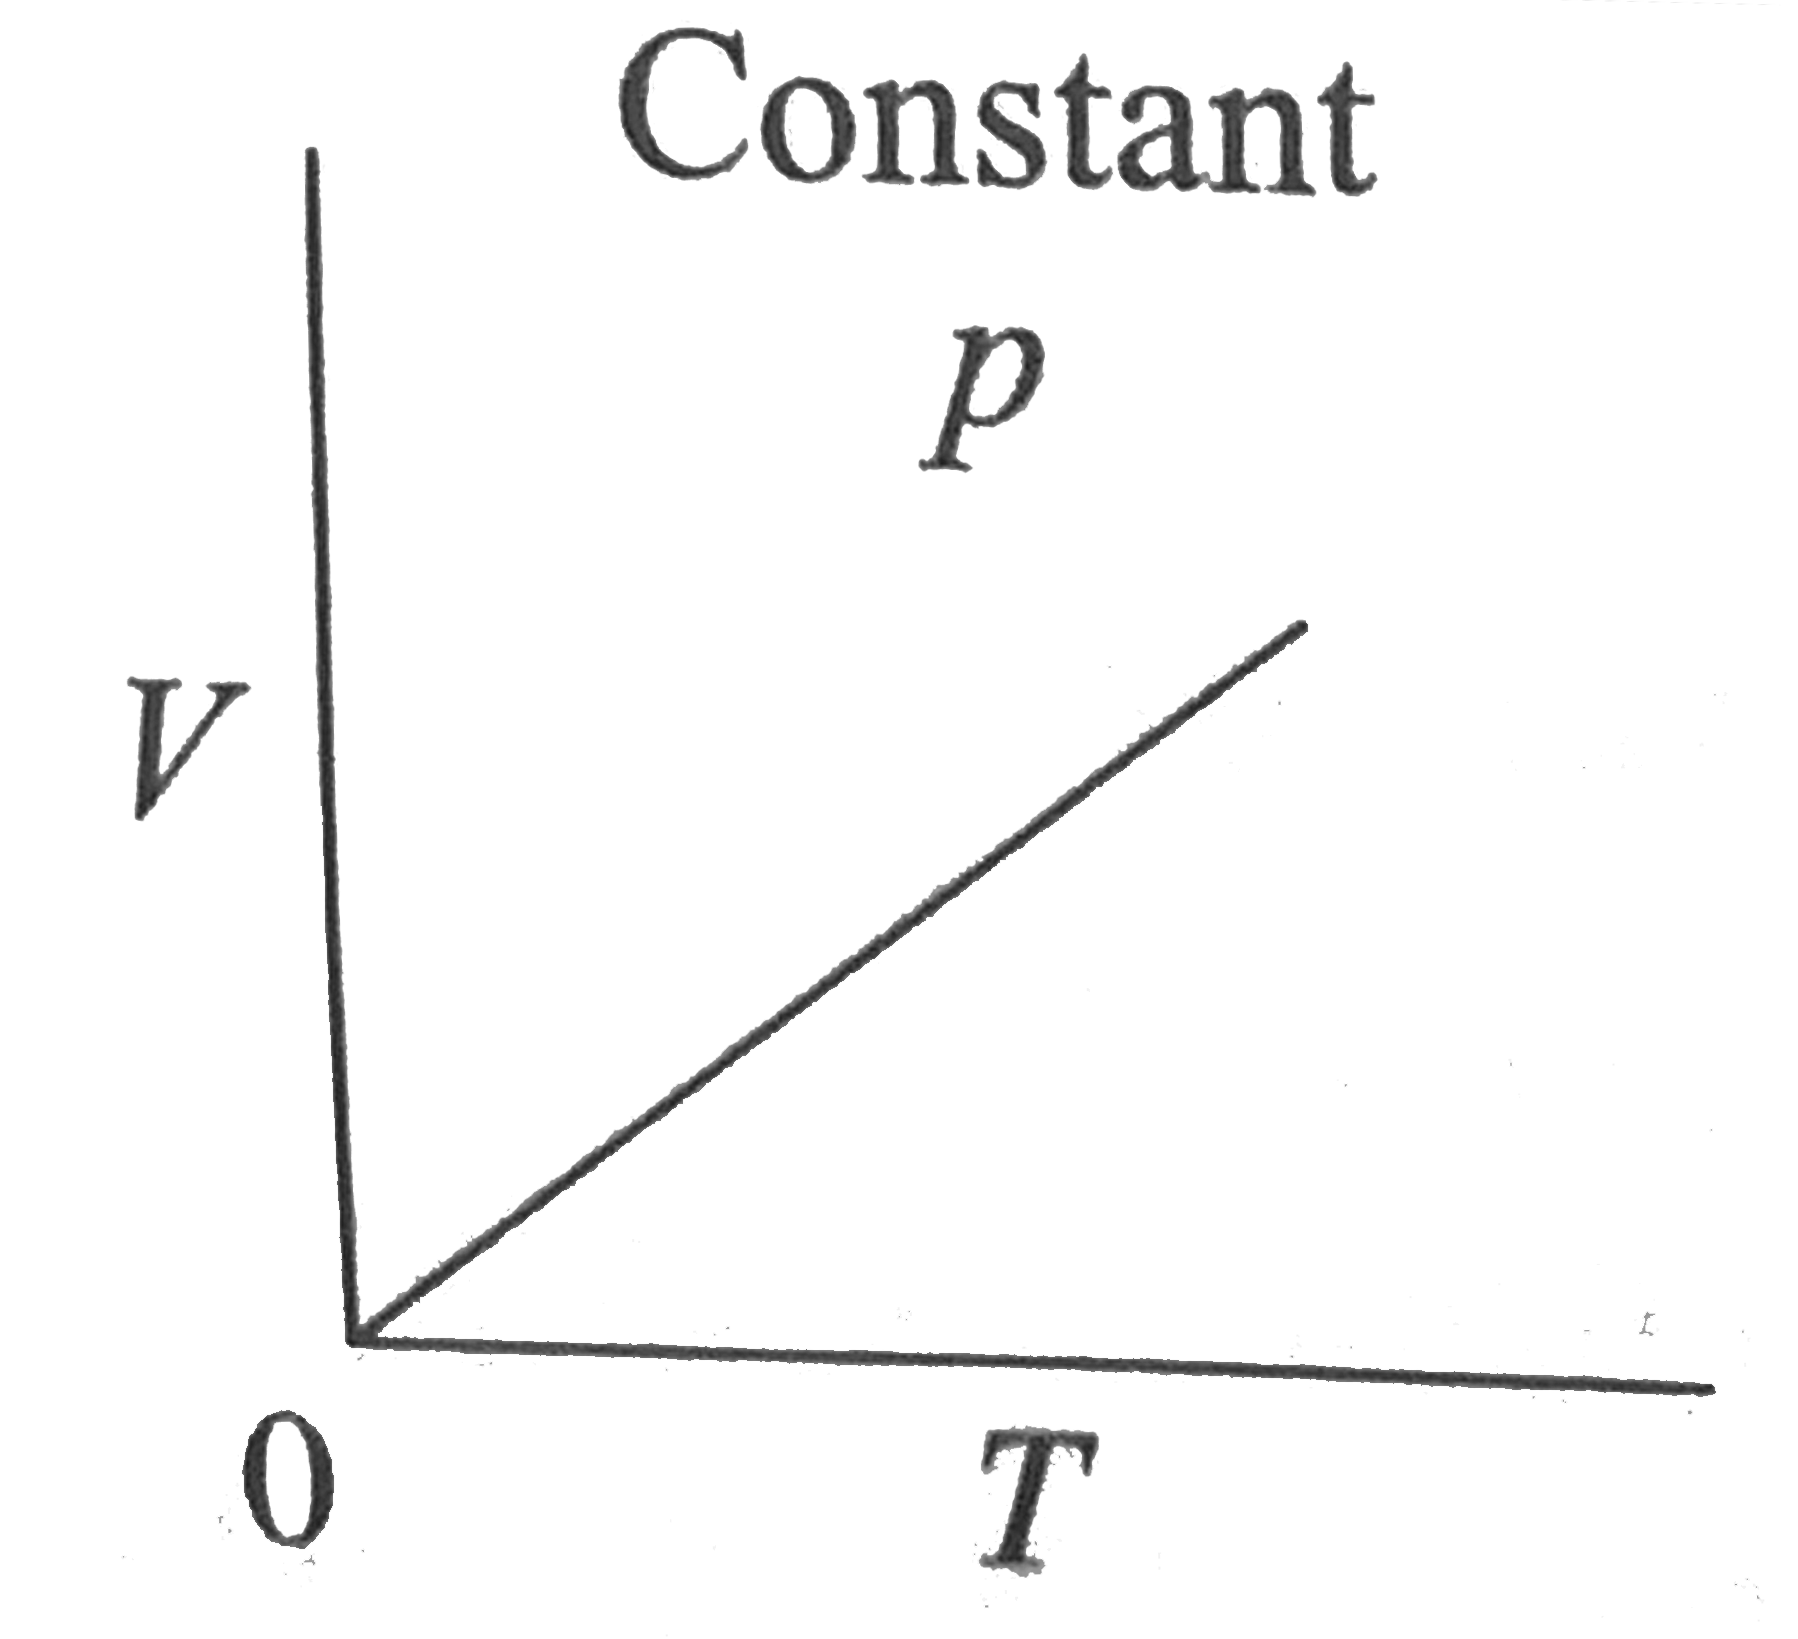
Which of the following diagrams, Fig. depicts ideal gas behaviour ?
A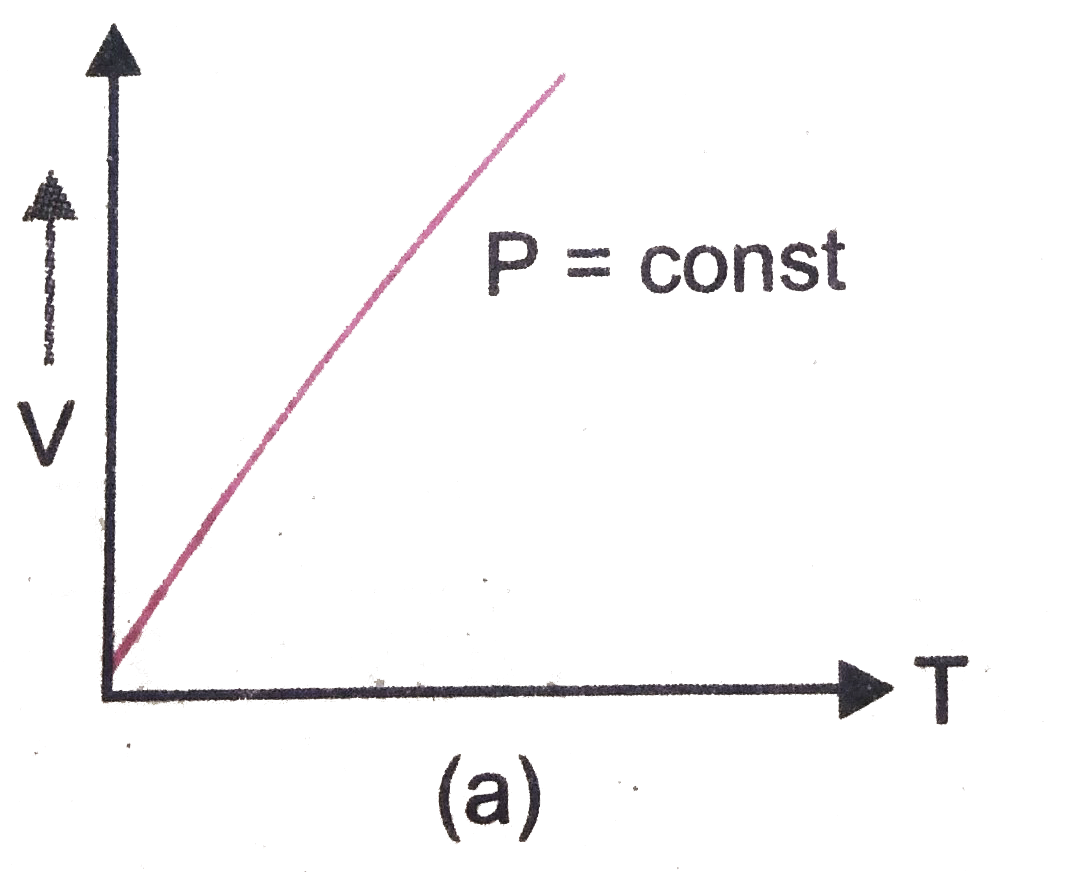 B
B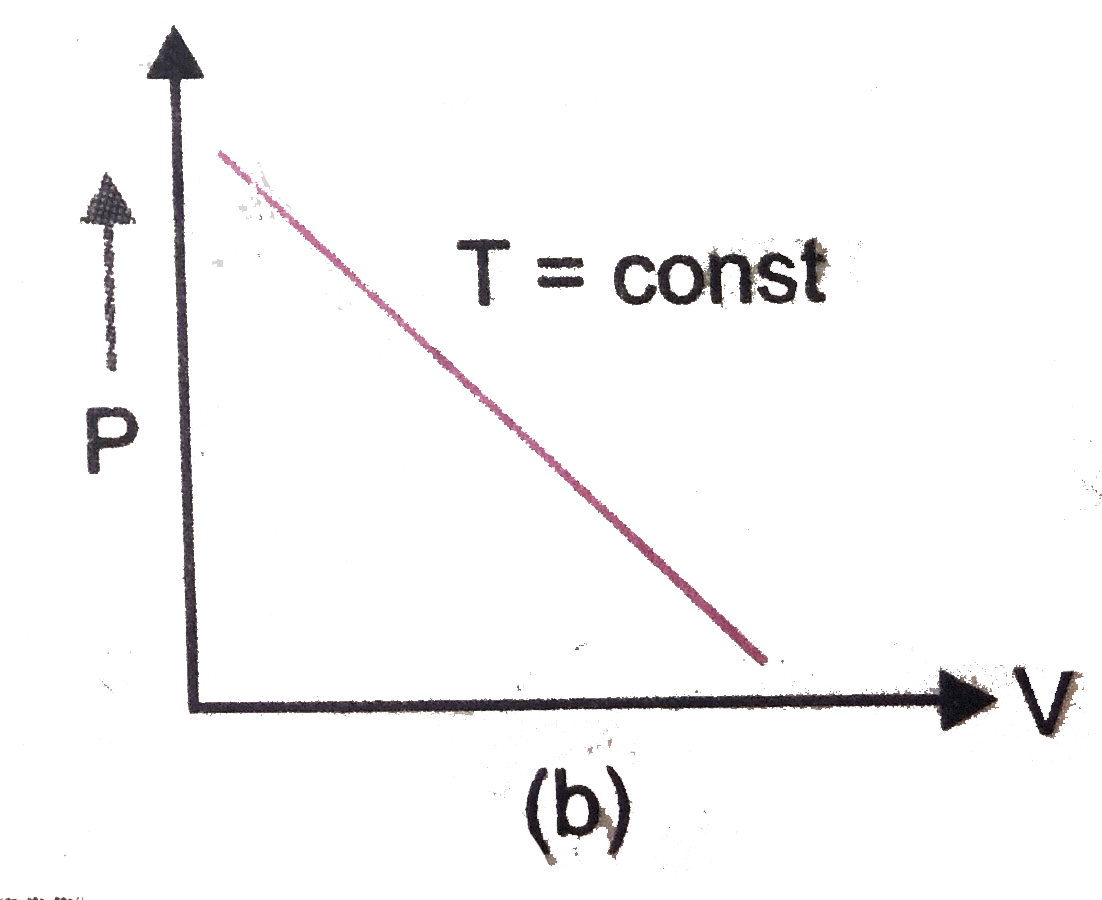 C
C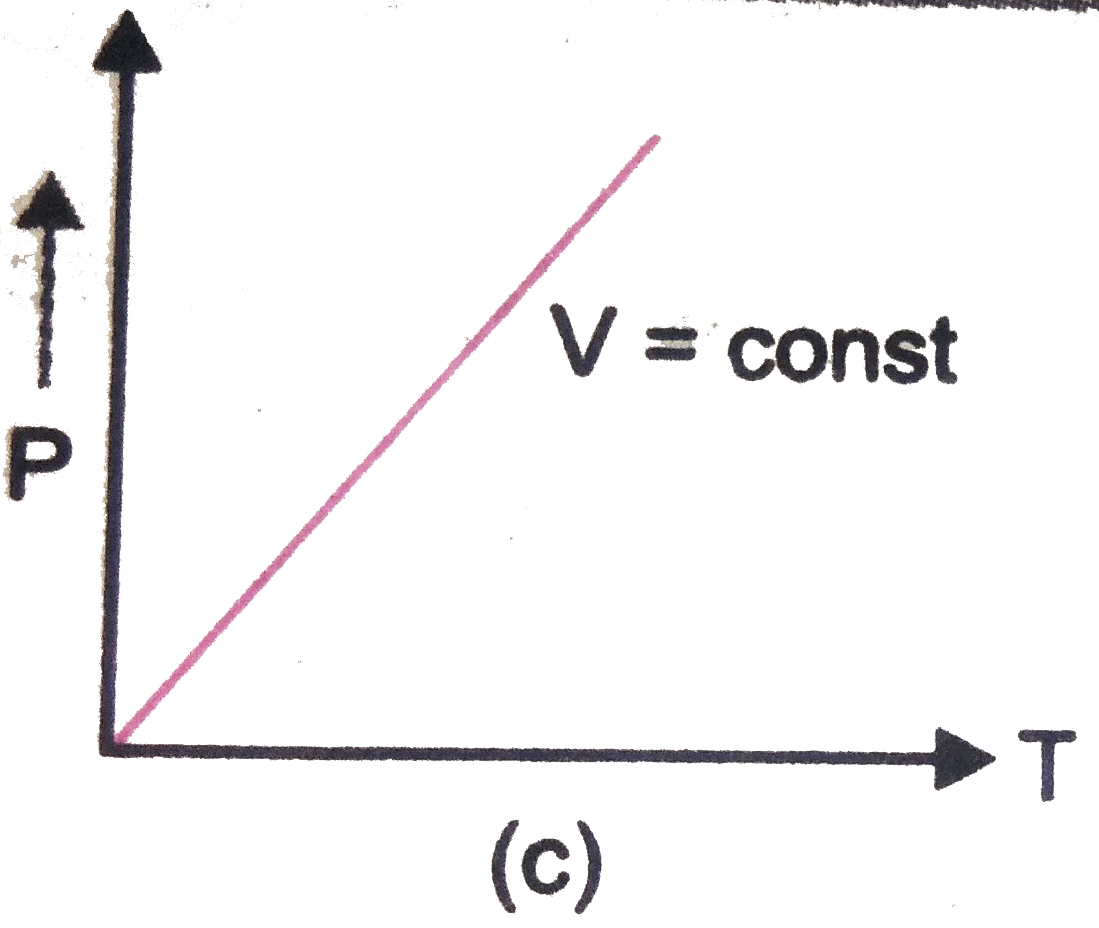 D
D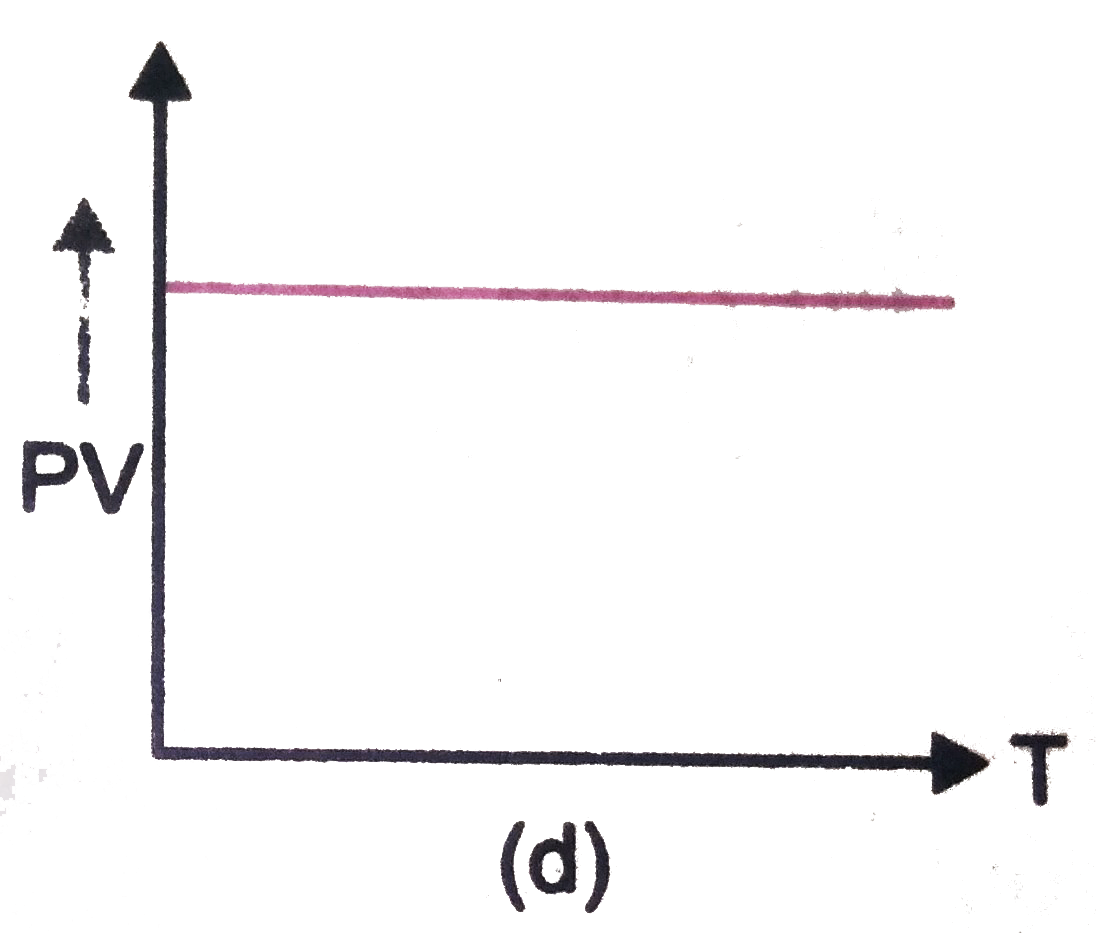
Which of the following diagrams (figure) depicts ideal gas behaviour?
View SolutionWhich of the following graphs represent the behaviour of an ideal gas ?
View SolutionWhich of the following graphs represent the behaviour of an ideal gas ?
View SolutionWhich one of the following graphs correctly gives the ideal gas behaviour ?
View SolutionWhich of the following demonstrates non-ideal behaviour of a gas?
View Solution

