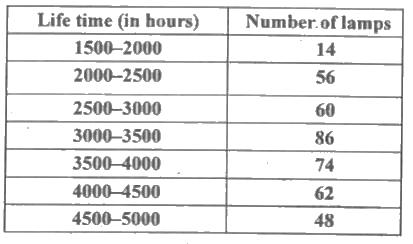
The following table gives the distribution of the life time of 400 neon lamps :

Find the median life time of a lamp Solution in Kannada
Step by step video & image solution for The following table gives the distribution of the life time of 400 neon lamps : Find the median life time of a lamp by Maths experts to help you in doubts & scoring excellent marks in Class 10 exams.
Updated on:21/07/2023Topper's Solved these Questions
- STATISTICS BOOK - SUBHASH PUBLICATIONCHAPTER - STATISTICS EXERCISE - EXERCISE 13.4
3 Videos
- STATISTICS BOOK - SUBHASH PUBLICATIONCHAPTER - STATISTICS EXERCISE - EXERCISE 13.2
6 Videos
- SOME APPLICATIONS OF TRIGONOMETRY BOOK - SUBHASH PUBLICATIONCHAPTER - SOME APPLICATIONS OF TRIGONOMETRY EXERCISE - EXERCISE 9.1
16 Videos
- SURFACE AREAS AND VOLUMES BOOK - SUBHASH PUBLICATIONCHAPTER - SURFACE AREAS AND VOLUMES EXERCISE - EXERCISE 15.5
4 Videos
Similar Questions
The following distribution gives the daily income of 50 workers of a factory.

Convert the distribution above to a less than type cumulative frequency distribution, and draw its ogive.
View SolutionThe following table shows the ages of the patients admitted in a hospital during a year:

Find the mode and the mean of the data given above. Compare and interpret the two measures of central tendency.
View SolutionA circus artist is climbing a 20m long rope, which is tightly stretched and tied from the top of a vertical pole to the ground.Find the height of the pole, if the angle made by the rope with the ground levelis 30∘ ( see Figure)
View SolutionA copper wire, 3mm in diameter , is wound about a cylinder whose length is 12cm, and diameter 10cm, so as to cover the curved surface of the cylinder . Find the length and mass of the wire, assuming the density of copper to be 8.88gpercm3
View SolutionThe following table gives the distribution of the life time of 400 neon lamps Find the median life of a lamp.
View SolutionWhich of the following are correct chain isomers of butane ? (i)
View SolutionDetermine the point of symmetry of a regular hexagon.
View SolutionDtermine the images of the following figure about the given line :
View SolutionMatch the following Column A to Column B

View SolutionMatch the following Column A to Column B

View SolutionMatch the following Column A to Column B

View SolutionFind the area of the figure given below.

View SolutionThe inequation represented by the graph given below is :
View SolutionThe inequation that best describes the graph given below is _________
View SolutionThe inequation that best describes the following graph is _________
View Solution
