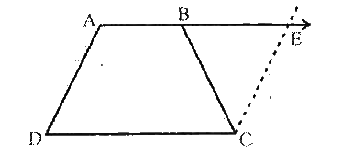
ABCD is a trapezium in which AB|C|D and AD = BC. Show that
A=B
 Solution in Kannada
Step by step video & image solution for ABCD is a trapezium in which AB abs CD and AD = BC. Show that A=B by Maths experts to help you in doubts & scoring excellent marks in Class 9 exams.
Updated on:21/07/2023Topper's Solved these Questions
Similar Questions
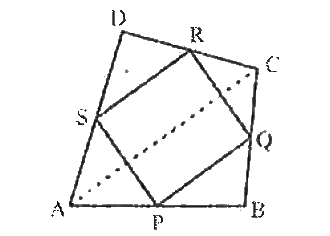
ABCD is a quadrilateral in which P, Q, R and S are mid- points of the sides AB, BC, CD and DA. AC is a diagonal. Show that :
SR|A|C and SR=12AC

View SolutionIn a cricket math , a batswoman hits a boundary 6 times out of 30 balls she plays . Find the probability that the did not hit a boundary.
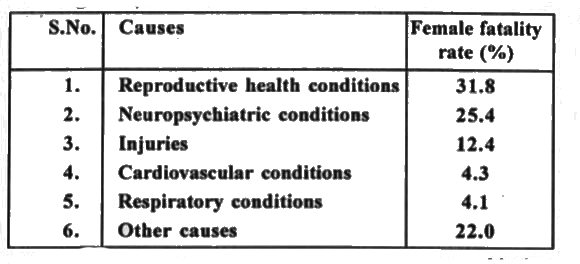
View SolutionA survey conducted by an organisation for the cause of illness nad death among the women between the ages 15-44 (in years) worldwide, found the following figures (in %) :

(ii) Which condition is the major cause of women's ill health and death worldwide ?
View SolutionIn the given figure (not to scale), O is the centre of the circle. A,B,C and D are concyclic and AB=CD . If /_MON =120^(@) , then find /_ OPN .
View SolutionWhich of the following are correct chain isomers of butane ? (i)
View SolutionDetermine the point of symmetry of a regular hexagon.
View SolutionDtermine the images of the following figure about the given line :
View SolutionIn the figure above (not to scale), ¯¯¯¯¯¯AB⊥¯¯¯¯¯¯CDandAD is the bisector of ∠BAE.AB=3cm and AC=5cm. Find CD.
View SolutionIn the following figure (not to scale) , ABCD is an isosecles trapezium. overline(AB)||overline(CD), AB=9cm and CD =12 CM, AP:PD =BQ:QC=1:2 . Find PQ.
View SolutionMatch the following Column A to Column B

View SolutionMatch the following Column A to Column B

View SolutionMatch the following Column A to Column B

View SolutionThe inequation represented by the graph given below is :
View SolutionThe inequation that best describes the graph given below is _________
View SolutionThe inequation that best describes the following graph is _________
View SolutionWhich inequations represent the shaded region in the given figure
View Solution
