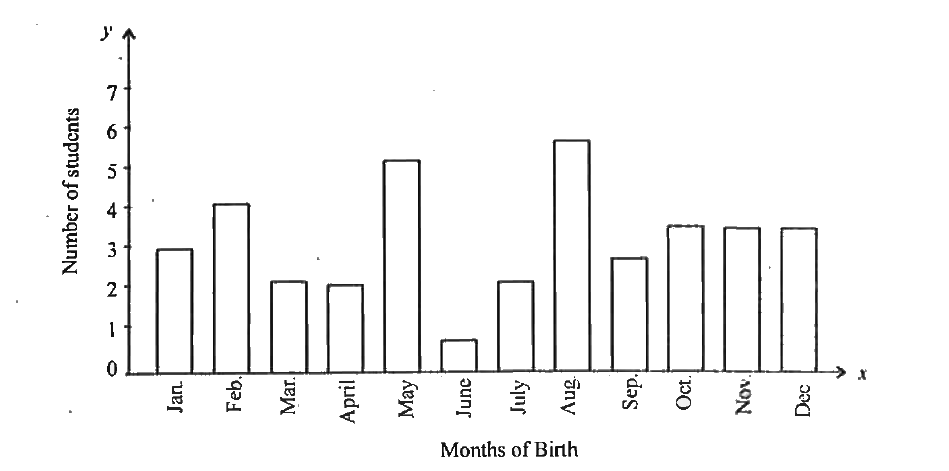
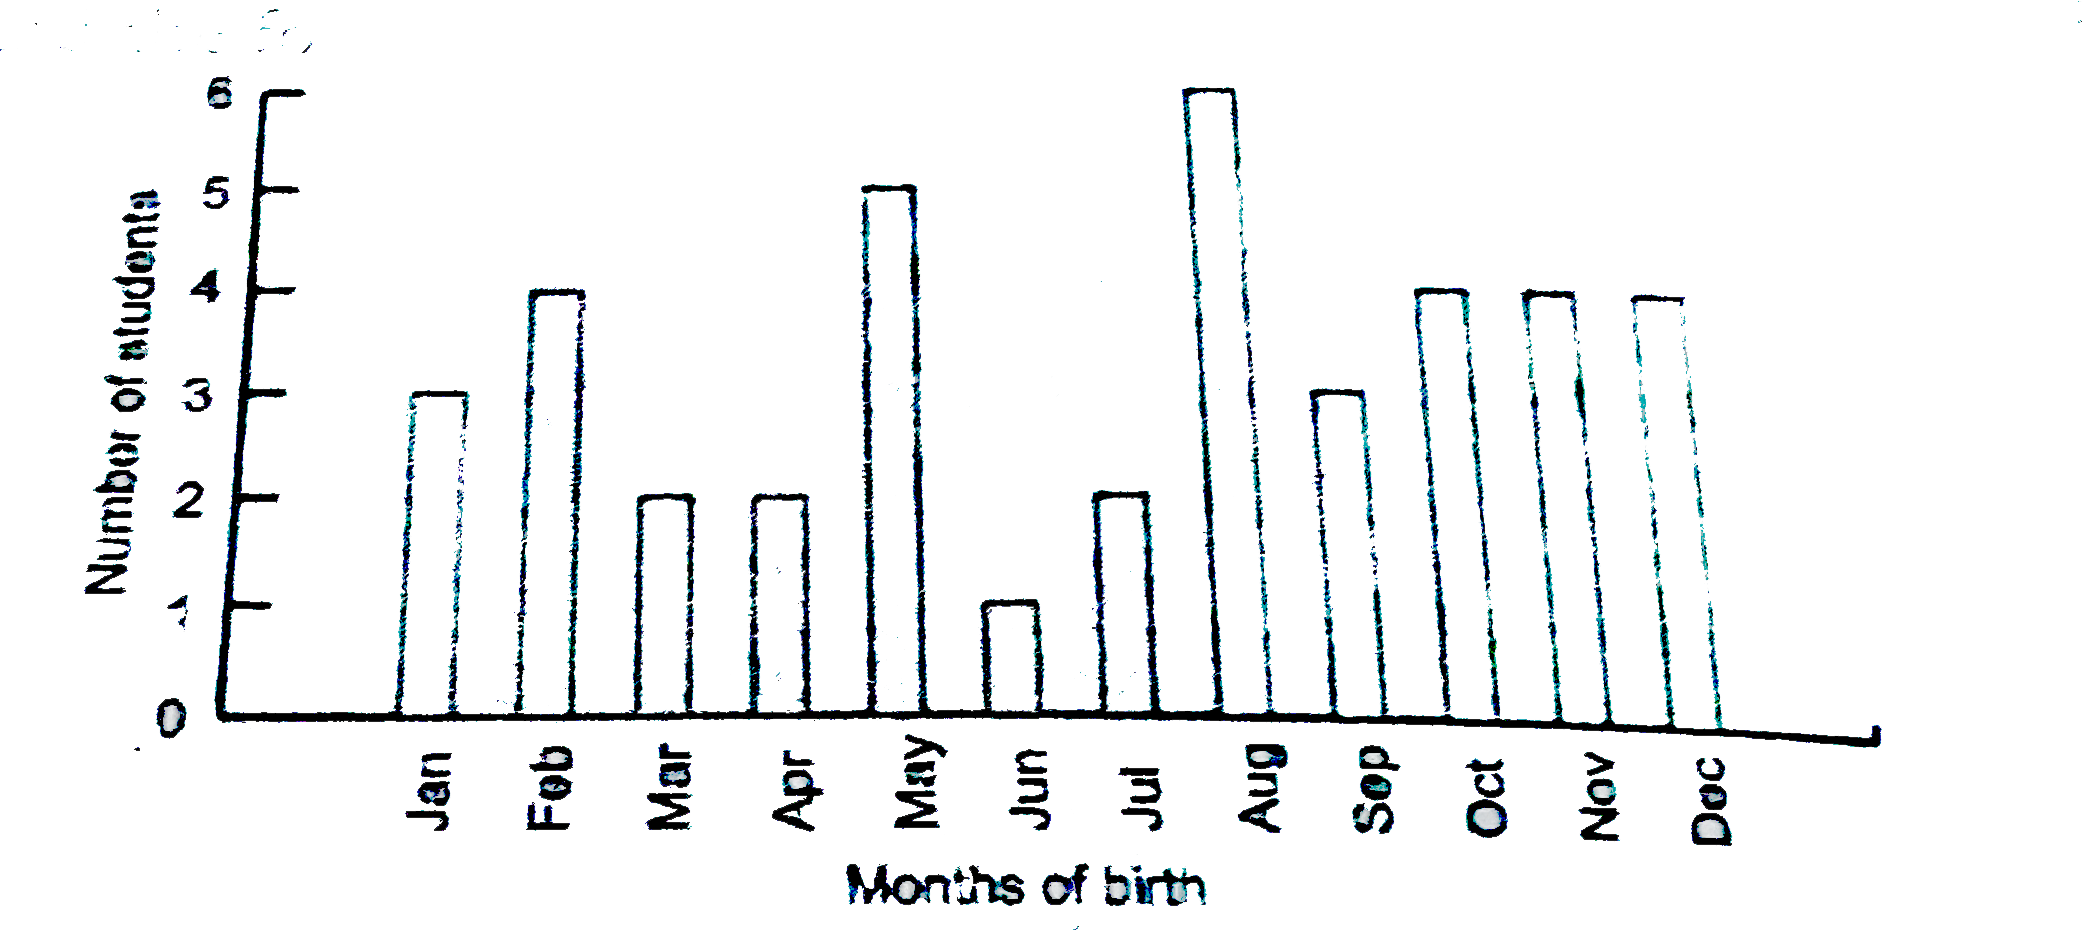
In a particular section of Class IX, 40 students were asked about the months of their birth and the following graph was prepared for the data so obtained .

The correct Answer is:320
Topper's Solved these Questions
Similar Questions
In a particular section of class IX, 40 students were asked about the month of their birth and the following graph was prepared for the data so obtained.

Find the probability that a student of the class was born in August.
View SolutionIn a class of 40 students, the marks obtained (out of 50) are as given below:

Draw a histogram to represent the given data.
View Solution
Knowledge Check
In a particular section of class IX, 40 students were asked about the month of their birth and the following graph was prepared for the data so obtained.

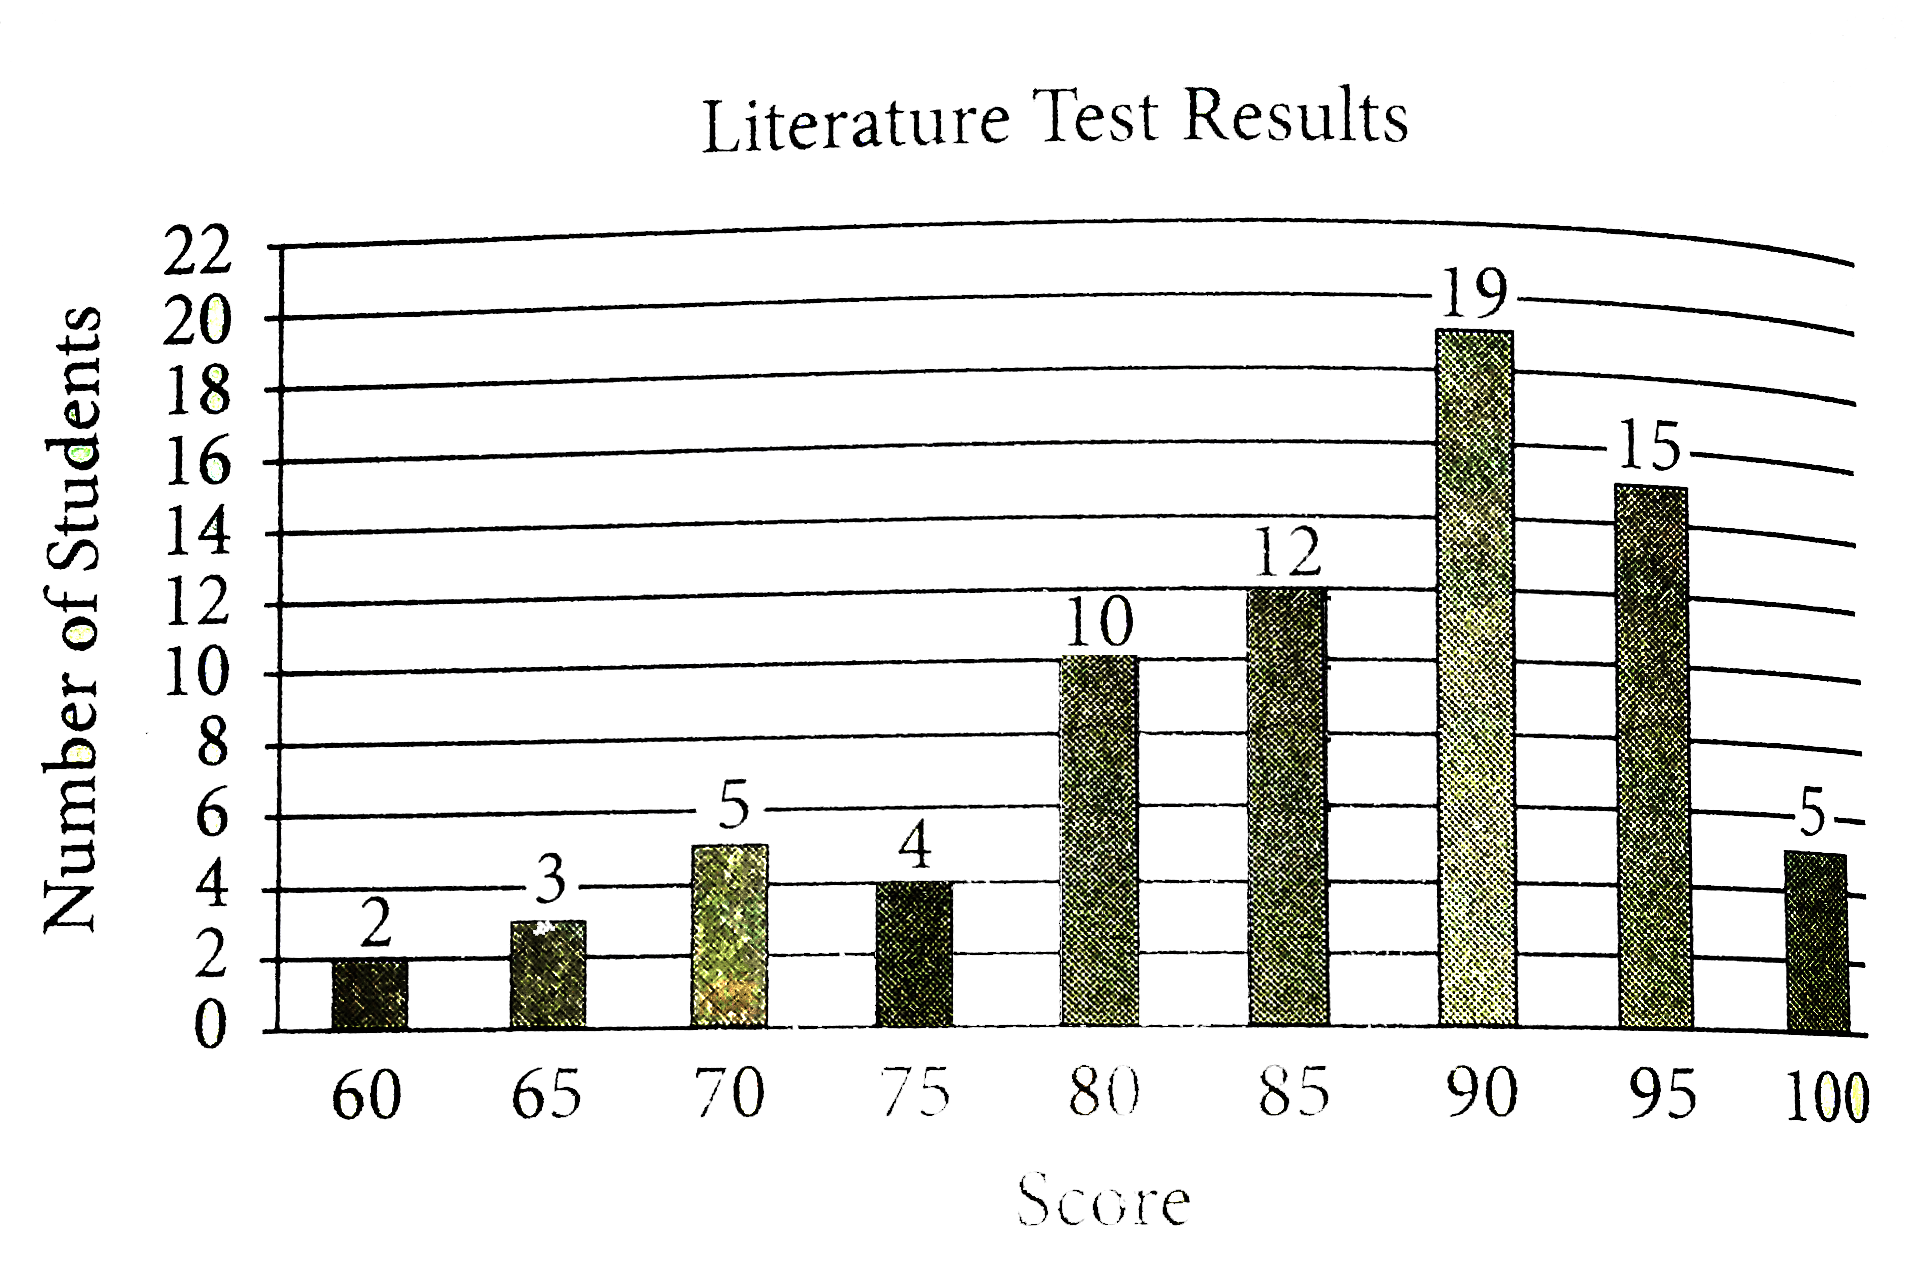
Find the probability that a student of the class was born in August.A12B13C14D320In a particular college, the test scores of the most recent test given for a particular Physics class and a particular Literature class were studied. Both tests were scored from 0 to 100 and had a total of 20 question, which were equally weighted with no partial credit. The physics class had 128 students and the Literature class had 75 students . The test results are shown in the two graphs below.

The dean of the college is comparing the scores from the two classes and calculates the median for each class. If the dean labels the median score of the Physics class P and the median score of the Literature class L, what is the sum of P and L?A175B170C85D80
In a class of 40 students, the marks obtained (out of 50) are as given below:

Draw a histogram to represent the given data.
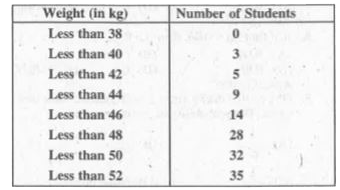
View SolutionDuring the medical check up of 35 students of a class, their weights were recorded as follows :
Draw a less then type ogive for the given data. Hence obtain the median weight from the graph and verify the result by using the formula.

View SolutionIn a school, there are five sections of class IX. The number of students in each section is given below. Construct a bar graph representing this data: Section: A B C D E No. of Students 40 48 52 45 30
View SolutionIn a school, there are five sections of class IX. The number of students in each section is given below. Construct a bar graph representing this data: Section: A B C D E No. of Students 40 48 52 45 30
View SolutionIn a school there are five sections of class IX. The number of students in each section is given below.
Construct a bar graph.

View SolutionIn a school, there are five sections of class VII. The number of students in each section is given below. Construct a bar graph representing this data: Section, A, B, C, D, E No. of Students, 40, 48, 52, 45, 30
View Solution
