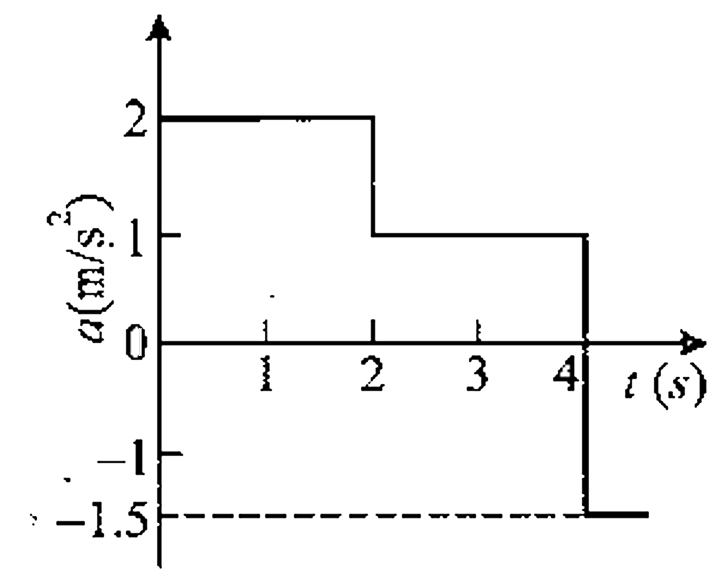
The figure-1.125 shows the acceleration versus time graph of a train. If it starts from rest, the distance it travels before it comes to rest is :
30 m
26 m
13 m
40 m
The correct Answer is:B
Area below v−t curve will provide net displacement.
Topper's Solved these Questions
- BOOK - GRB PUBLICATIONCHAPTER - MOTION IN A STRAIGHT LINEEXERCISE - More than one choice is correct16videos
MOTION IN A STRAIGHT LINE
- BOOK - GRB PUBLICATIONCHAPTER - MOTION IN A STRAIGHT LINEEXERCISE - Assertion Reason12videos
MOTION IN A STRAIGHT LINE
- BOOK - GRB PUBLICATIONCHAPTER - MOTION IN A STRAIGHT LINEEXERCISE - Problems and Practice16videos
MOTION IN A STRAIGHT LINE
- BOOK - GRB PUBLICATIONCHAPTER - FRICTION AND CIRCULAR MOTION EXERCISE - Comprehension type11videos
FRICTION AND CIRCULAR MOTION
- BOOK - GRB PUBLICATIONCHAPTER - MOTION IN TWO AND THREE DIMENSIONSEXERCISE - All Questions210videos
MOTION IN TWO AND THREE DIMENSIONS
Similar Questions
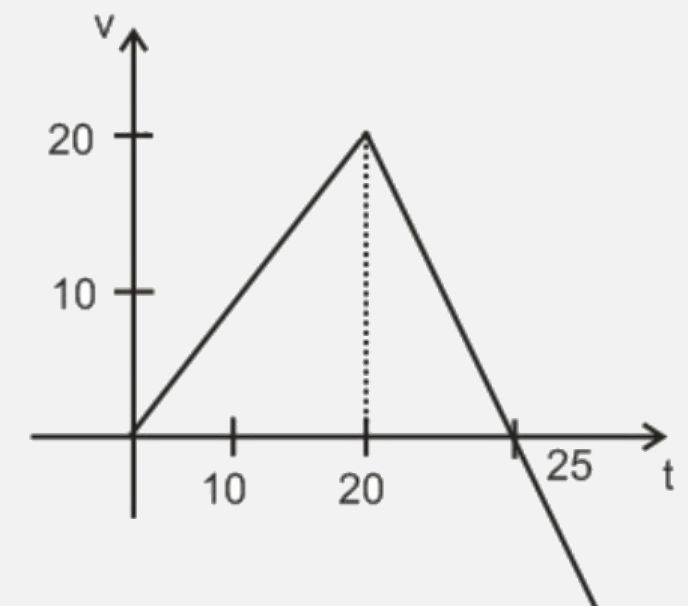
The figure shows the v−t graph of a particle moving in a straight line. Starting from rest, the time after which the particle returns to its starting position is
 View Solution
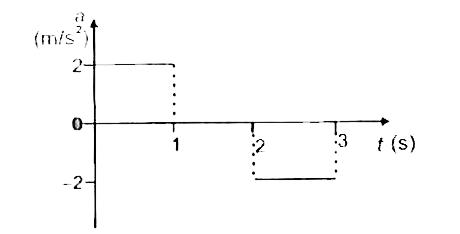
Acceleration - time graph for a particle is given in figure. If it starts motion at t = 0, distance travelled in 3 s will be
 View Solution
Knowledge Check
- Question 1 - Select One
Suppose that the acceleration versus time graph of a particle that starts from rest at t = 0 is as shown in the figure :
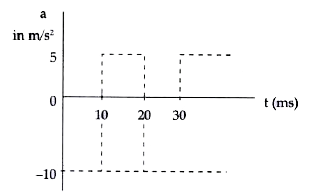
At what instant does the particle come to rest for the first time ?A5 sB10 sC15 sDThe particle never comes to rest - Question 2 - Select One
Suppose that the acceleration versus time graph of a particle that starts from rest at t = 0 is as shown in the figure :
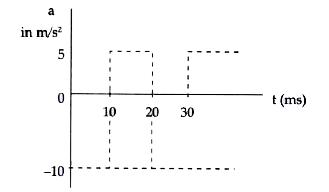
What is the total distance travelled by the particle during 30 s ?A0 mB500 mC750 mD1000 m - Question 3 - Select One
The following figure-1.124 shows the velocity-time graph of a train. The total distance travelled by the train is :
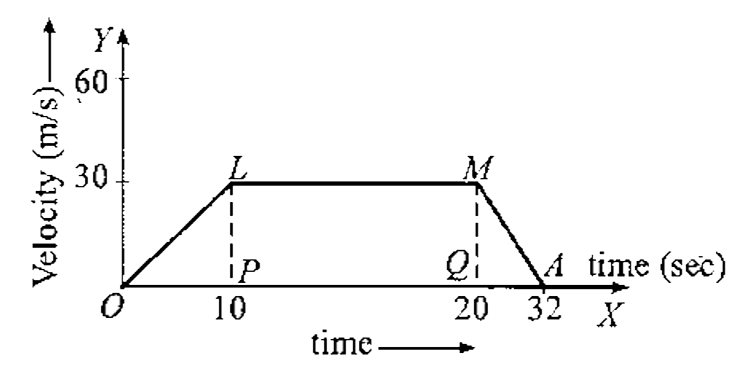 A780 mB1200 mC660 mD1500 m
Figure shows the speed versus time graph for a particle. Find the distance travelled by the particle during the time t=0 to t=3s.
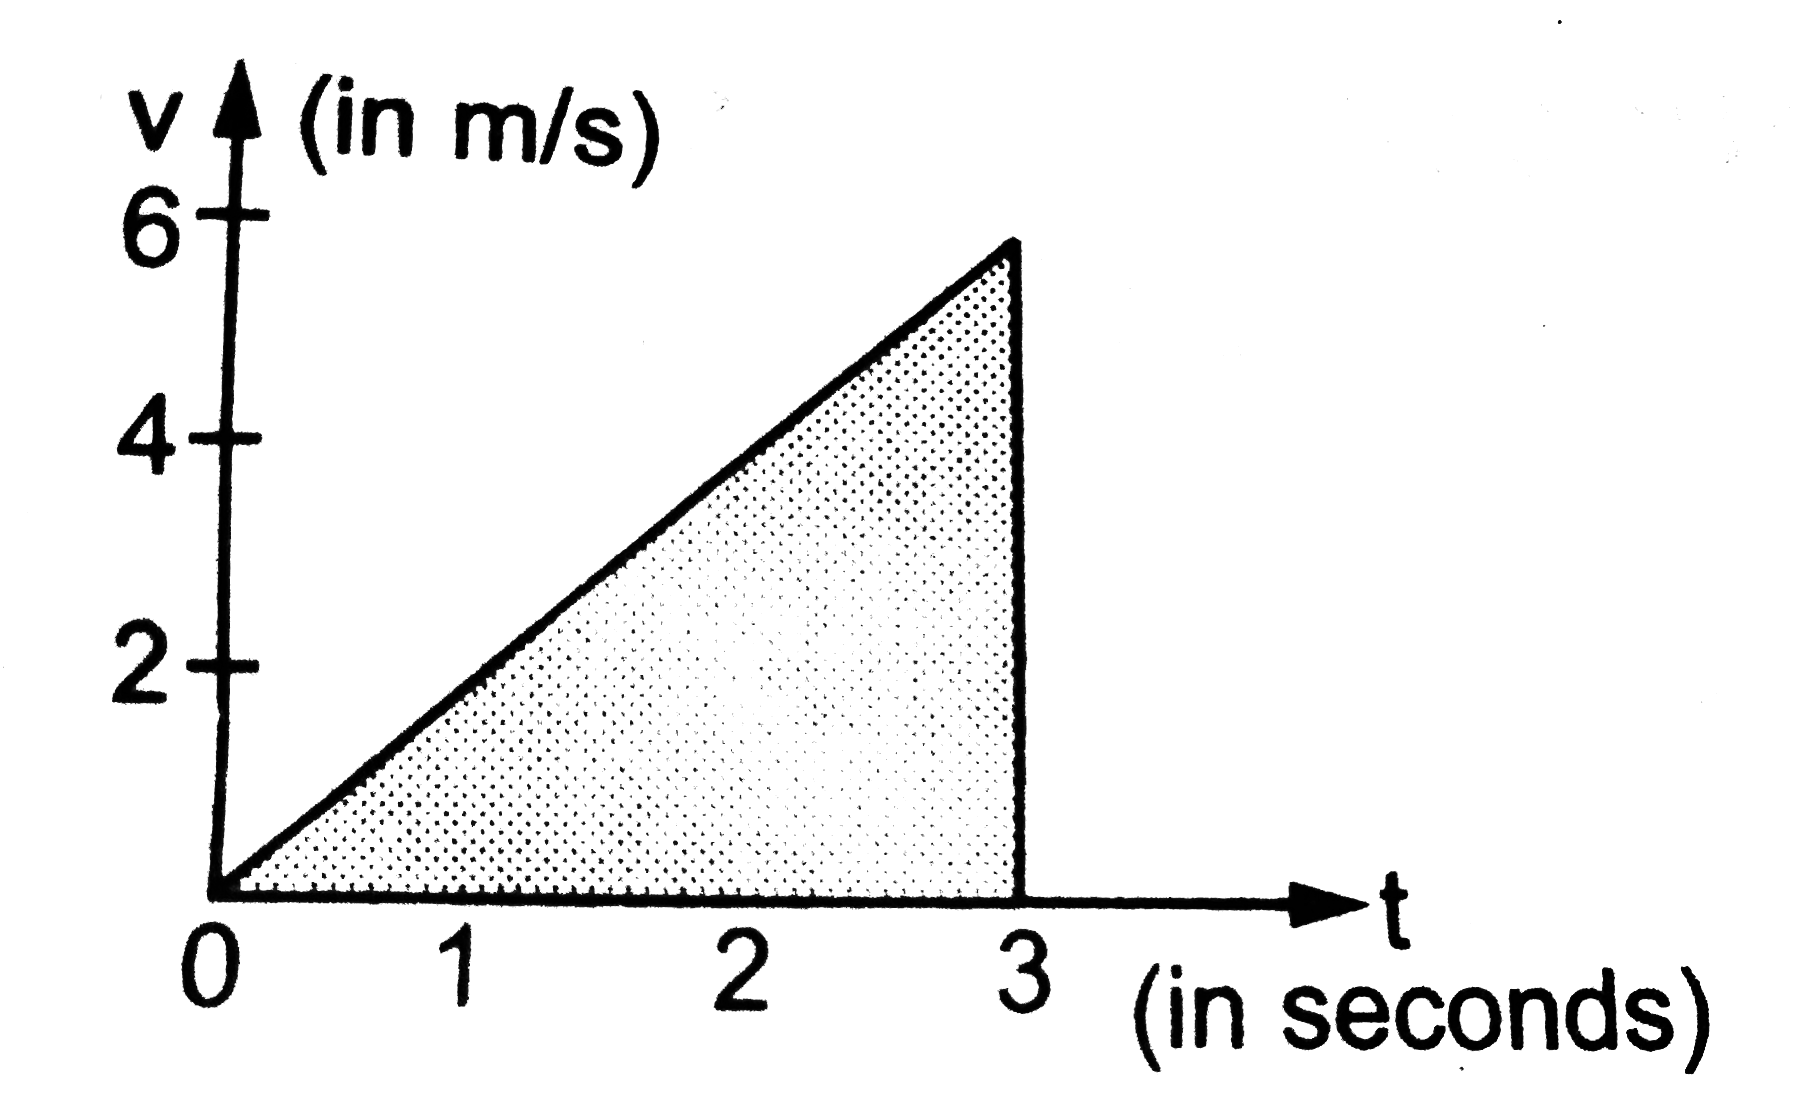 View Solution
A graph of acceleration versus time of a particle starting from rest at t=0 is as shown in figure. The speed of the particle at t=14s is
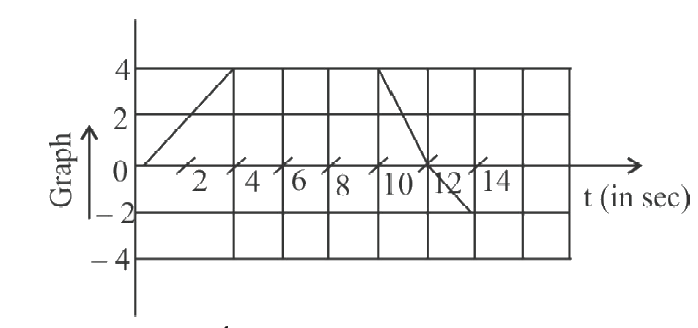 View Solution
A graph of acceleration versus time of a particle starting from rest at t =0 is shown. The speed of the particle at t=14 second is
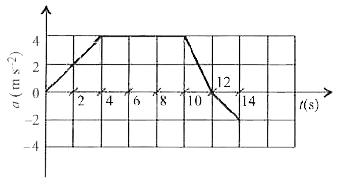 View Solution
A particle starts to move along a straight line. The acceleration versus time graph of particle is as shown in figure. The correct velocity versus time graph is :
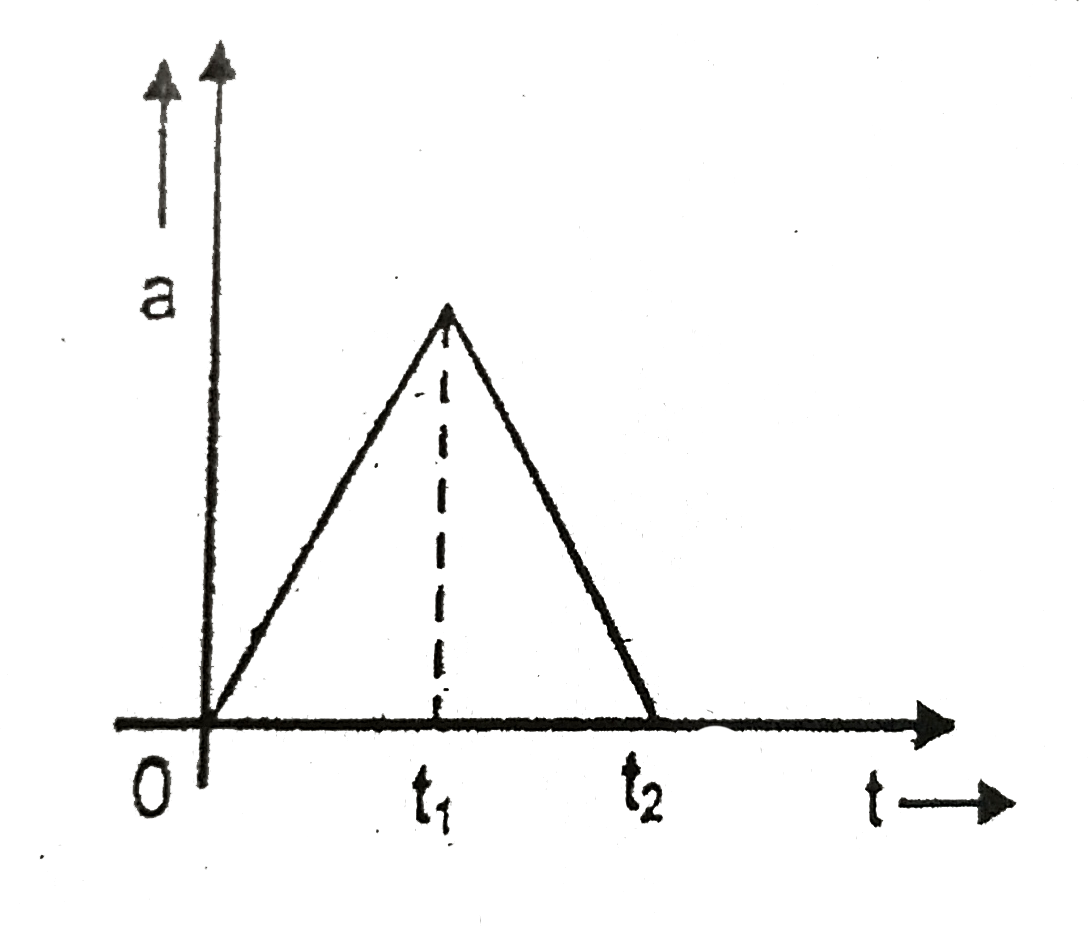 View Solution
The figure shows a velocity-time graph of a particle moving along a straight line
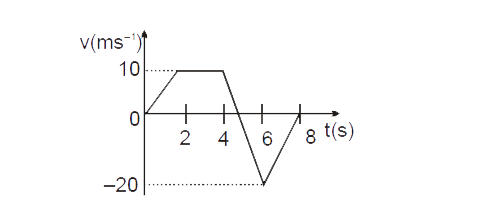
Choose the incorrect statement. The particle comes to rest atView Solution

