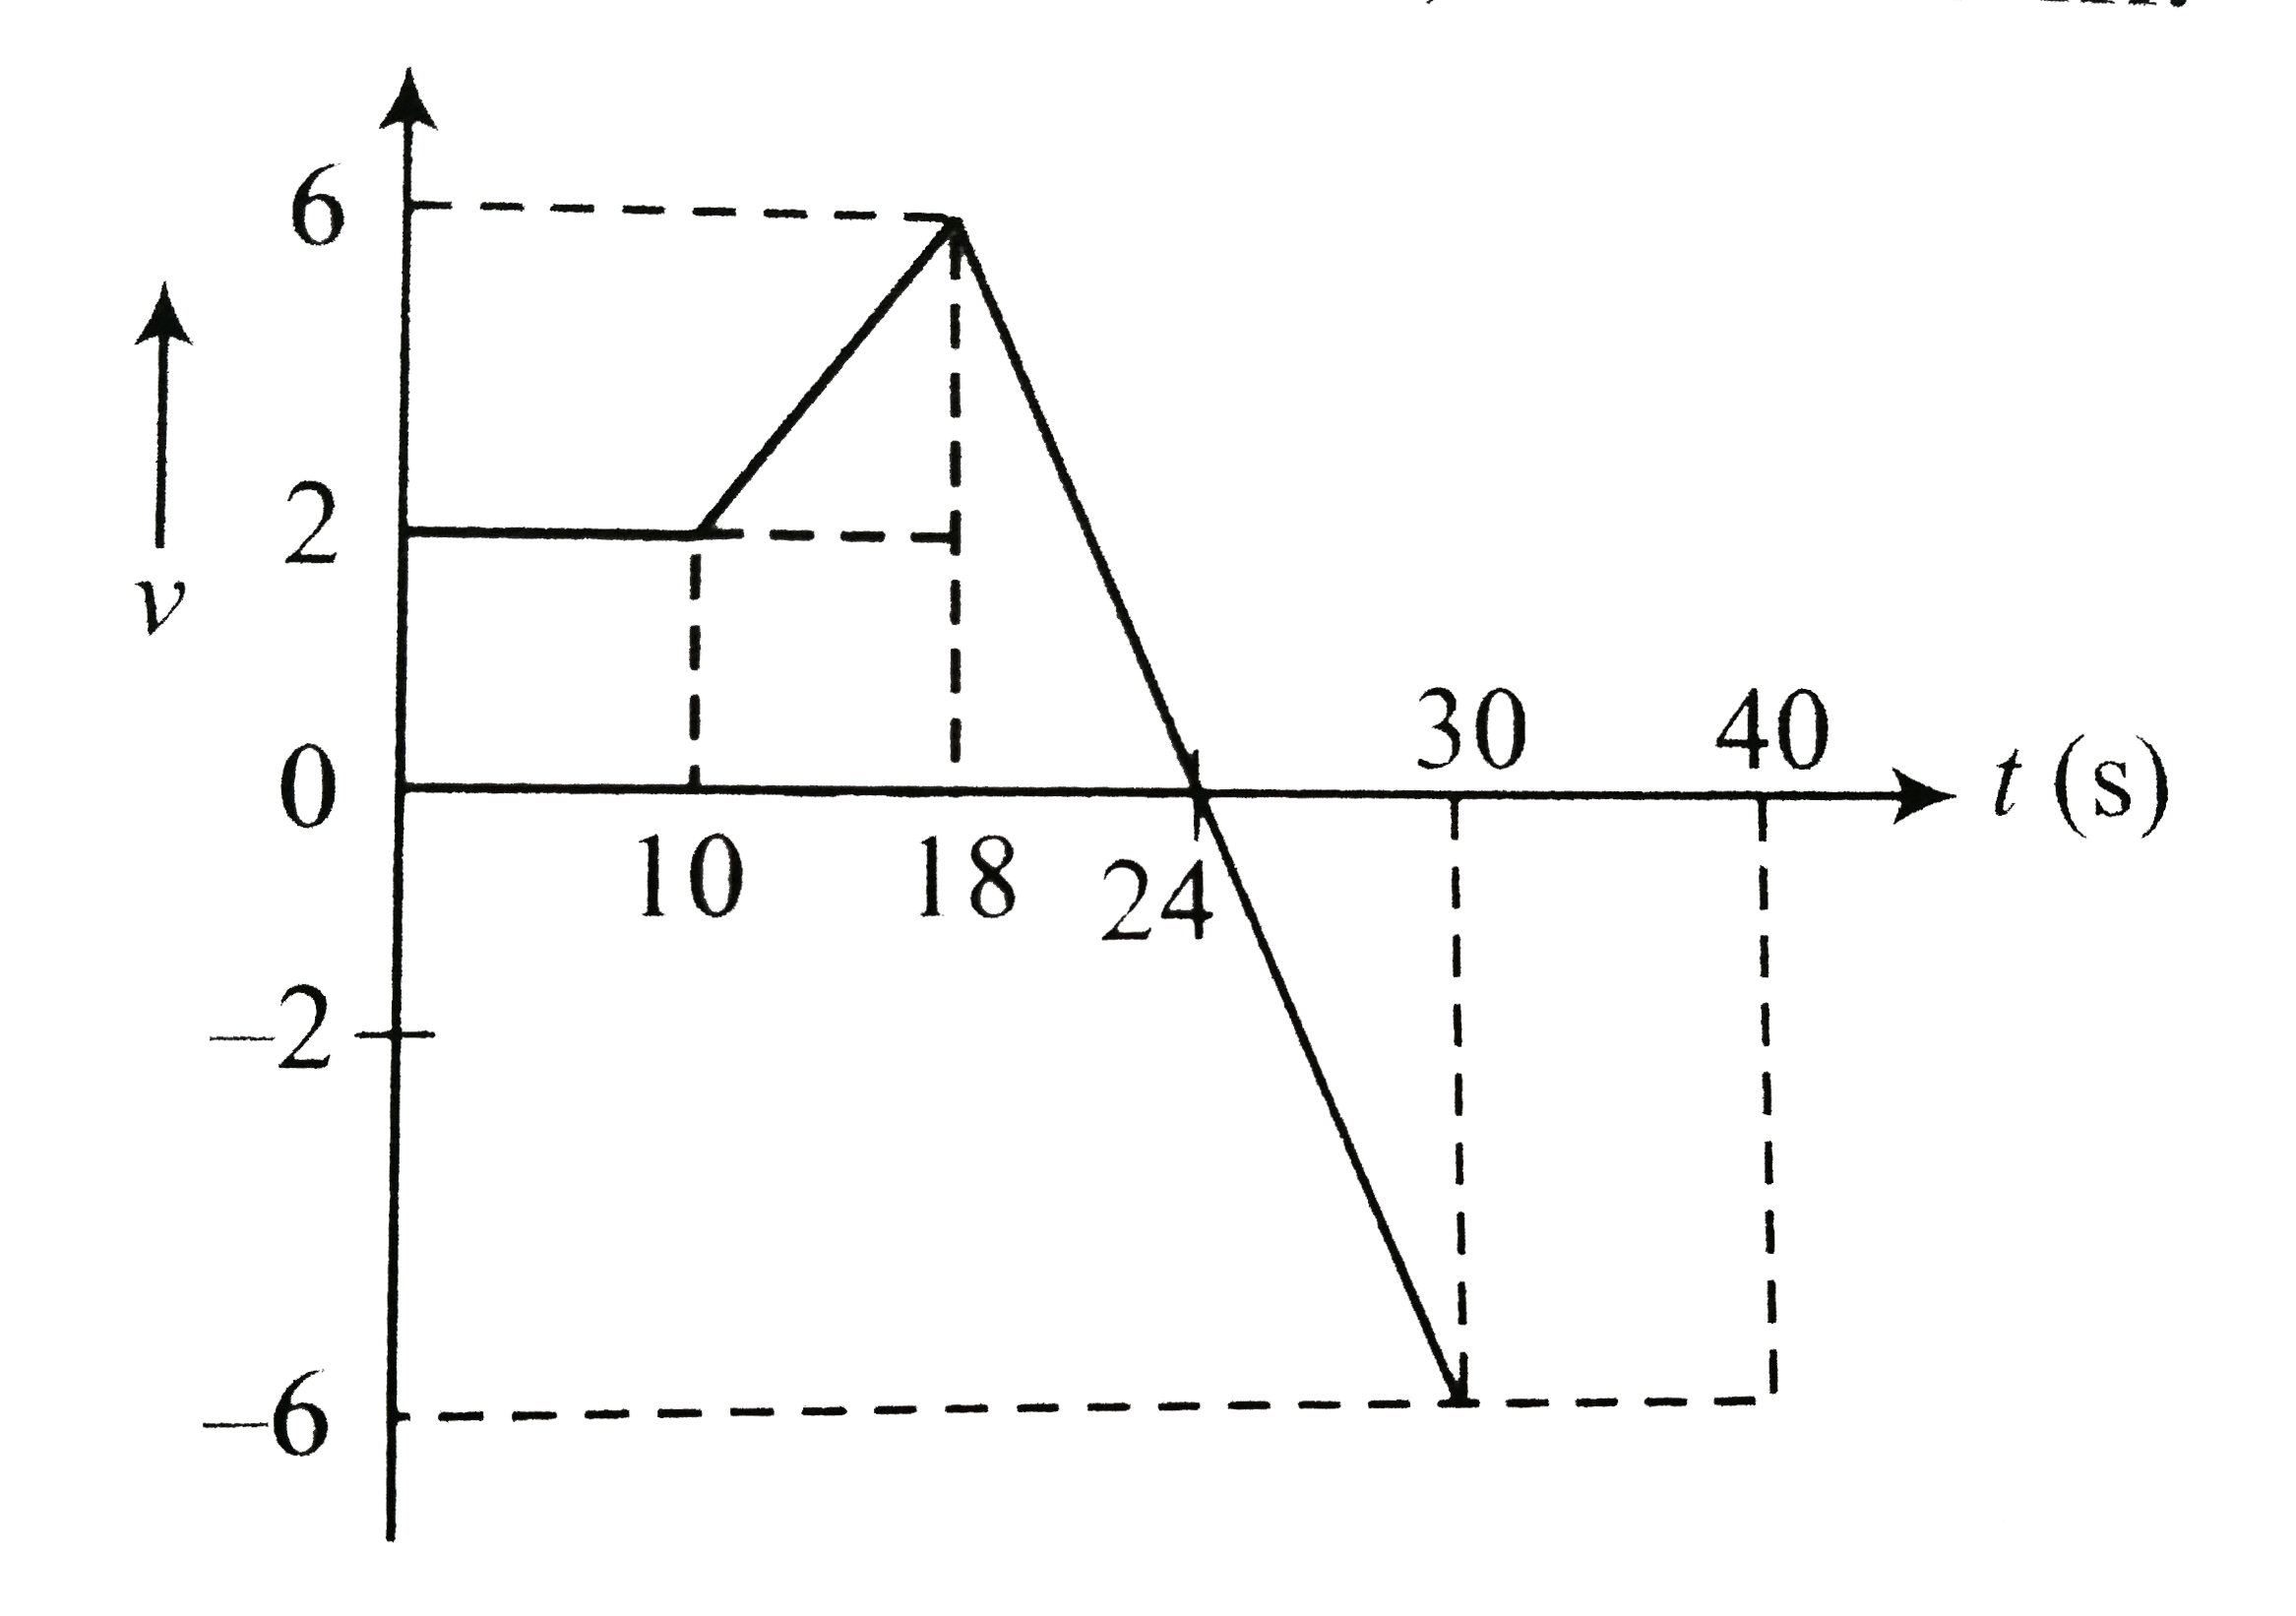
A particle moves in a straight line with the velocity as shown in. At t=0,x=−16m,
 .
.
The maximum value of the position coordinate of the particle is 54 m
The maximum value of the position coordinate of the particle is 36 m
The particle is at the position of 36 m at t=18s
The particle is at the position of 36 m at t=30s
The correct Answer is:A, C, D
Maximum value of position coordinate
= initial coordinate + area under graph upto t
=24s (As upto t=24s, the displacement of the particle will be positive)
Maximum value of position coordinate
=−16+[(20×10)+(2+62)×(18−10)+1×62×(24−18)]

Topper's Solved these Questions
- MOTION IN A STRAIGHT LINEBOOK - GRB PUBLICATIONCHAPTER - MOTION IN A STRAIGHT LINEEXERCISE - Assertion Reason
12 Videos
- MOTION IN A STRAIGHT LINEBOOK - GRB PUBLICATIONCHAPTER - MOTION IN A STRAIGHT LINEEXERCISE - Matrix -match
4 Videos
- MOTION IN A STRAIGHT LINEBOOK - GRB PUBLICATIONCHAPTER - MOTION IN A STRAIGHT LINEEXERCISE - Objective question
168 Videos
- FRICTION AND CIRCULAR MOTION BOOK - GRB PUBLICATIONCHAPTER - FRICTION AND CIRCULAR MOTION EXERCISE - Comprehension type
11 Videos
- MOTION IN TWO AND THREE DIMENSIONSBOOK - GRB PUBLICATIONCHAPTER - MOTION IN TWO AND THREE DIMENSIONSEXERCISE - All Questions
210 Videos
Similar Questions
A particle moves in a straight line with the velocity curve shown in figure. Draw approximate acceleration vs time and displacement vs time curves. Consider x=0 at t=0.

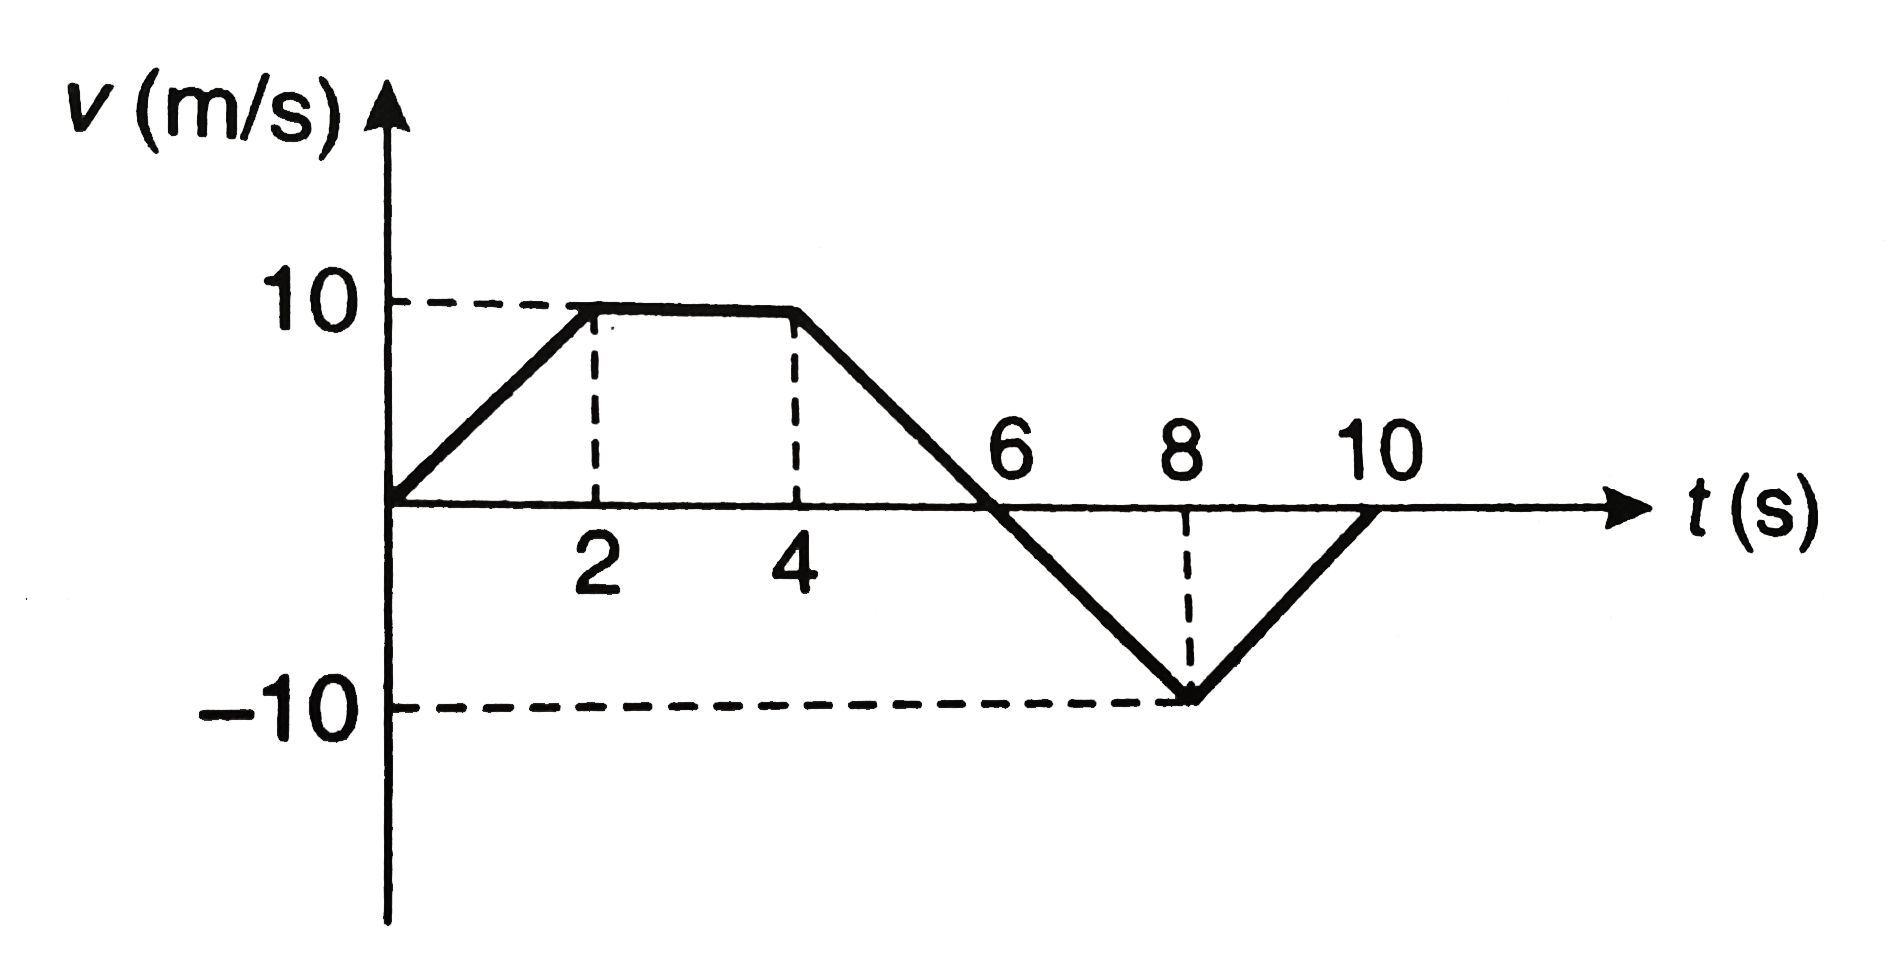
View SolutionVelocity-time graph of a particle moving in a straight line is shown in figure. At time t=0,s=−10m. Plot corresponding a-t and s-t graphs.
View Solution
Knowledge Check
A particle moves in a straight line with the velcity as shown in. At t=0,x=16m,
 .AThe maximum value of theposition coordinate of the particle is 54m.BThe maximum value of theposition coordinate of the particle is 36m.CThe particle is at the position of 36m at t=18s.DThe particle is at the position of 36m at t=30s.
Velocity displacement graph of a particle moving in a straight line is as shown in figure.
 Amagnitude of acceleration of particle is decreasingBmagnitude of acceleration of particlre is increasingCacceleration versus displacement graph straight lineDacceleration versus displacement graph is parabola
A particle moves on a straight line with a uniform velocity. The angular momentum of the particles is
AAlways zeroBzero about a point on the stright lineCzero about a point away from the straight lineDconstant always about a given point not on the line
Mark the statement True (T) or False (F):A particle moves along a straight line. Its speed and velocity are both given by +3 m/s at an instant. The particle is moving the positive direction of the line .
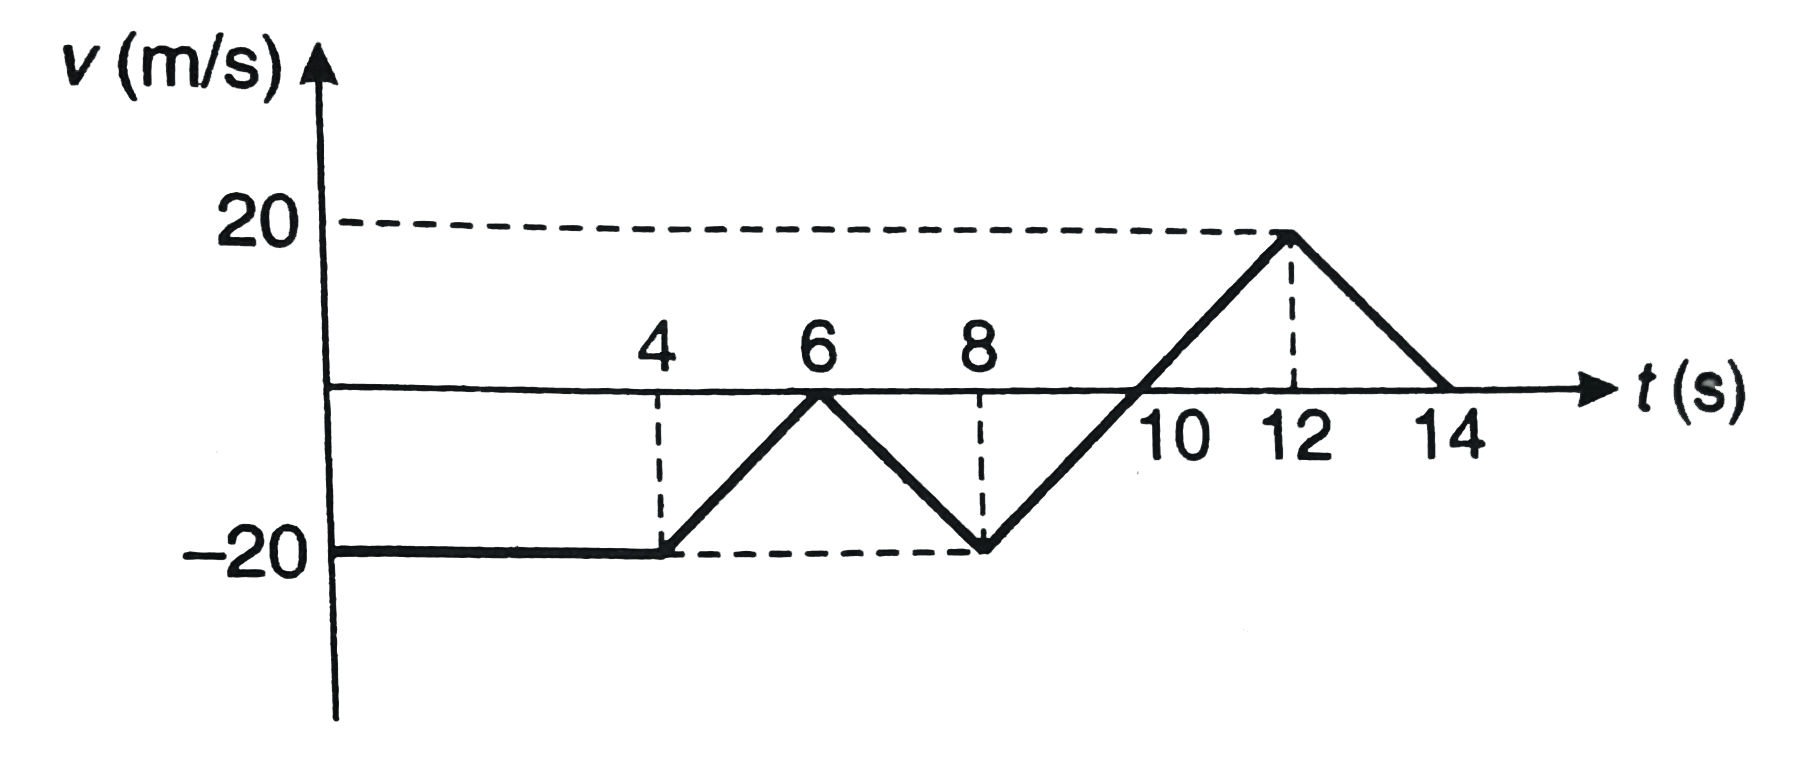
View SolutionVelocity-time graph of a particle moving in a straight line is shown in figure. At time t=0.s=20m. Plot a-t and s-t graphs of the particle.
View SolutionAcceleration-time graph of a particle moving in a straight line is as shown in figure. At time t=0, velocity of the particle is zero. Find
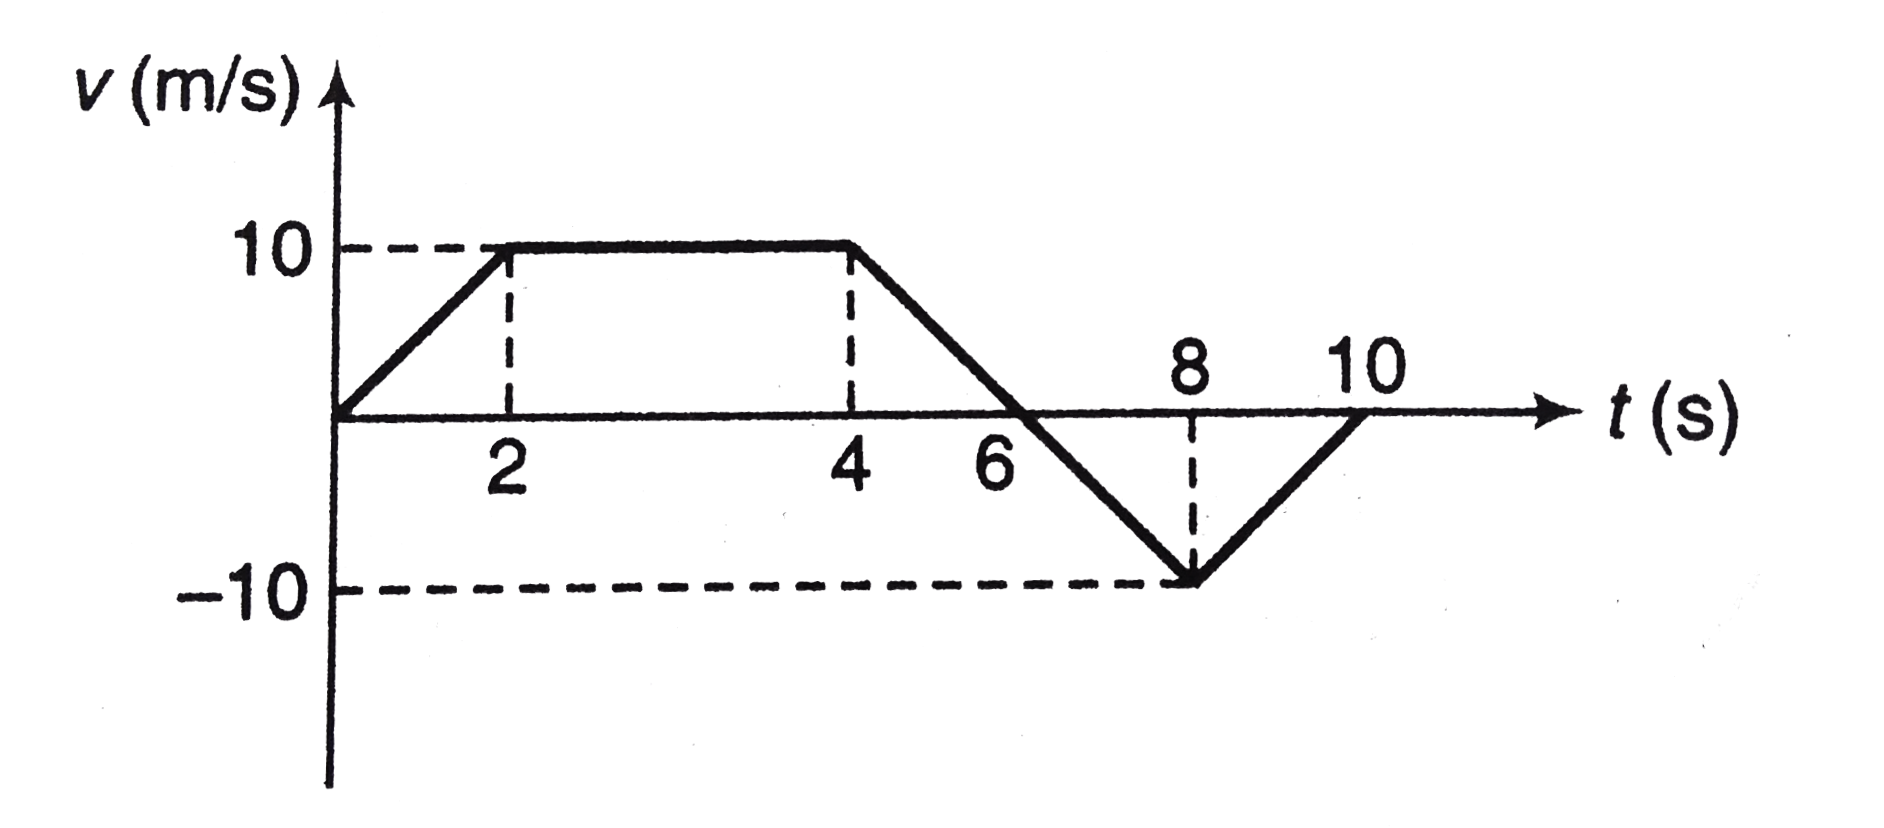
(a) average acceleration in a time interval from t=6s to t=12s,
(b) velocity of the particle at t=14s.
View SolutionThe diagram shows the displacement-time graph for a particle moving in a straight line. Find the average velocity for the interval from t=0 to t=5s.
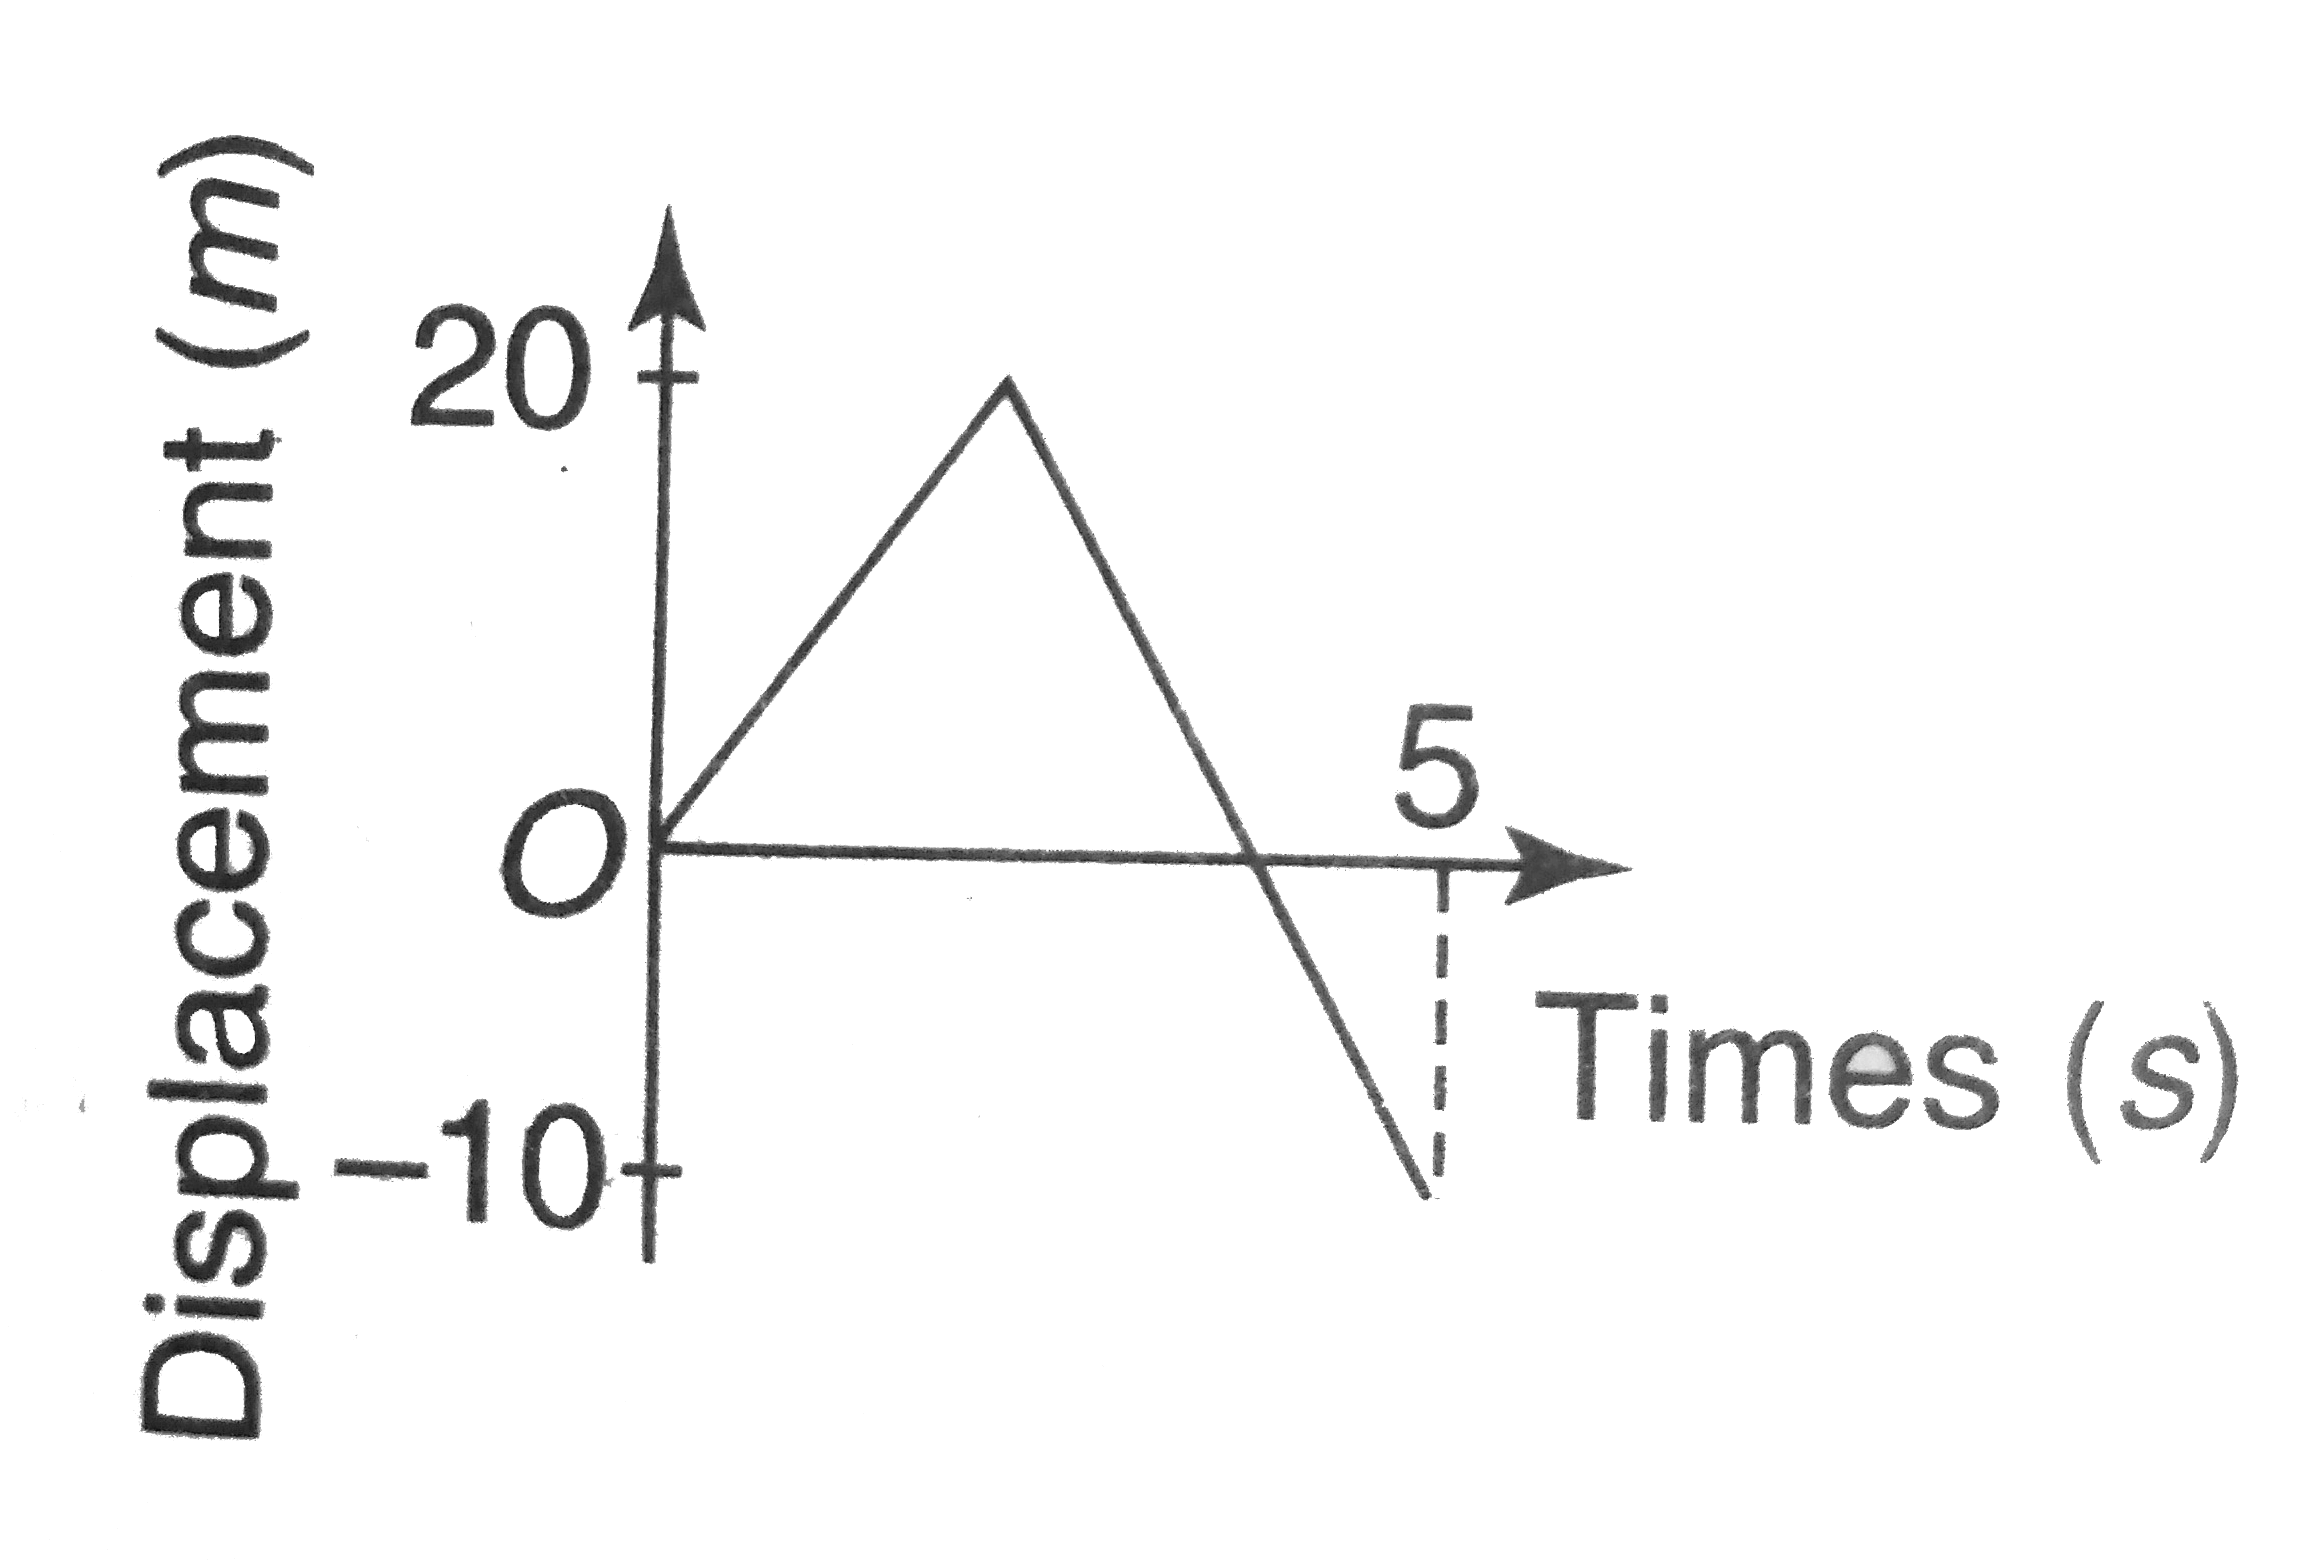
View SolutionThe diagram shows the displacement-time graph for a particle moving in a straight line. Find the average velocity for the interval from t=0 to t=5s.

View Solution
