The graph plotted between phase angle (ϕ) and displacement of a particle from equilibrium position (y) is a sinusoidal curve as shown below. Then the best matching is
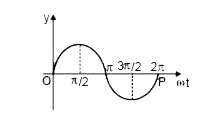
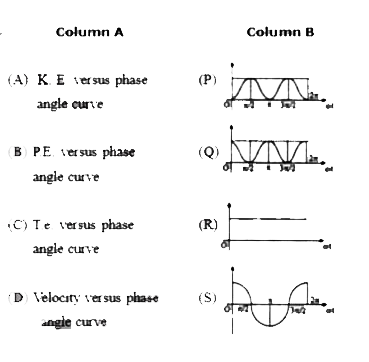
A→P,B→Q,C→R,D→S
A→Q,B→P,C→R,D→S
A→Q,B→P,C→S,D→R
A→Q,B→R,C→S,D→P
The correct Answer is:B
Step by step video & image solution for The graph plotted between phase angle (phi) and displacement of a particle from equilibrium position (y) is a sinusoidal curve as shown below. Then the best matching is by Physics experts to help you in doubts & scoring excellent marks in Class 12 exams.
Updated on:21/07/2023Topper's Solved these Questions
- SIMPLE HARONIC MOTION BOOK - MOTIONCHAPTER - SIMPLE HARONIC MOTION EXERCISE - EXERCISE -2 (Leve-I I) ( SECTION - A ) (– Equation of SHM, Velocity and Acceleration in SHM, Energy of SHM)
3 Videos
- SIMPLE HARONIC MOTION BOOK - MOTIONCHAPTER - SIMPLE HARONIC MOTION EXERCISE - EXERCISE -2 (Leve-I I) ( SECTION - B ) (Time per iod and angu lar frequency in SHM)
5 Videos
- SIMPLE HARONIC MOTION BOOK - MOTIONCHAPTER - SIMPLE HARONIC MOTION EXERCISE - EXERCISE -2 (Leve-I) ( SECTION - G ) ( Compound pendulum / physicalpendulum, torsional pendulum )
5 Videos
- SIMPLE HARMONIC MOTIONBOOK - MOTIONCHAPTER - SIMPLE HARMONIC MOTIONEXERCISE - EXERCISE -3 Section - B Previous Year Problems | JEE MAIN
23 Videos
- SOUND WAVESBOOK - MOTIONCHAPTER - SOUND WAVESEXERCISE - Exercise - 3 (Section - B)
14 Videos
Similar Questions
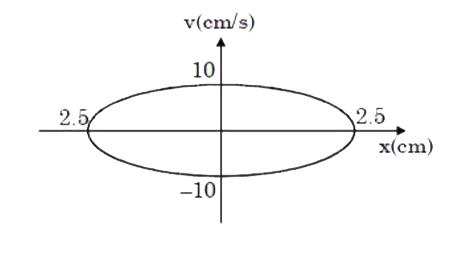
A graph between velocity and displacement of a particle performing SHM is shown. Find the acceleration when the particle is at half of maximum displacement from mean position.
View SolutionThe shape of graph plotted between velocity and position of a particle executing simple harmonic motion is
View Solution
Knowledge Check
The graph plotted between phase angle (ωt) and displacement of a particle from equilibrium position (y) is a sinusoidal curve as shown below. Then the best matching is
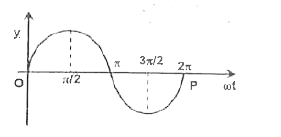
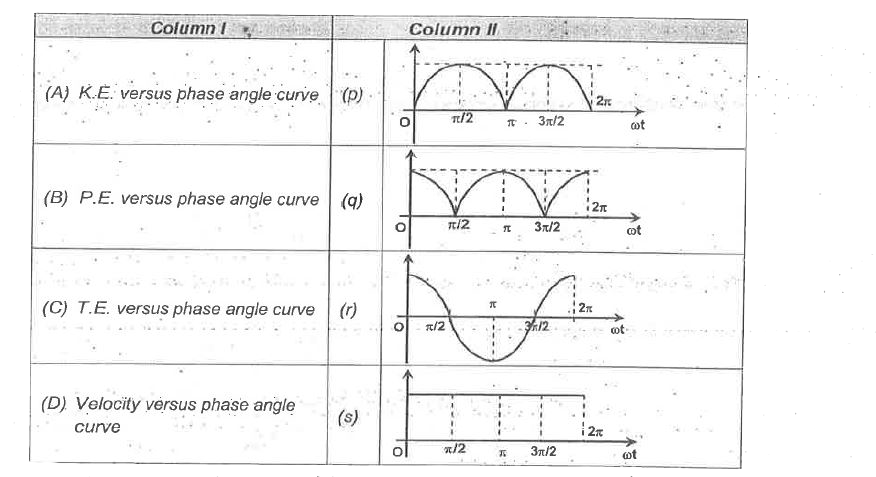 APQRS1432BPQRS2143CPQRS3214DPQRS2341
The graph plotted between acceleration and displacement of a particle in SHM is
Aa straight lineBa circleCan ellipseDa hyperbolaIf a graph is plotted between velocity (v) and displacement (y) of a particle executing SHM from mean position, then the nature of the graph is
AStraight lineBParabolaCEllipseDHyperbola
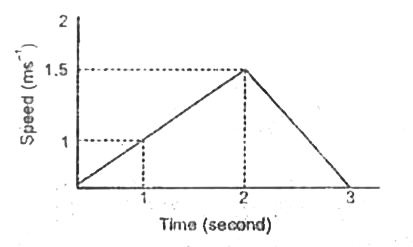
The speed - time graph of a particle moving along a solid curve is shown below. The distance traversed by the particle from t = 0 to t = 3 is
View SolutionIn case of a simple harmonic motion, if the velocity is plotted along the X-axis and the displacement (from the equilibrium position) is plotted along the Y-axis, the resultant curve happens to be an ellipse with the ratio =major axis along Xminor axis along Y=20π
What is the frequency of the simple harmonic motion?
View SolutionIn case of a simple harmonic motion, if the velocity is plotted along the X-axis and the displacement (from the equilibrium position) is plotted along the Y-axis, the resultant curve happens to be an ellipse with ratio:
major axis(along X)major axis (along Y)=20π
What is the frequency of the simple harmonic motion ?
View SolutionThe figure shows a graph between velocity and displacement (from mean position) of a particle performing SHM:

View SolutionA pendulum is displaced to an angle θ from its equilibrium position, then it will pass through its mean position with a velocity v equal to
View Solution
