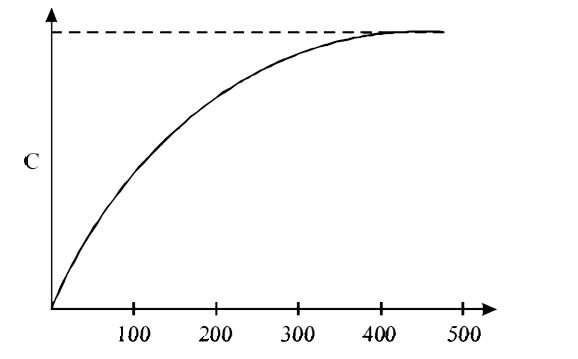
The figure below shows the variation of specific heat capacity (C) of a solid as a function of temperature (T). The temperature is increased continuously form 0 to 500K at a constant rate. Ignoring any volume change, the following statement (s) is (are) correct to a reasonable approximation.

the rate at which heat is absorbed in the range 0-100 K varies linearly with temperature T.
heat absorbed in increasing the temperature from 0-100 K is less than the heat required for increasing the temperature from 400-500 K.
there is no change in the rate of heat absorption in the range 400-500 K.
the rate of heat absorption increases in the range 200-300 K.
Step by step video & image solution for The figure below shows the variation of specific heat capacity (C) of a solid as a function of temperature (T). The temperature is increased continuously form 0 to 500K at a constant rate. Ignoring any volume change, the following statement (s) is (are) correct to a reasonable approximation. by Physics experts to help you in doubts & scoring excellent marks in Class 12 exams.
Topper's Solved these Questions
- BOOK - MOTIONCHAPTER - HEAT - 1EXERCISE - EXERCISE -4 (Level - I) Previous Year | JEE Main10videos
HEAT - 1
- BOOK - MOTIONCHAPTER - GRAVITATIONEXERCISE - Exercise - 4 Section - B Previous Years Problems15videos
GRAVITATION
- BOOK - MOTIONCHAPTER - HEAT TRANSFER & THERMAL EXPANSION EXERCISE - Exercise - 3 Section-B19videos
HEAT TRANSFER & THERMAL EXPANSION
Similar Questions
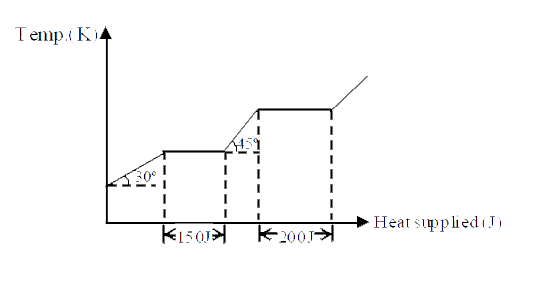
The temperature change versus heat supplied curve is given for 1 kg of a solid block. Then which of the following statement(s) is/are correct:
 View Solution
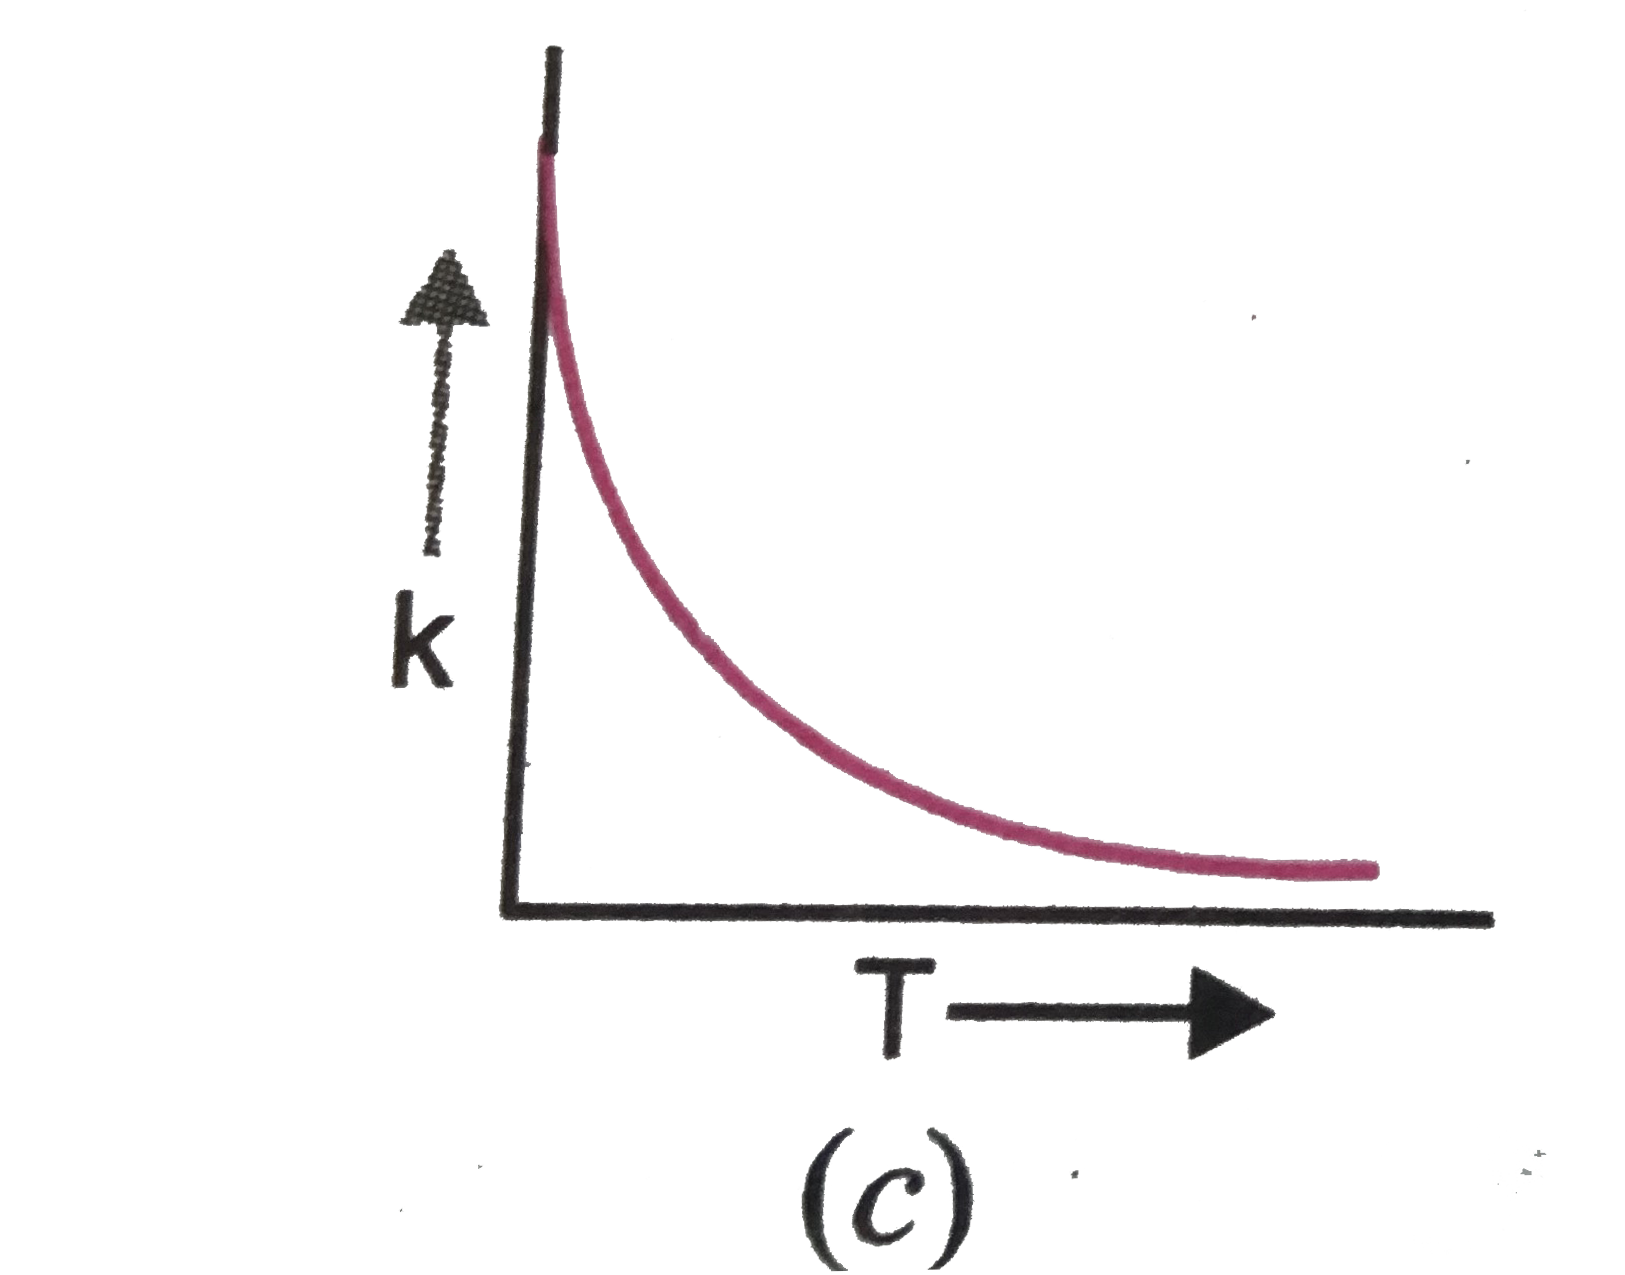
Plots showing the variation of the rate constant (k) with temperature (T) are given below. The plot that follows Arrhenius equations is
View Solution
Knowledge Check
- Question 1 - Select One or More
The figure below shows the variation of specific heat capacity (C) of a solid as a function of temperature (T). The temperature is increased continuousely form 0 to 500K at a constant rate. Ignorign any volume change, the following statement (s) is (are) correct to a reasonable approximation.
 AThe rate at which heat is absorbed in the range 0-100K varies linearly with temperature T.BHeat absorbed in increasing the temperature from 0-100K is less than the heat required for increasing the temperature from 400-500K.CThere is no change in the rate of heat absorption in the range 400-500K.DThe rate of heat absorption increases in the range 200-300K.
 - Question 2 - Select One or More
The figure shows the variation of specific heat capacity (C ) of a solid as a function of temperature (T). The temperature is increased continuously from 0 to 500 K at a constant rate. Ignoring any volume change, the following statements(s) is/are correct to a reasonable approximation.
 AThe rate at which heat is absorbed in the range 0-100 K varies linearly with temperature TBHeat absorbed in increasing the temperature from 0-100 K is less than the heat required for increasing the temperature from 400-500 KCThere is no change in the rate of heat absorption in the range 400-500 KDThe rate of heat absorption increases in the range 200-300 K
 - Question 3 - Select One
Plots showing the variation of the rate constant (k) with temperature (T) are given below. The plot that follows the Arrhenius equation is
A B
B C
C D
D
Plots showing the variation of the rate constant (k) with temperature (T) are given below. The plot that follows the Arrhenius equation is
View SolutionPlots showing the variation of the rate constant (k) with temperature (T) are given below. The plot that follows the Arrhenius equation is
View SolutionThe specific heat of many solids at low temperatures varies with absolute temperature T according to the relation S=AT3, where A is a constant. The heat energy required to raise the temperature of a mass m of such a solid from T = 0 to T = 20 K is
View SolutionWhen 1 mole gas is heated at constant volume, temperature is raised from 298 to 308 K. Heat supplied to the gas in 500 J. Then, which statement is correct ?
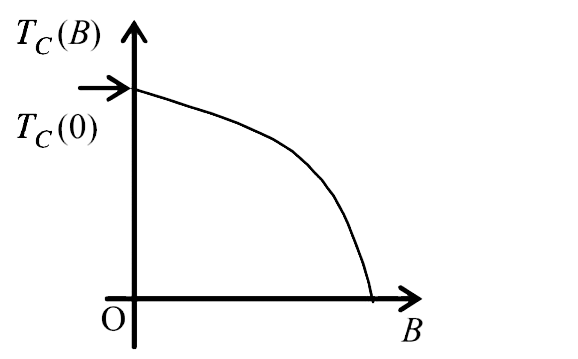
View SolutionElectrical resistance of certain materials, known as superconductors, changes abruptly from a nonzero value of zero as their temperature is lowered below a critical temperature TC(0). An interesting property of super conductors is that their critical temperature becomes smaller than TC(0) if they are placed in a magnetic field, i.e., the critical temperature TC(B) is a function of the magnetic field strength B. The dependence of TC(B) on B is shown in the figure.
 .
.
In the graphs below, the resistance R of a superconductor is shown as a function of its temperature T for two different magnetic fields B1(solid line) and B2 (dashed line). If B2 is larget than B1 which of the following graphs shows the correct variation of R with T in these fields?View Solution

