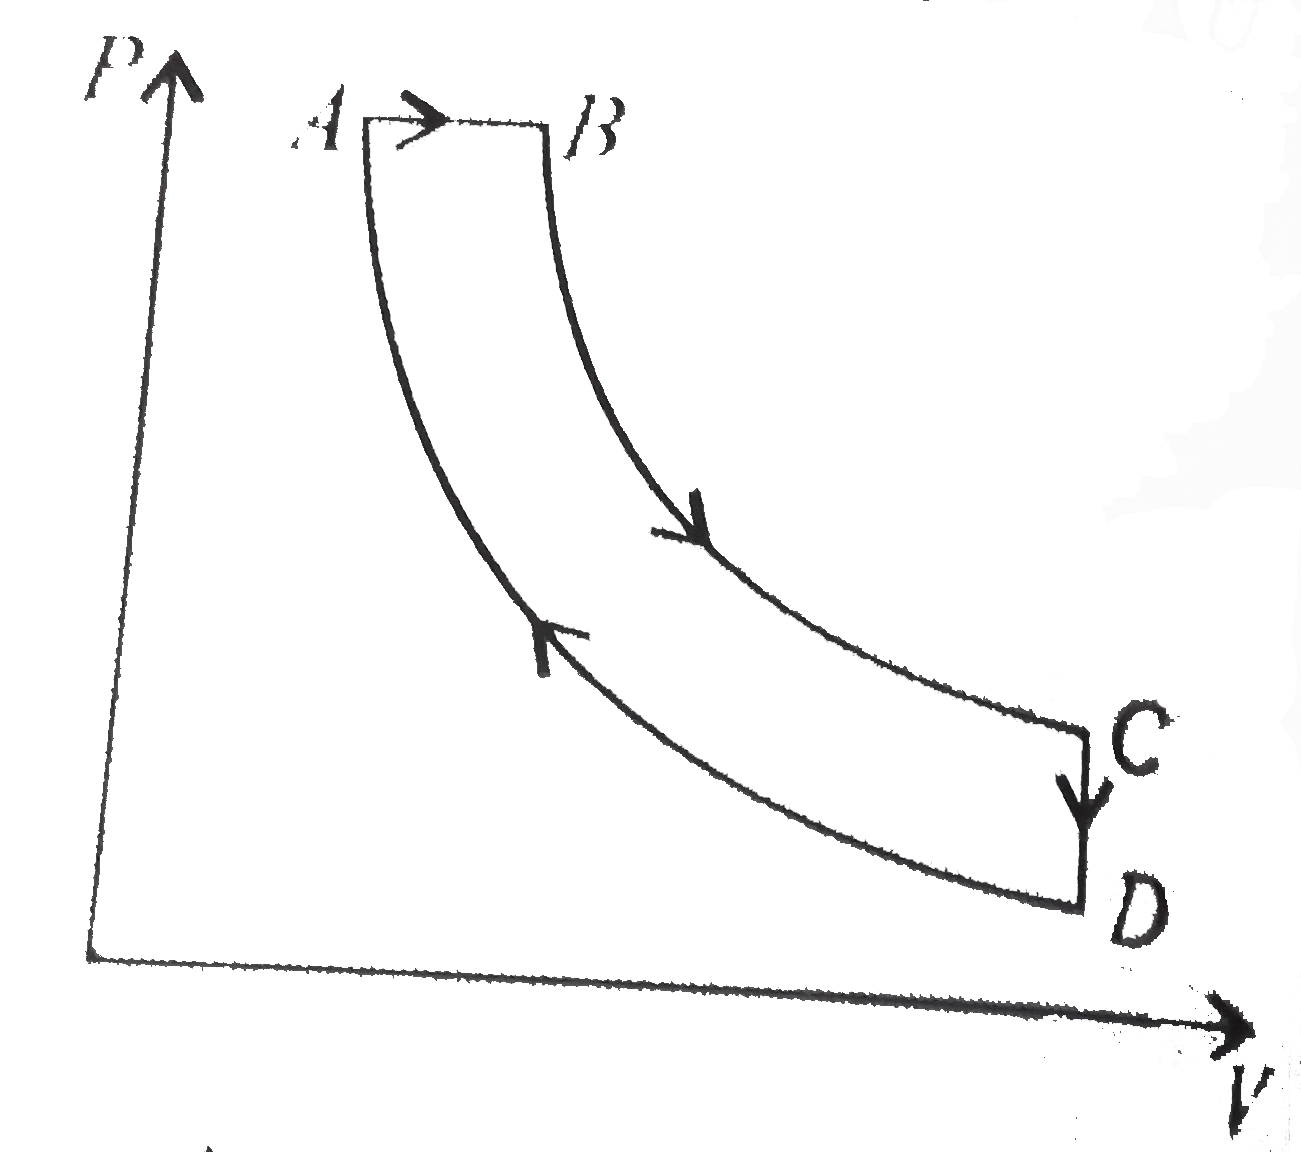
Three curves are shown in the P-V diagram. P, Q and R represent the processes respectively
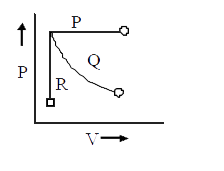
isothermal, adiabatic, isometric
isobaric, isothermal, isometric
isometric, isobaric, adiabatic
isometric, isobaric, isothermal
The correct Answer is:B
Step by step video & image solution for Three curves are shown in the P-V diagram. P, Q and R represent the processes respectively by Physics experts to help you in doubts & scoring excellent marks in Class 12 exams.
Updated on:21/07/2023Topper's Solved these Questions
- HEAT-2 BOOK - MOTIONCHAPTER - HEAT-2 EXERCISE - EXERCISE-2 (LEVEL-II)
13 Videos
- HEAT-2 BOOK - MOTIONCHAPTER - HEAT-2 EXERCISE - EXERCISE-3 (LEVEL-I)
22 Videos
- HEAT-2 BOOK - MOTIONCHAPTER - HEAT-2 EXERCISE - EXERCISE-1
40 Videos
- HEAT TRANSFER & THERMAL EXPANSION BOOK - MOTIONCHAPTER - HEAT TRANSFER & THERMAL EXPANSION EXERCISE - Exercise - 3 Section-B
19 Videos
- HYDROSTATIC, FLUID MECHANICS & VISCOSITYBOOK - MOTIONCHAPTER - HYDROSTATIC, FLUID MECHANICS & VISCOSITYEXERCISE - EXERCISE -3 (SECTION-B) PREVIOUS YEAR PROBLEM
7 Videos
Similar Questions
Knowledge Check
Scrubber is shown in the diagram. P and Q are respectively for the entry of
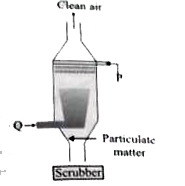 ADirty air, water/limeBDirty air, particulate matterCWater/lime, dirty airDWater/lime, particulate matter
Fertilized embryo sac is shown in the diagram P and Q are results of …....and …..... , respectively .
Adouble Fertilization , syngamyBtriple fusion , syngamyCsyngamy , parthenocarpyDsyngamy , triple fusion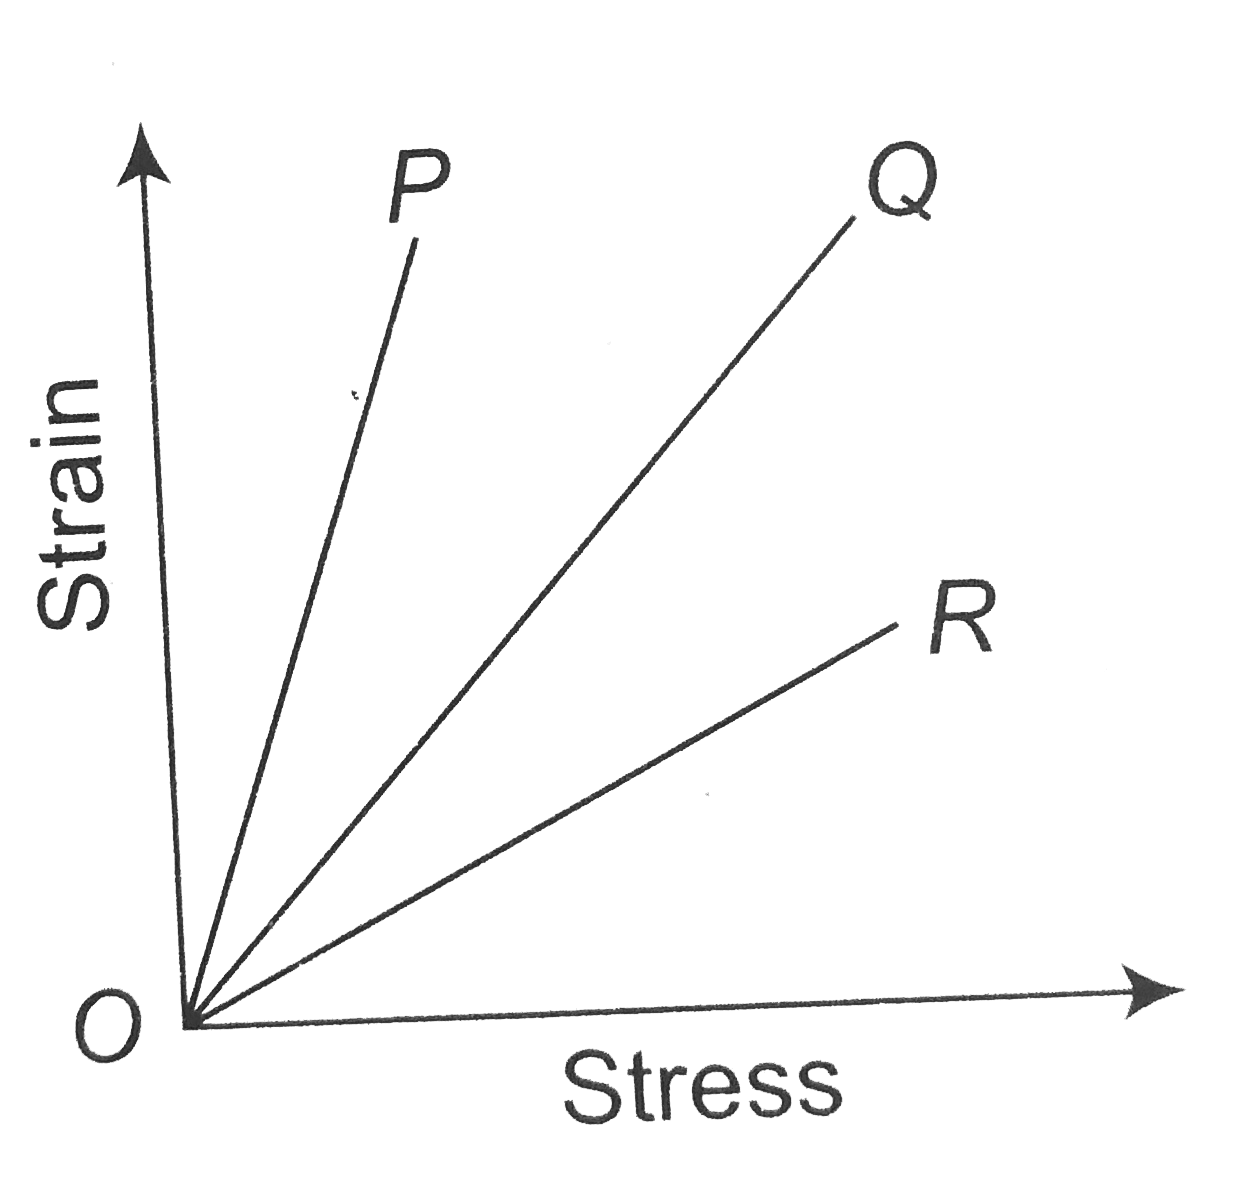
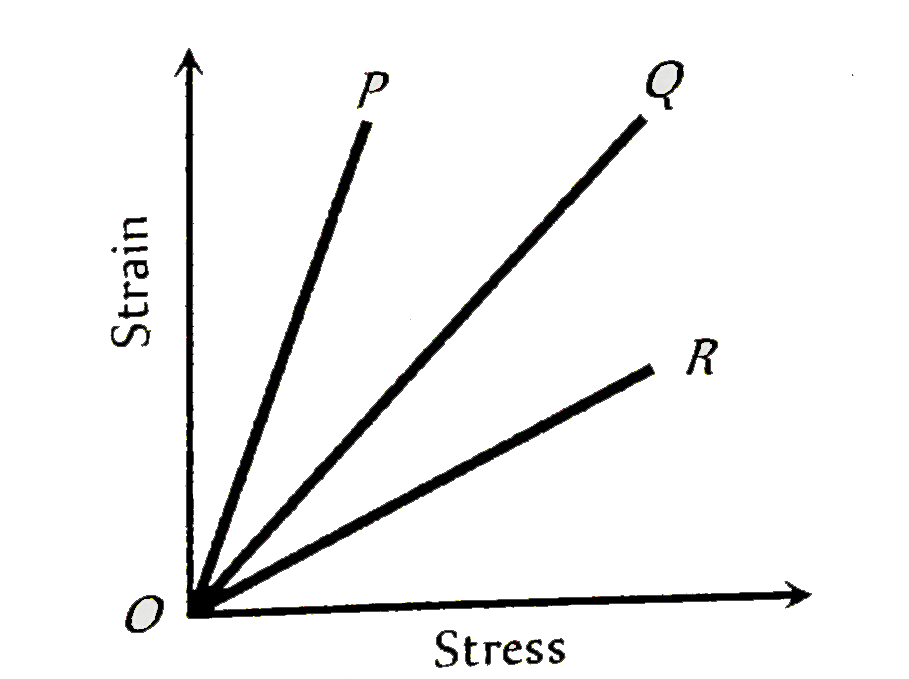
The strain stress curves of three wires of different materials are shown in the figure. P, Q and R are the elastic limits of the wires. The figure shown thatAElasticity of wire P is maximumBElasticity of wire Q is maximumCTensile strength of R is maximumDNone of the above is true.
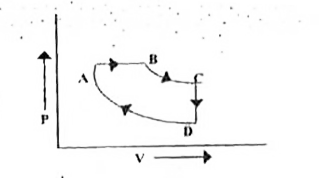
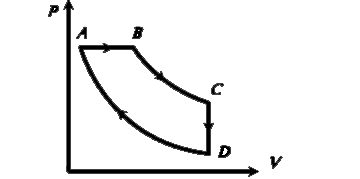
A cyclic process ABCD is shown in the figure P-V diagram. Which of the following curves represent the same process?
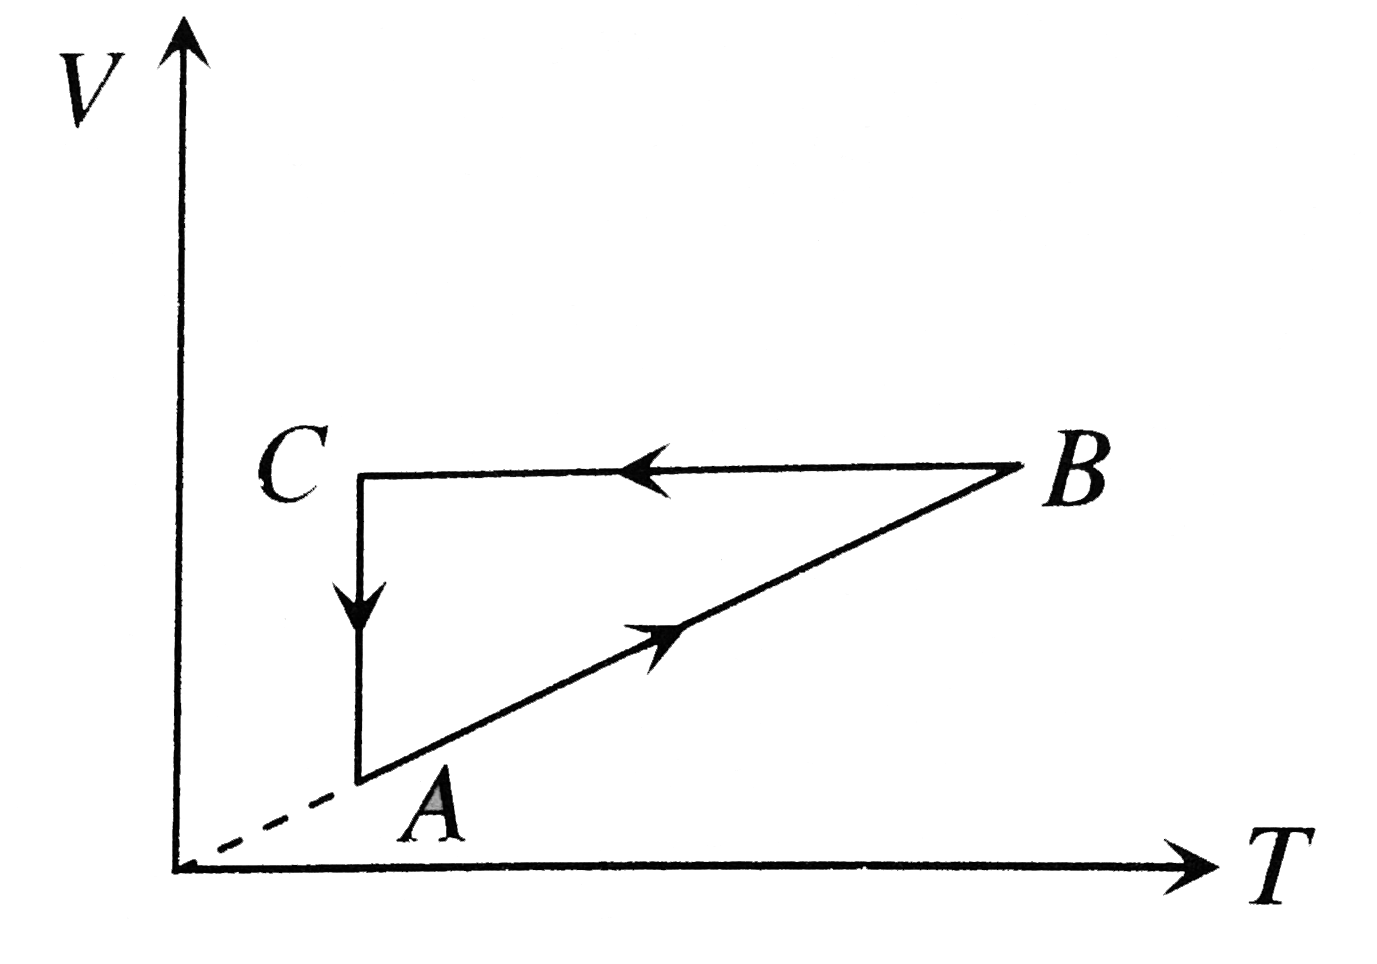
View SolutionA cyclic process ABCA is shown in the V−T diagram process on the P−V
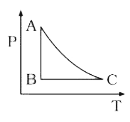
View SolutionAn ideal gas undergoes a cyclic process as shown in the given P-T diagram, where AC is adiabatic. The process is also represented by:
View SolutionThe strain-stress curves of three wire of different materials are shown in the figure. P,Q and R are the elastic limits of the wires. The figures shows that
View SolutionA cyclic process ABCD is shown in the figure P - V diagram. Which of the following curves represent the same process
View Solution

