The process AB is shown in the diagram. As the gas is taken from A to B, its temperature
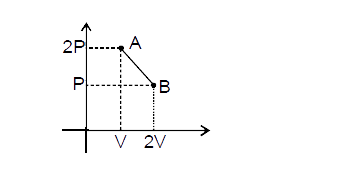
initially increases then decreases
initially decreases then increases
remains constant
variation depends on type of gas
Step by step video & image solution for The process AB is shown in the diagram. As the gas is taken from A to B, its temperature by Physics experts to help you in doubts & scoring excellent marks in Class 12 exams.
Updated on:21/07/2023Topper's Solved these Questions
- KINETIC THEORY OF GASES BOOK - MOTIONCHAPTER - KINETIC THEORY OF GASES EXERCISE - EXERCISE-3 SECTION-A
23 Videos
- KINETIC THEORY OF GASES BOOK - MOTIONCHAPTER - KINETIC THEORY OF GASES EXERCISE - EXERCISE-3 SECTION-B
16 Videos
- KINETIC THEORY OF GASES BOOK - MOTIONCHAPTER - KINETIC THEORY OF GASES EXERCISE - EXERCISE-1
56 Videos
- KINEMATICSBOOK - MOTIONCHAPTER - KINEMATICSEXERCISE - EXERCISE 4 PREVIOUS YEAR (LEVEL 2)
6 Videos
- LOGIC GATESBOOK - MOTIONCHAPTER - LOGIC GATESEXERCISE - EXERCISE - 2
10 Videos
Similar Questions
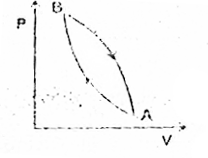
In a cyclic process shown in the figure an ideal gas is adiabatically taken from A to B the work done on the gas during the process A→B is 80 J, when the gas is taken from B to a the heat absorbed by the gas is 40 J. What will be work done by the gas in process B→A?
View Solution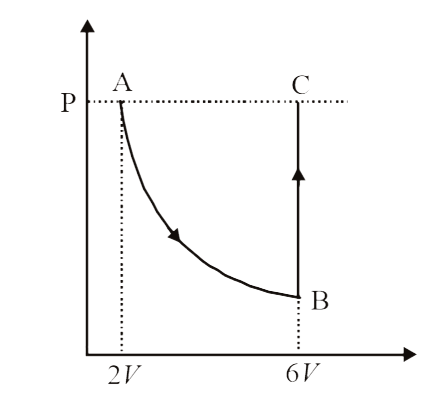
In the figure n mole of a monoatomic ideal gas undergo the process ABC as shown in the P-V diagram. The process AB is isothermal and BC is isochoric. The temperature of the gas at A is T0 total heat given to the gas during the process ABC is measured to be
Q. Temperature of the gas at C is equal to
View Solution
Knowledge Check
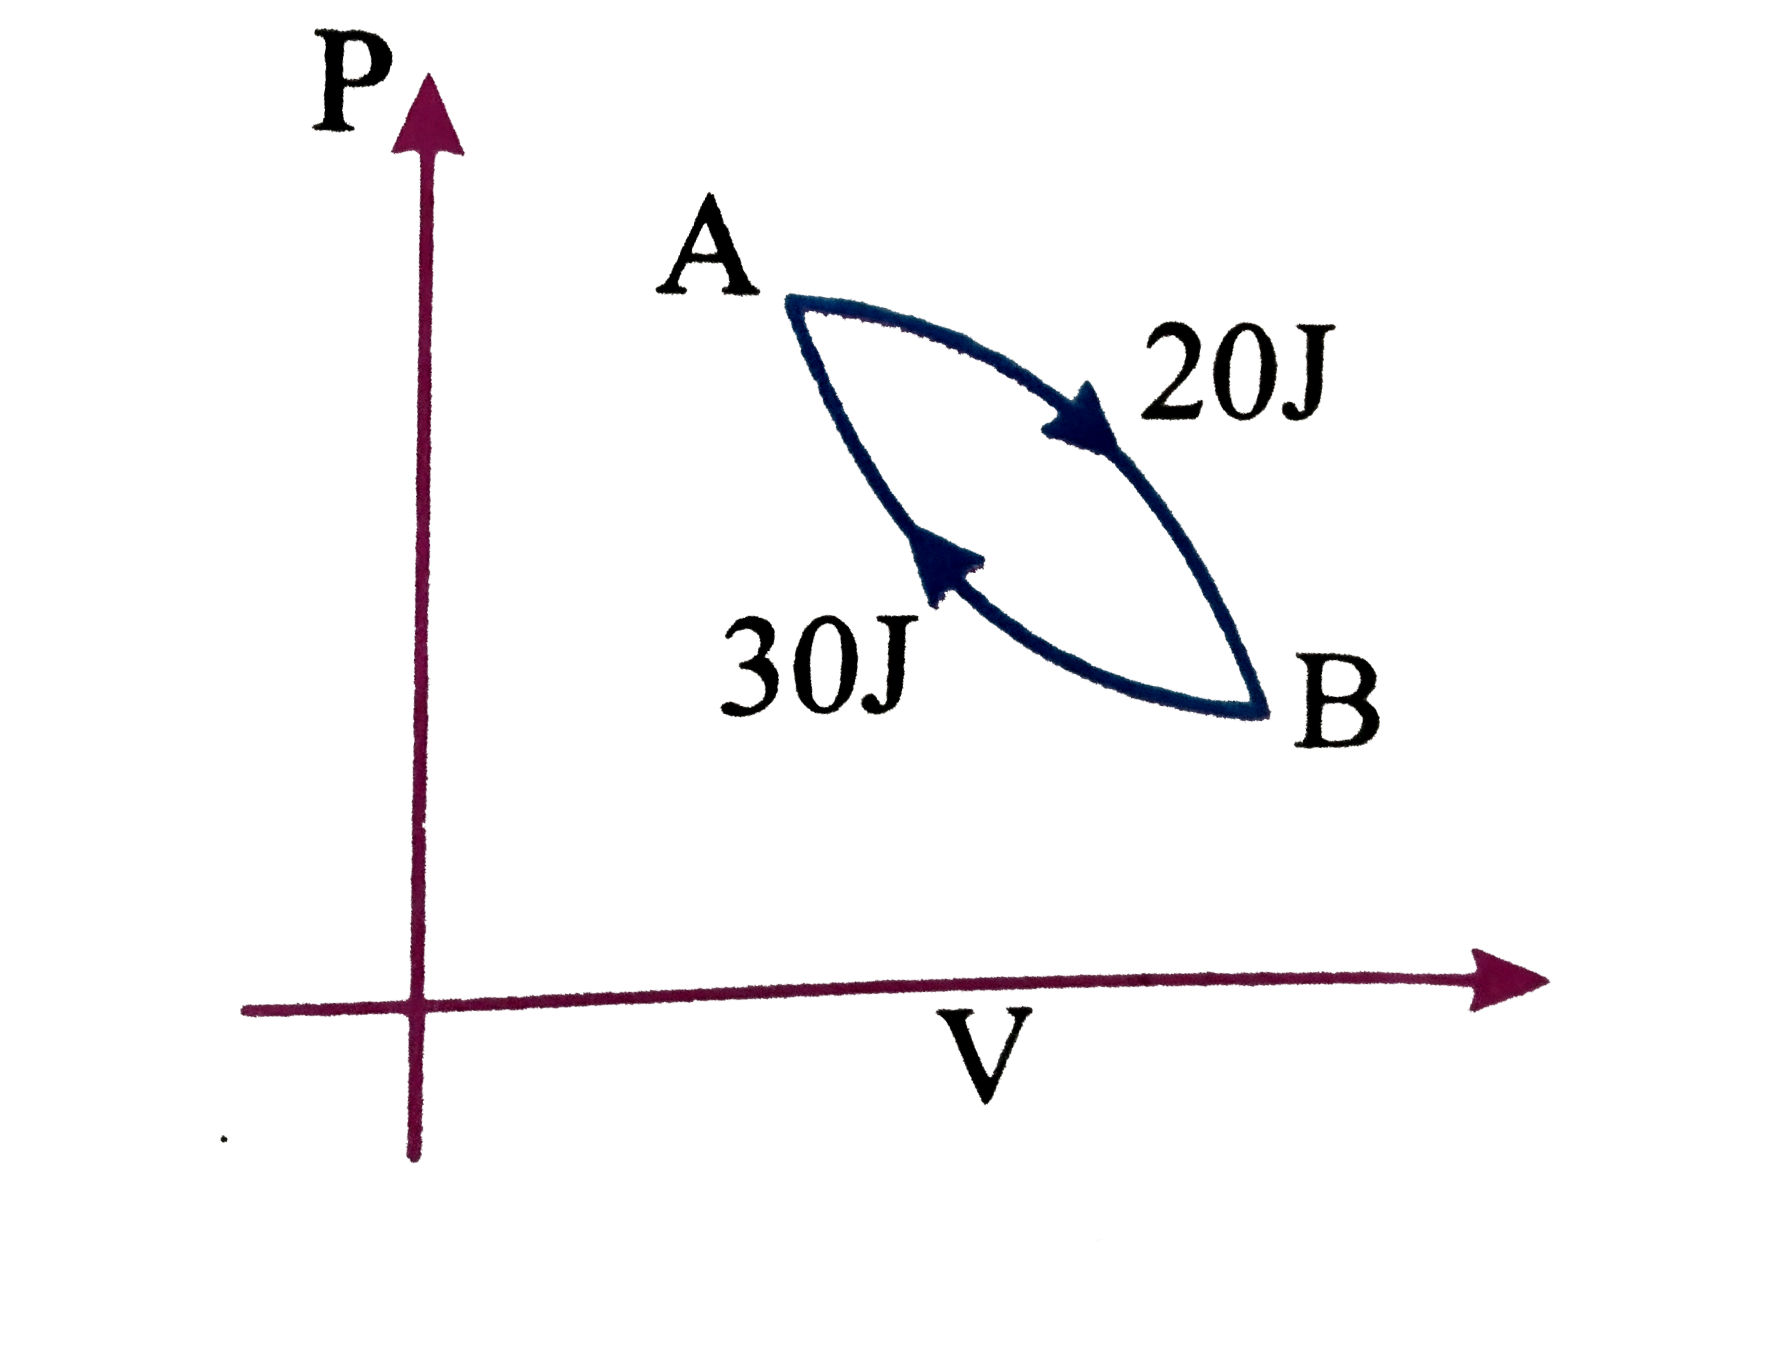
In a cyclic process shown in the figure an ideal gas is adial gas is adiabatically taken from BtoA, the work done on the gas during the process BtoA is 30,J when the gas is taken from A to B the heat absorbed by the gas is 20J Then change in internat energy of the gas in the process A to B is :
 A20JB−30JC50JD−10J
In a cyclic process shown in the figure an ideal gas is adiabatically taken from BtoA, the work done on the gas during the process BtoA is 30,J when the gas is taken from A to B the heat absorbed by the gas is 20J Then change in internal energy of the gas in the process A to B is :
 A20JB−30JC50JD−10J
One mole of an ideal gas is taken through a cyclic process as shown in the V-T diagram. Which of the following statements is true ?
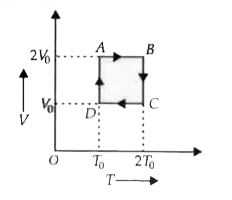 AThe magnitude of work done by the gas is RT0ln2.BWork done by gas is V0T0CNet work done by the gas is zero.DWork done by the gas is 2RT0ln2.
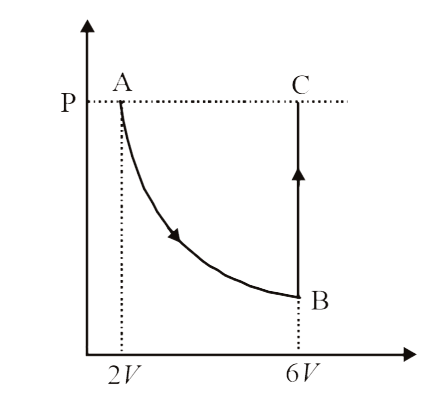
In the figure n mole of a monoatomic ideal gas undergo the process ABC as shown in the P-V diagram. The process AB is isothermal and BC is isochoric. The temperature of the gas at A is T0 total heat given to the gas during the process ABC is measured to be
Q. The average molar heat capacity of the gas in process ABC is
View Solution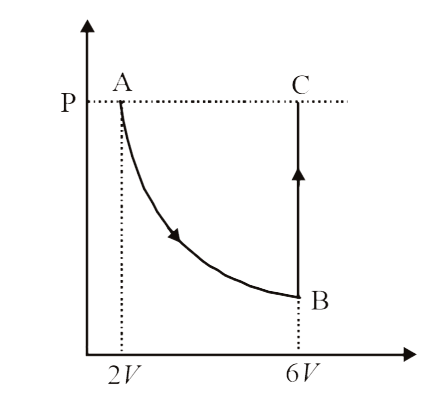
In the figure n mole of a monoatomic ideal gas undergo the process ABC as shown in the P-V diagram. The process AB is isothermal and BC is isochoric. The temperature of the gas at A is T0 total heat given to the gas during the process ABC is measured to be
Q. Heat absorbed by the gas in the process BC
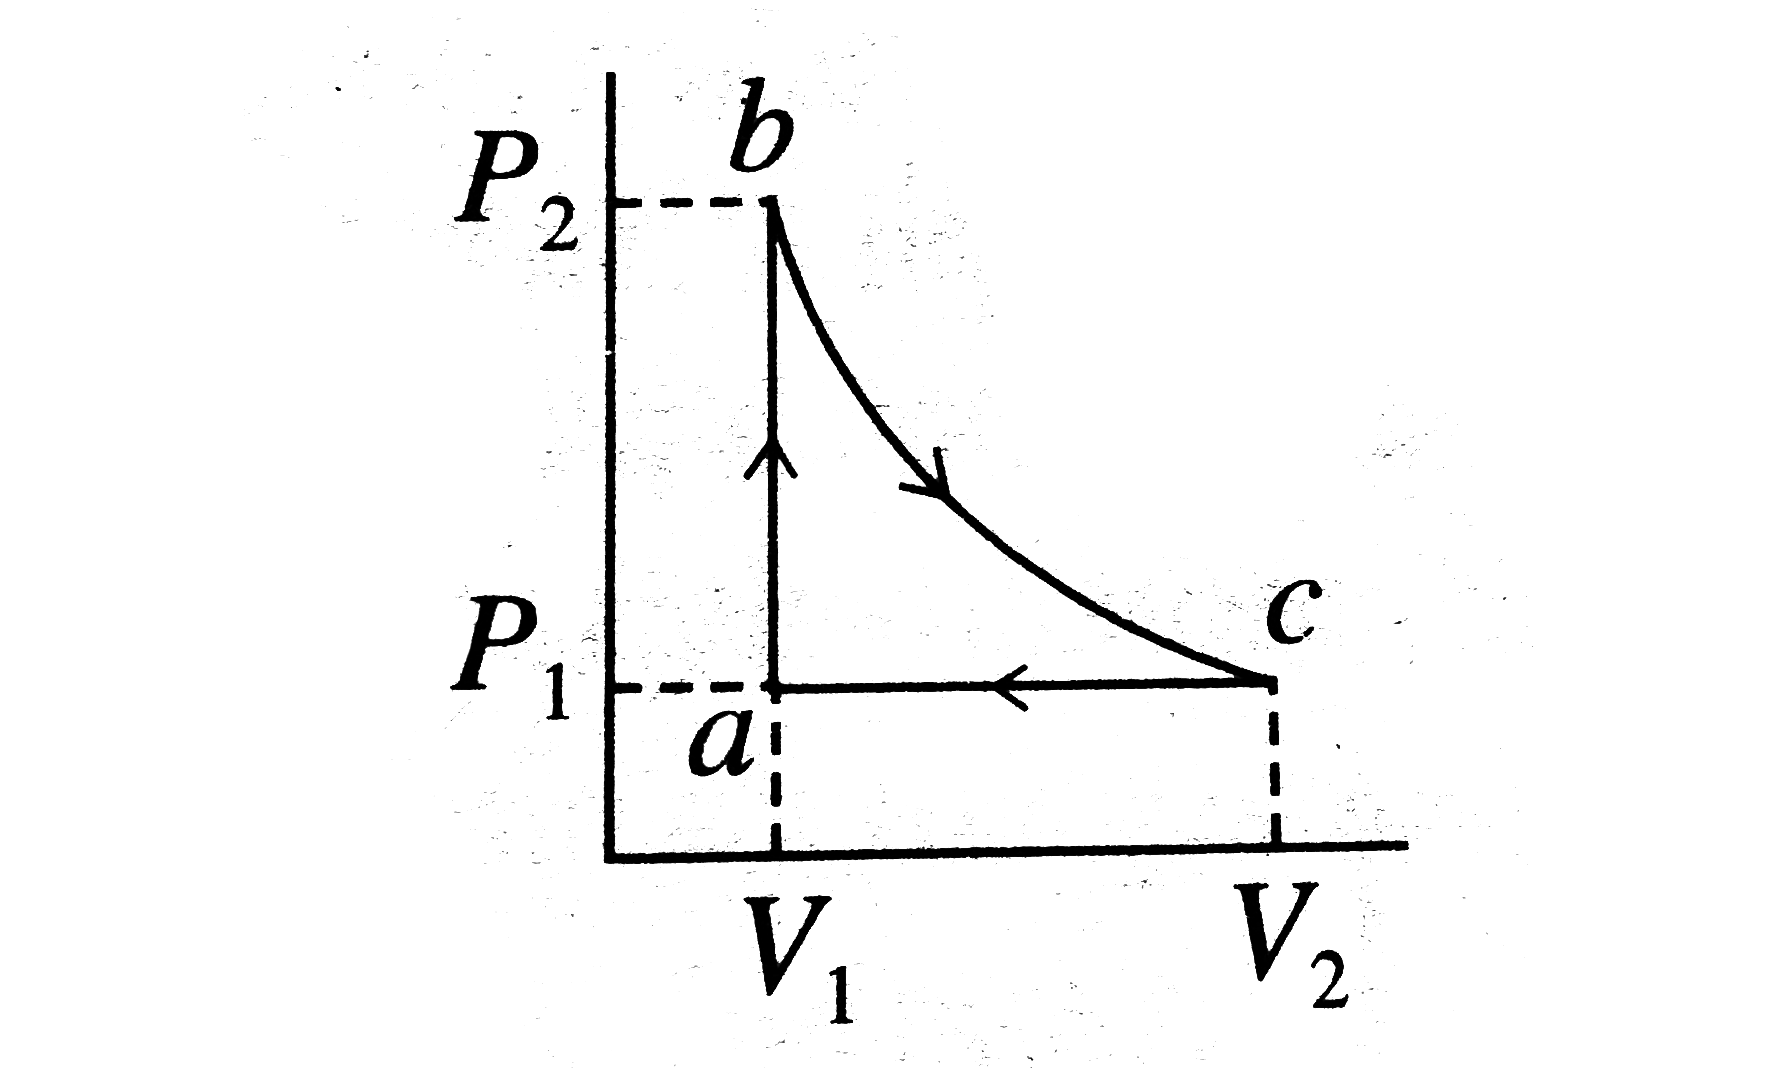
View SolutionCarbon monoxide is carried around a closed cyclic processes abc, in which bc is an isothermal process, as shown in Fig. The gas absorbs 7000J of heat as its temperature is increased from 300K to 1000K in going from a to b. The quantity of heat ejected by the gas during the process ca is
View SolutionTwo moles of helium gas are taken over the cycle ABCDA, as shown in the P-T diagram
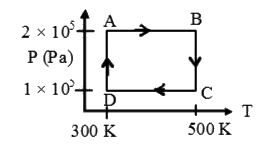
The work done on the gas in taking it from D to A is–
View SolutionTwo moles of helium gas are taken over the cycle ABCDA, as shown in the P-T diagram
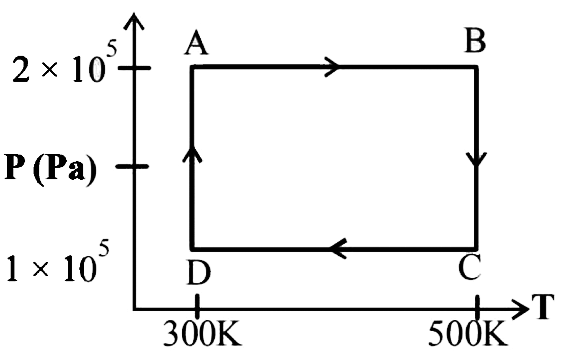
The work done on the gas in taking it from D to A is :
View Solution
