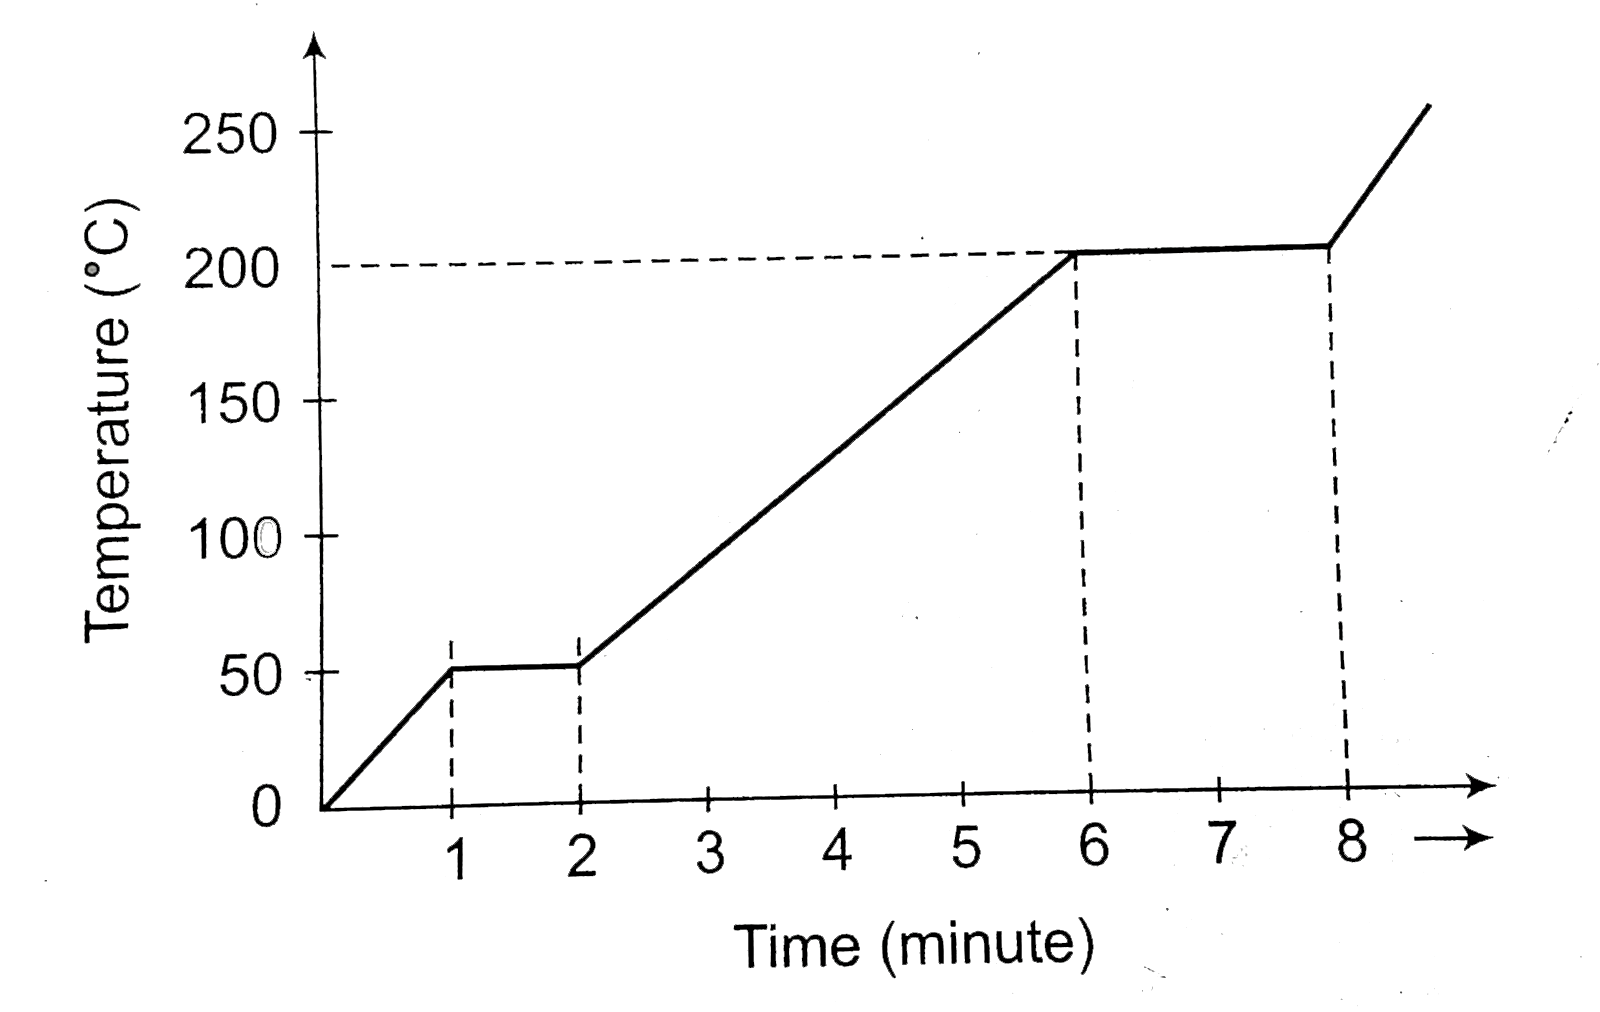
A student takes 50 g wax (specific heat =0.6kcal/kg∘C) and heats it till it boils. The graph between temperature and time is as follows. Heat supplied to the wax per minute and boiling point are respectively.
500cal,50∘C
1000cal,100∘C
1500cal,200∘C
3000cal,200∘C
The correct Answer is:C
Step by step video & image solution for A student takes 50 g wax (specific heat =0.6 kcal//kg^(@)C) and heats it till it boils. The graph between temperature and time is as follows. Heat supplied to the wax per minute and boiling point are respectively. by Physics experts to help you in doubts & scoring excellent marks in Class 12 exams.
Updated on:21/07/2023Topper's Solved these Questions
- CALORIMETRY BOOK - MOTIONCHAPTER - CALORIMETRY EXERCISE - EXERCISE - 3 Section - A
9 Videos
- CALORIMETRY BOOK - MOTIONCHAPTER - CALORIMETRY EXERCISE - EXERCISE - 3 Section - B
4 Videos
- CALORIMETRY BOOK - MOTIONCHAPTER - CALORIMETRY EXERCISE - EXERCISE - 1
29 Videos
- ATOMIC STRUCTURE & X-RAY BOOK - MOTIONCHAPTER - ATOMIC STRUCTURE & X-RAY EXERCISE - Exercise - 2
31 Videos
- Capacitance BOOK - MOTIONCHAPTER - Capacitance EXERCISE - EXERCISE -4 LEVEL II
19 Videos
Similar Questions
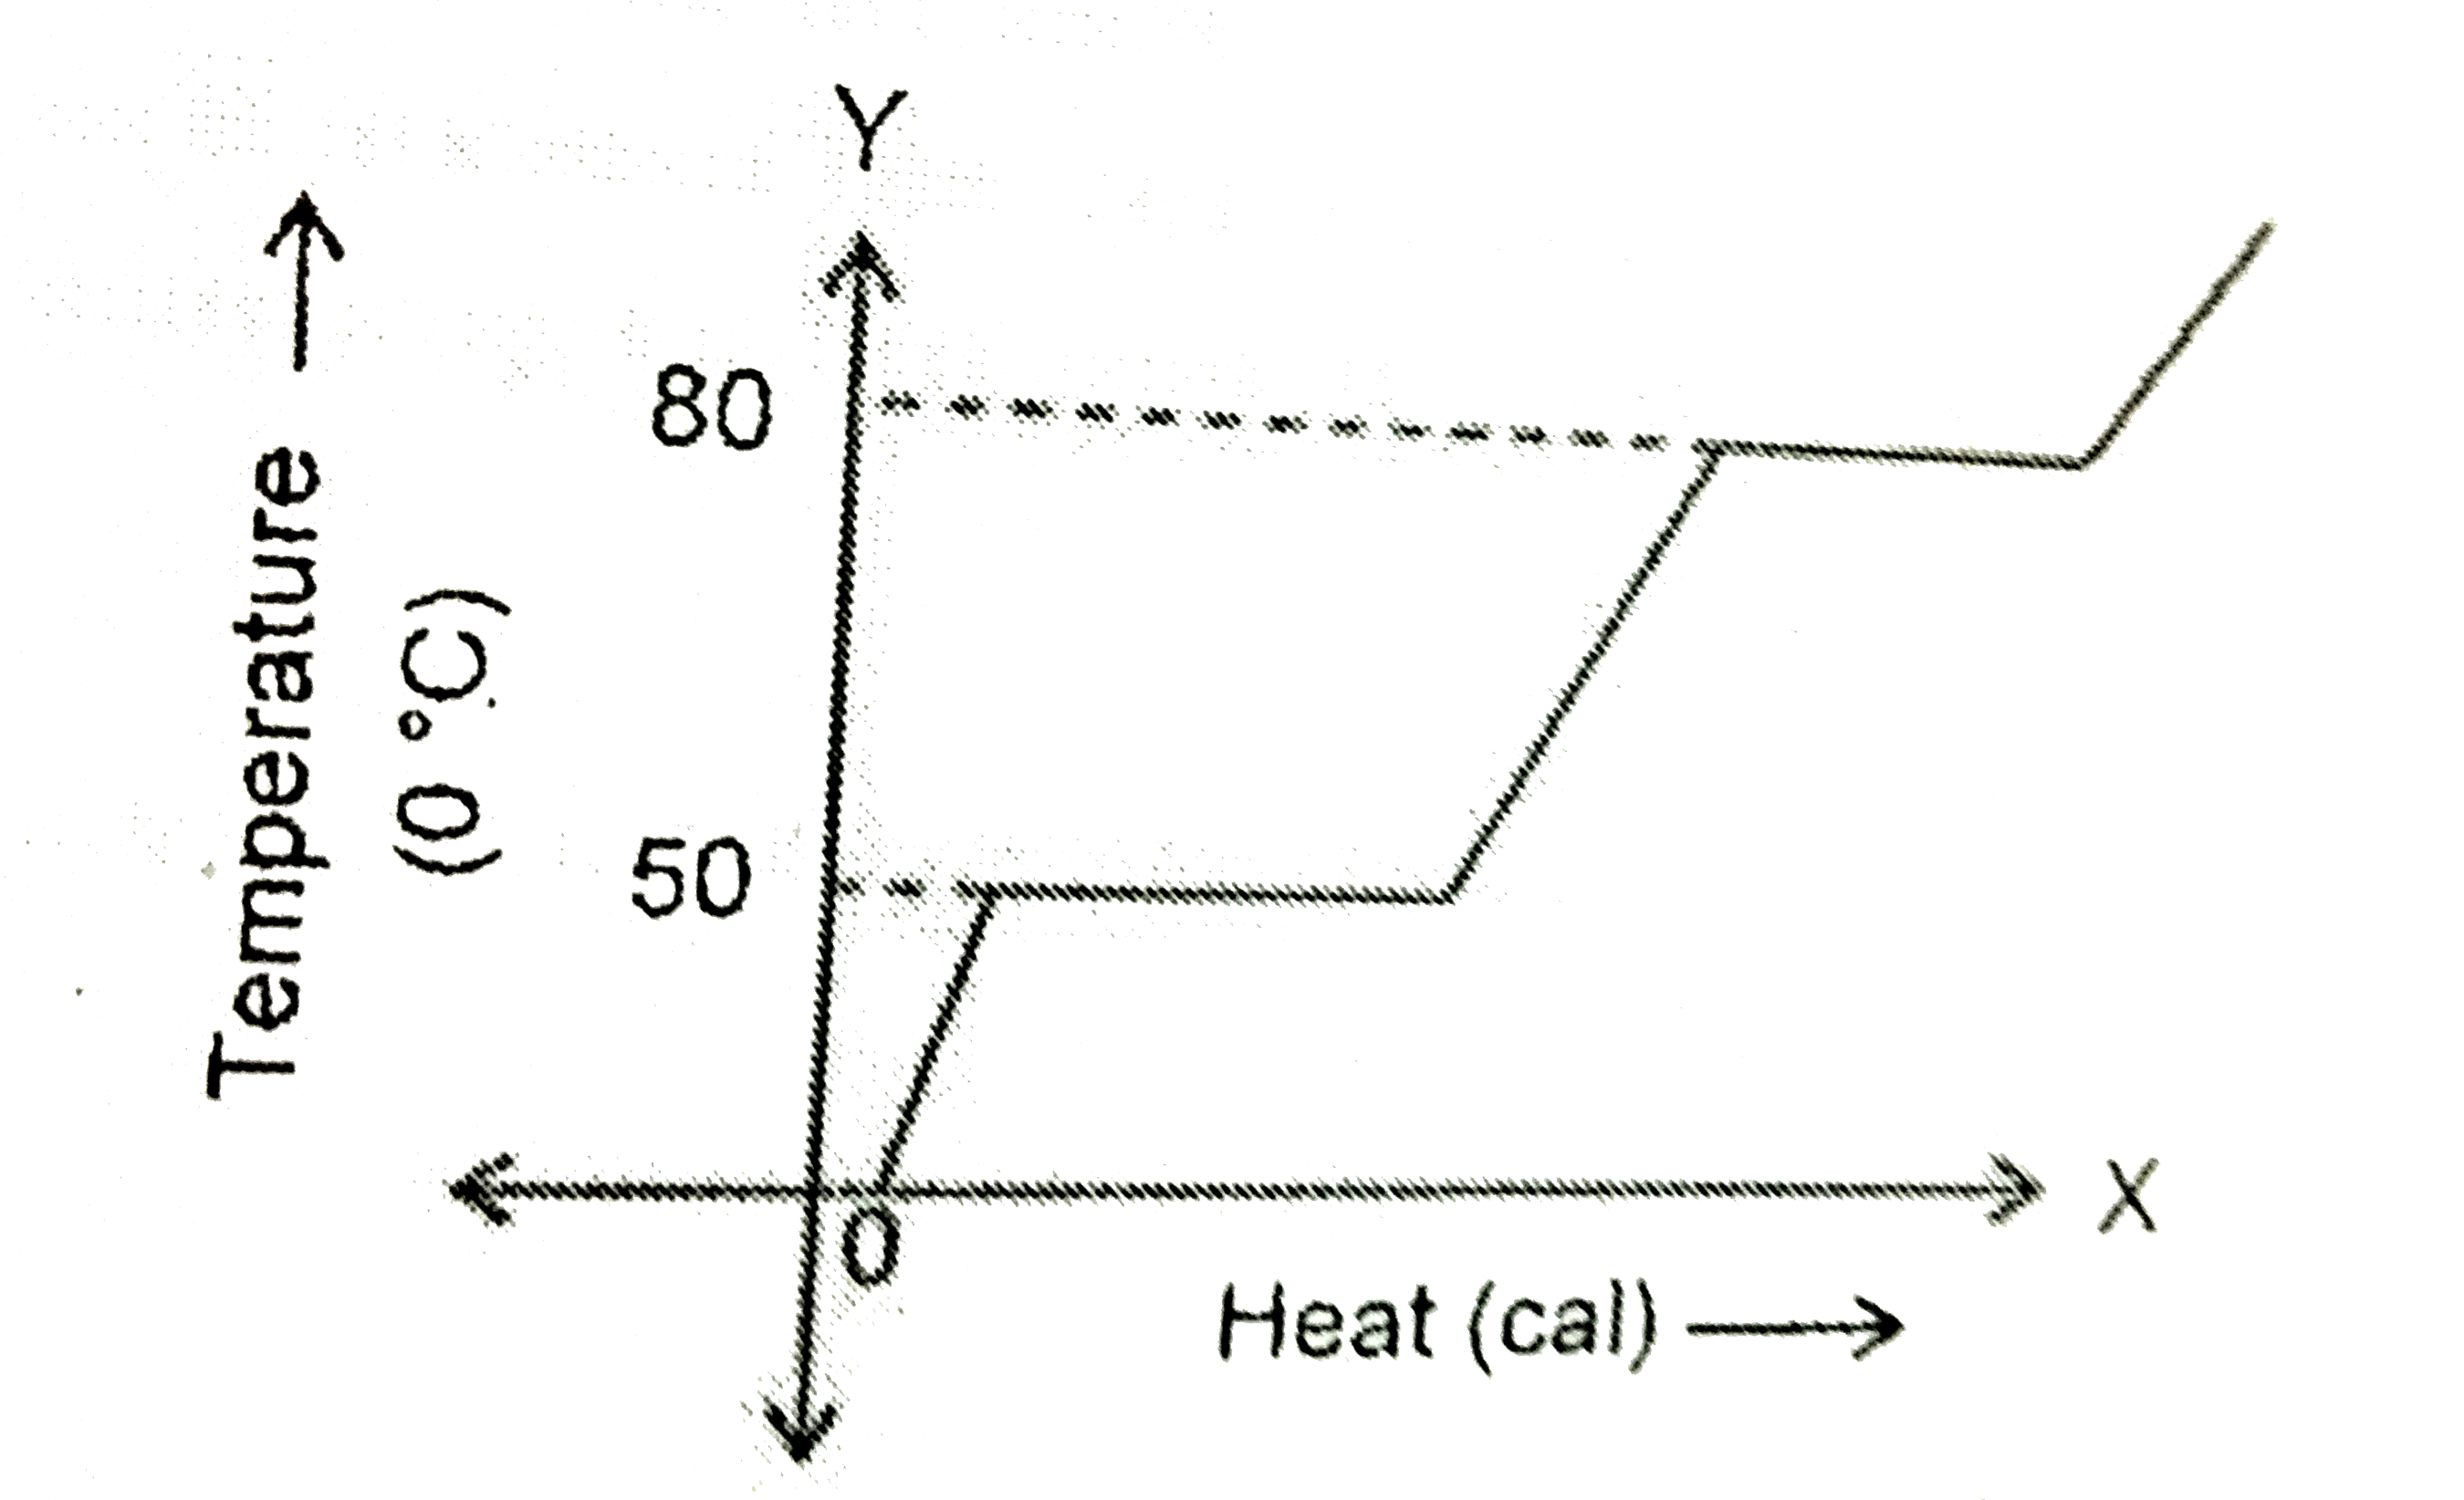
A graph is drawn by taking the rise in temperature on Y axis and heat supplied on x axis .Find out the melting point and boiling point of heat substance

View SolutionA graph is drawn by taking the rise in temperature on Y axis and heat supplied on x axis .Find out the melting point and boiling point of heat substance

View Solution
Knowledge Check
A 10kg iron bar (specific heat 0.11kcal/g∘C) at 80∘C is placed on a block of ice. How much ice melts?
A1.1kgB10kgC16kgD60kgA student takes some water in a beaker and heats it over a flame for determining its boiling point. He keeps on taking its temperature reading. He would observe that the temperature of water :
Akeeps on increasing regularlyBkeeps on increasing ireegularlyCfirst increases slowly, then decreases rapidly and eventually becomes constantDfirst increases gradually and then becomes constantSpecific heat of aluminium is 0.214 cal/g∘C. Heat required to raise the temperature of 40.0 g of Al from 20∘ to 30∘C is
A85.6 calB3.2 calC171.2 calD342.4 cal
A metal piece of 50 g specific heat 0.6 cal/g∘C initially at 120∘C is dropped in 1.6 kg of water at 25∘C. Find the final temperature or mixture.
View SolutionThe specific heat capacity of silver is 0.056kcal/kg.∘C . Explain this statement.
View SolutionHow many joules of heat are absorbed when 70.0 g of water is completely vaporised atits boiling point ?
View SolutionHow many joules of heat are absorbed when 70.0 g of water is completely vaporised atits boiling point ?
View SolutionIf liquefied oxygen at 1 atmospheric pressure is heated from 50K to 300k by supplying heat at constant rate. The graph of temperature vs time will be
View Solution
