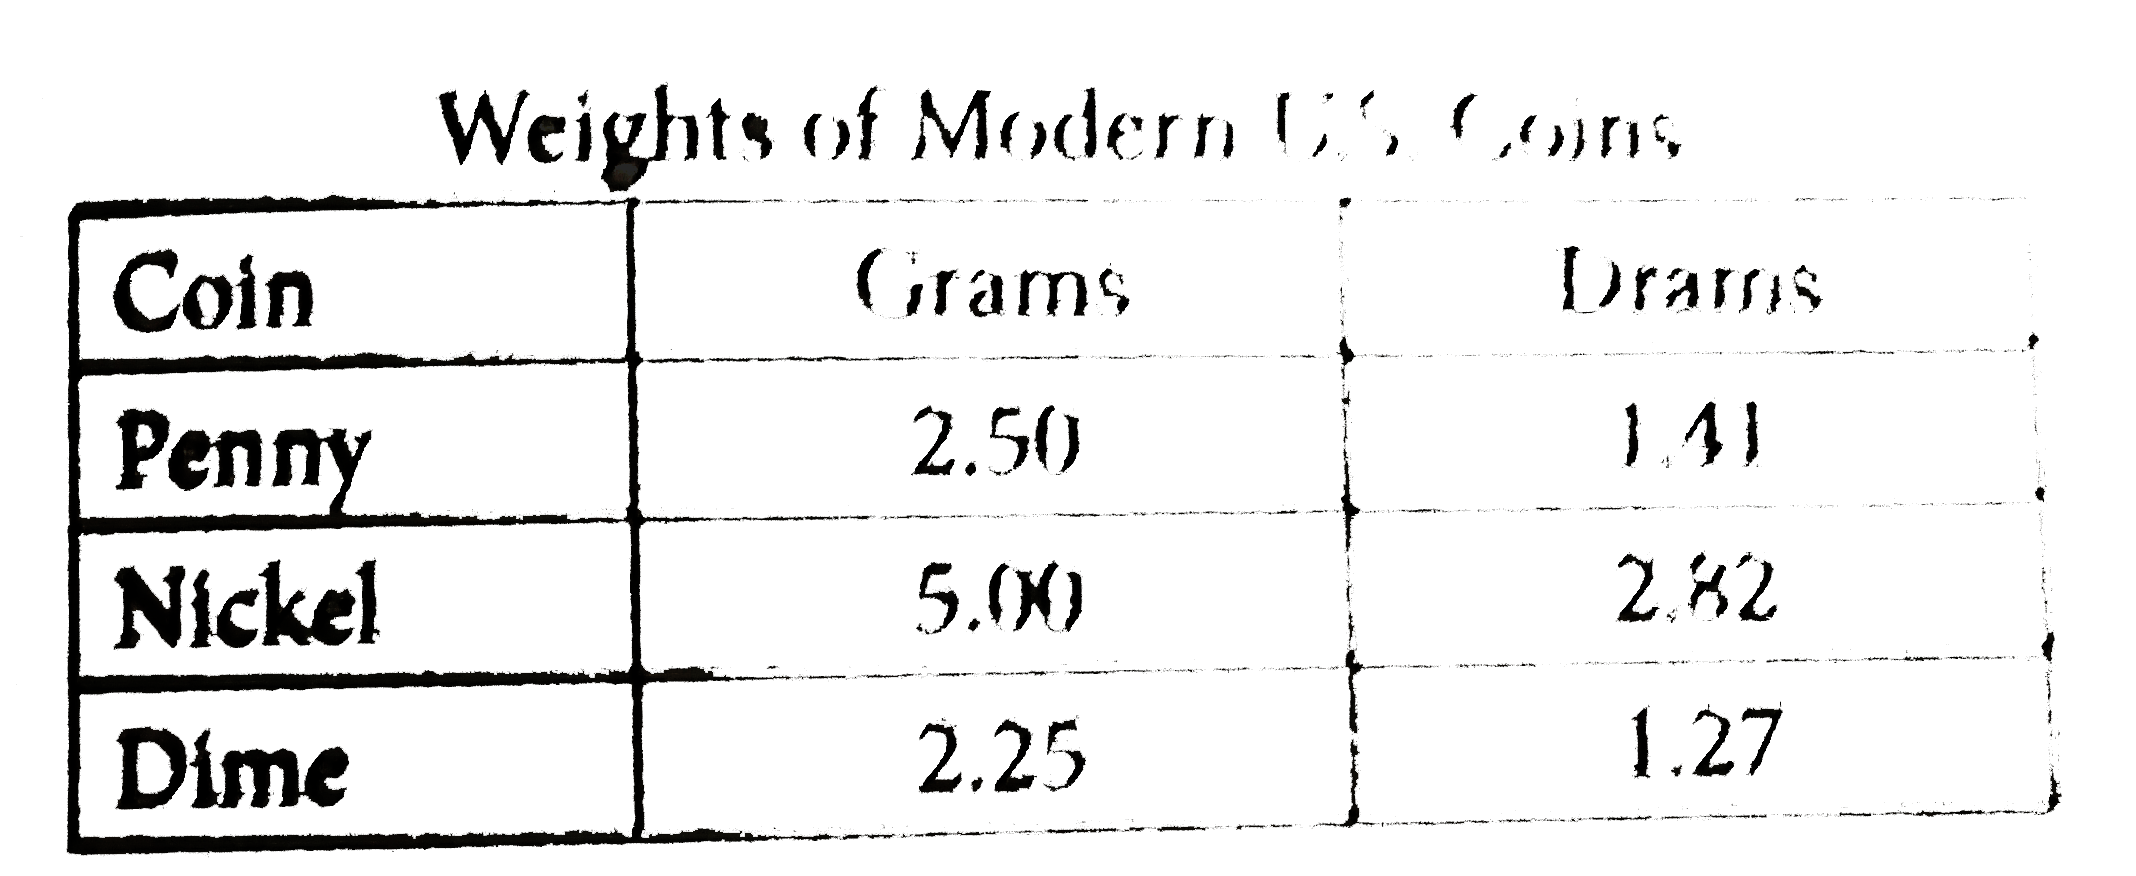
The table above gives the average weight, expressed in both grams and drams, of three types of modern U.S. coins.
IF y grams is equivalent to d drams, of the following. Which best represent the relationship between y and d?
y=1.8d
d=1.8y
yd=1.8
y=0.56d
The correct Answer is:A
Step by step video, text & image solution for The table above gives the average weight, expressed in both grams and drams, of three types of modern U.S. coins. IF y grams is equivalent to d drams, of the following. Which best represent the relationship between y and d? by Maths experts to help you in doubts & scoring excellent marks in Class 12 exams.
Topper's Solved these Questions
Similar Questions
A certain homeowner uses a gas edger to clean up his lawn every time he mows. If the edger uses 160 milliliters of fuel each time, what is the maximum number of times the homeowner can edge his lawn with 8 litres of fuel?( 1 liter = 1,000 milliliters)
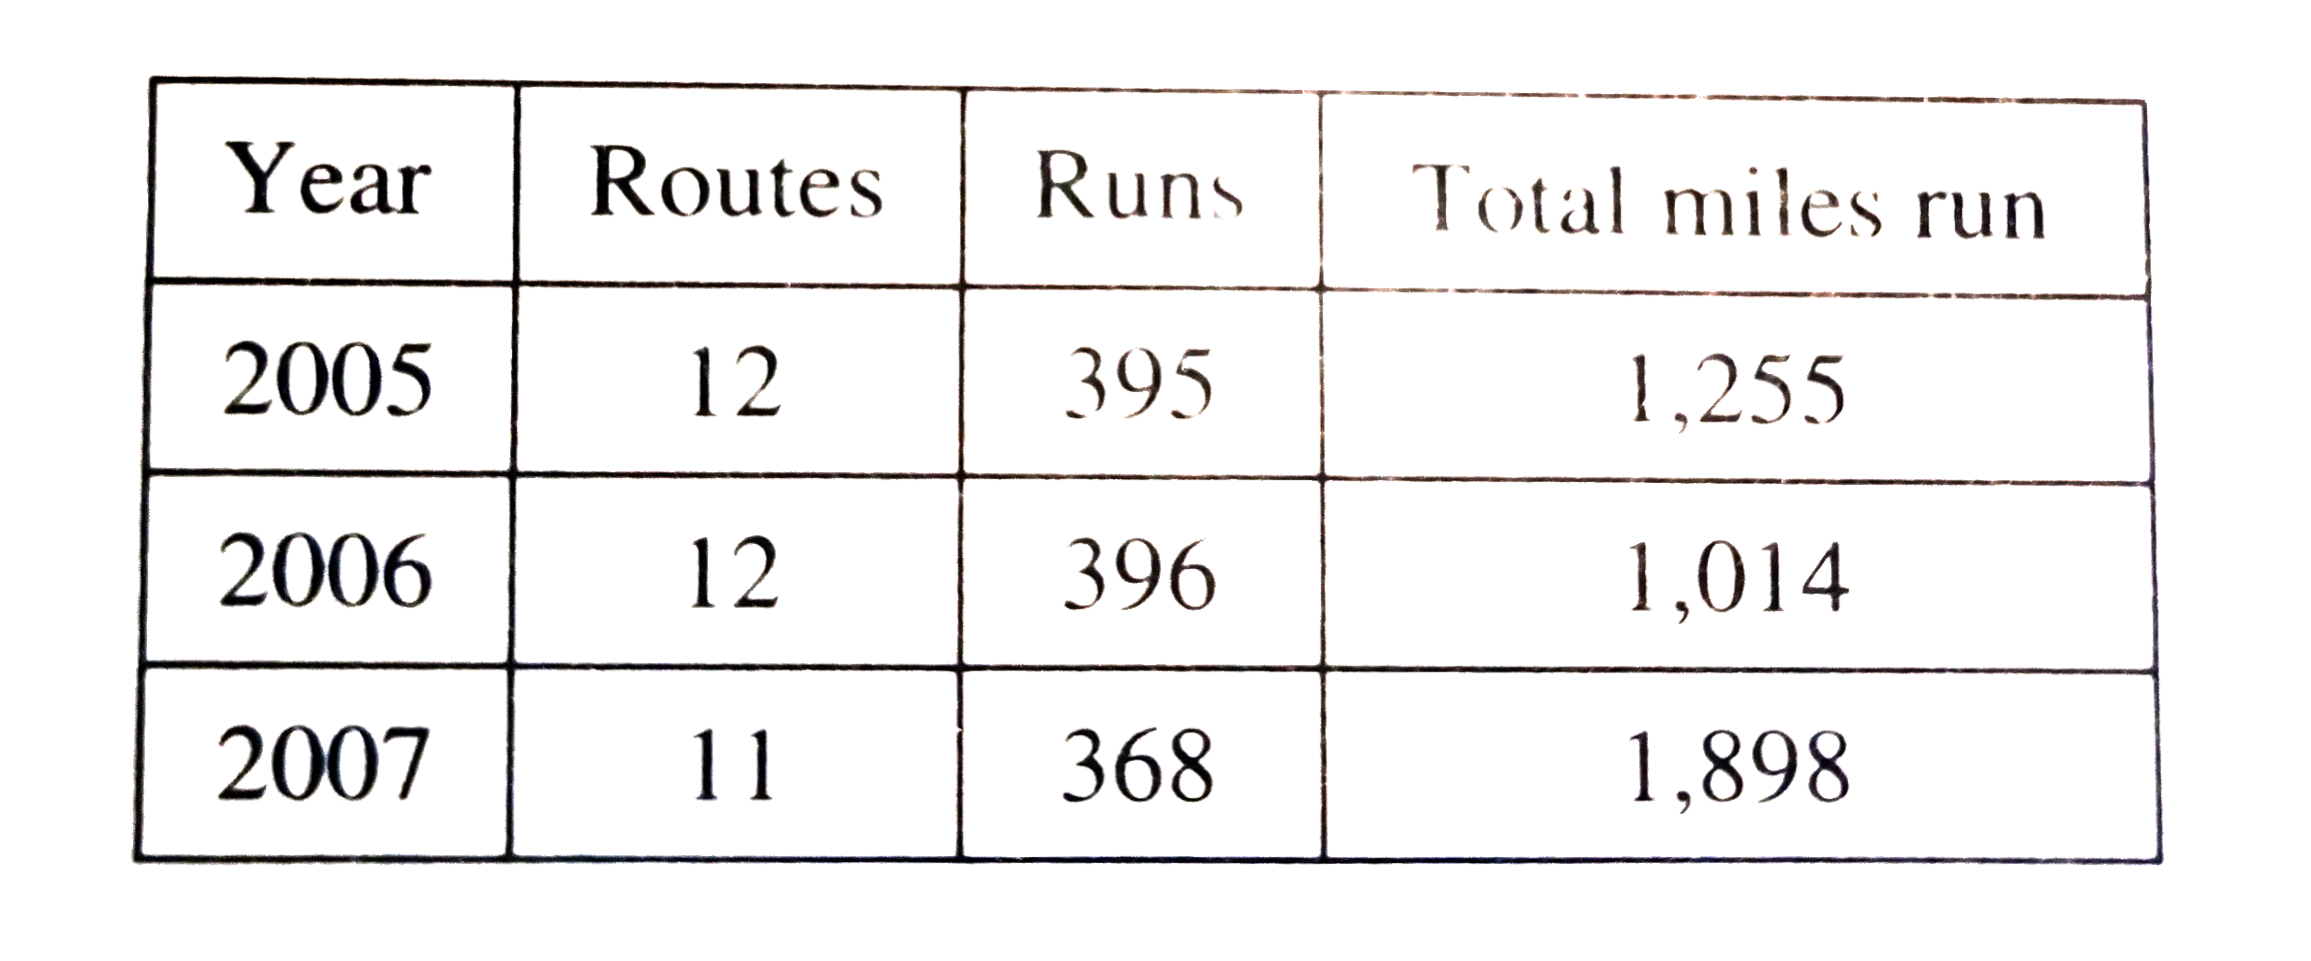
View SolutionFor each of 3 years , the table below gives the number of different routes a runner ran , the number of runs she ran , and the total number of miles she ran .

To the nearest tenth of a mile , what is the average number of miles the runner ran per run in 2005 ?01:37View SolutionIF the function g is defined by g(x)=3x+5, what is the value of g(-5)?
06:07View SolutionMatch the following lists:
 02:11View Solution
How many lines of symmetry does the above figure have ?
01:31View SolutionWhich of the following are correct chain isomers of butane ? (i)
02:45View SolutionDetermine the point of symmetry of a regular hexagon.
02:17View SolutionDtermine the images of the following figure about the given line :
05:41View SolutionMatch the following Column A to Column B
 02:10View Solution
Match the following Column A to Column B
 02:17View Solution
Match the following Column A to Column B
 02:10View Solution
The inequation represented by the graph given below is :
04:23View SolutionThe inequation that best describes the graph given below is _________
02:41View SolutionThe inequation that best describes the following graph is _________
03:12View SolutionWhich inequations represent the shaded region in the given figure
07:33View Solution

