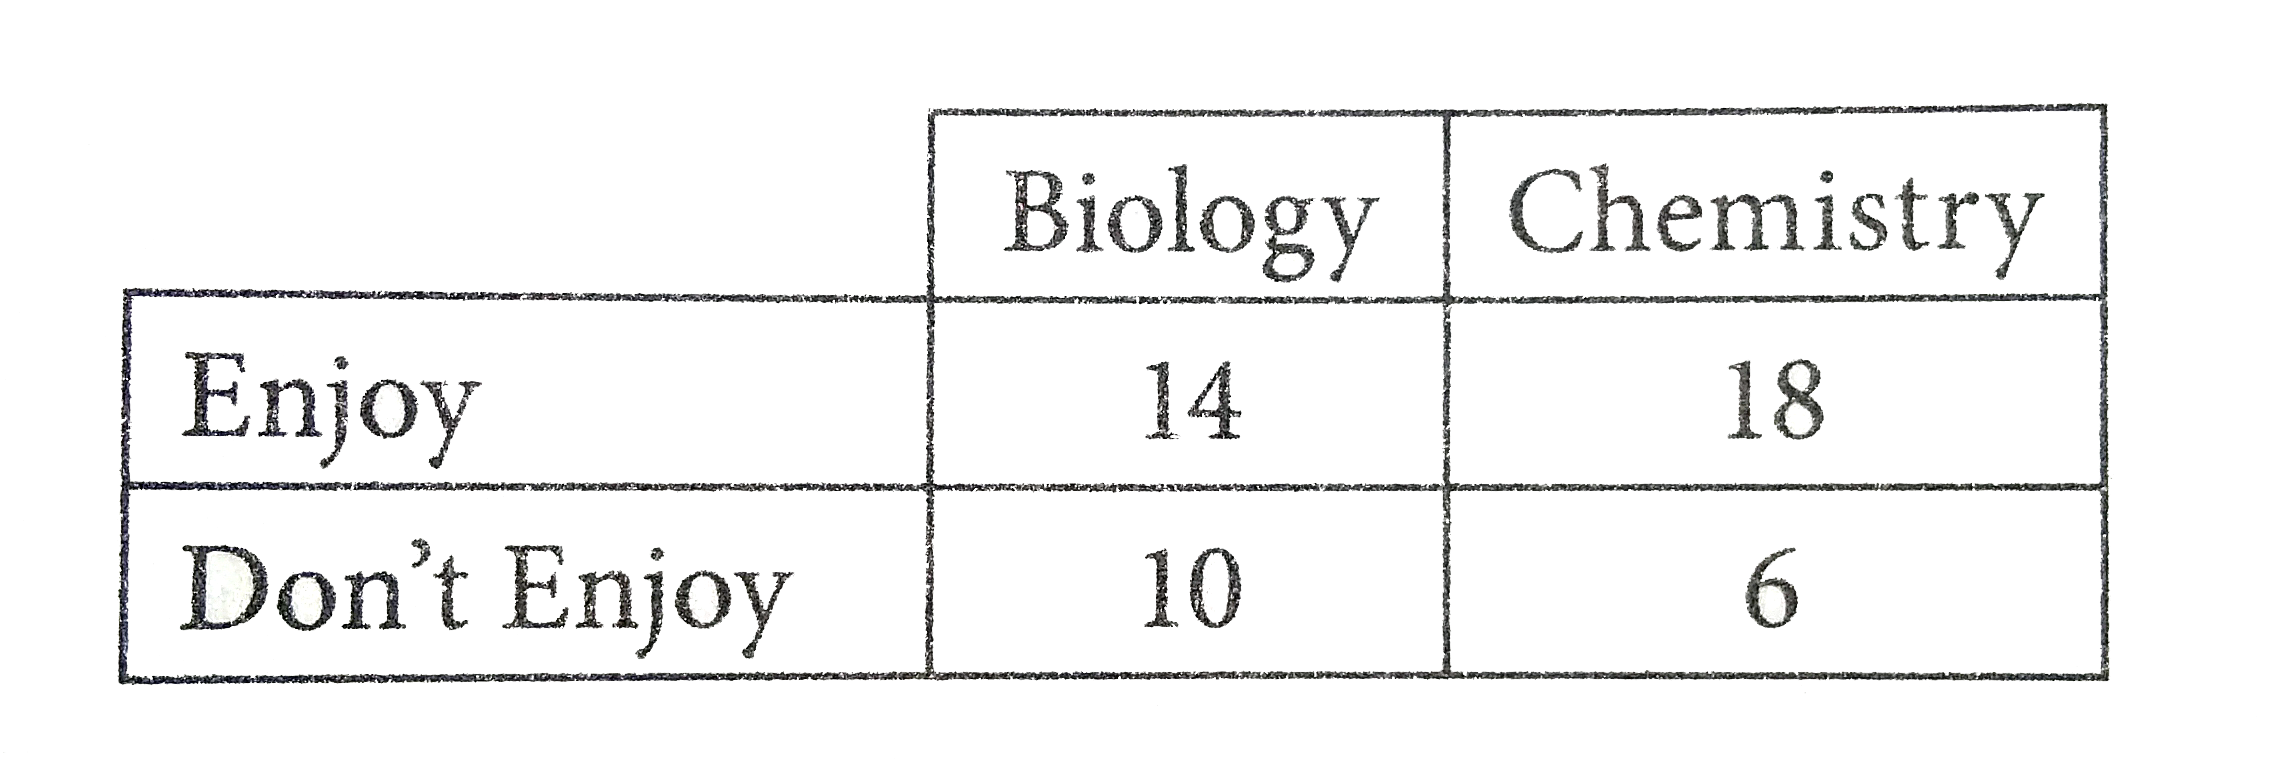
A group of 24 students was polled as to whether they enoy biology class, chemistry class, both , or neither The results are shown in the table below:

Given the above data, which of the following conclusions is true?
The ratio of those who enjoy biology class to those who enjoy chemistry class is 7:8.
The ratio of those who enjoy chemistry class to those who don't enjoy chemistry class is 9:4.
The ratio of those who enjoy biology class to those who don't enjoy chemistry class is 7:2
The ratio of those who don't enjoy biology class to those who enjoy chemistry class is 5:9.
The correct Answer is:D
Step by step video, text & image solution for A group of 24 students was polled as to whether they enoy biology class, chemistry class, both , or neither The results are shown in the table below: Given the above data, which of the following conclusions is true? by Maths experts to help you in doubts & scoring excellent marks in Class 12 exams.
Topper's Solved these Questions
Similar Questions
IF 3y=y+2, what is the value of 2y?
01:37View SolutionThe population ,P, of town Y since 1995 can be estimated by the equation P=1.0635x+3,250, where x is the number of years since 1995 and 0≤x≤20. In the context of this equation, what does the number 1.0635 most likely represent?
06:07View SolutionFor i=√−1, what is the sum of (5+2i)+(−7+30i)?
02:11View SolutionHow many lines of symmetry does the above figure have ?
01:31View SolutionWhich of the following are correct chain isomers of butane ? (i)
02:45View SolutionDetermine the point of symmetry of a regular hexagon.
02:17View SolutionDtermine the images of the following figure about the given line :
05:41View SolutionMatch the following Column A to Column B
 03:28View Solution
Match the following Column A to Column B
 02:31View Solution
Match the following Column A to Column B
 02:21View Solution
Find the area of figure given below.
 02:03View Solution
Find the perimeter of the figure given below.
 02:10View Solution
Find the area of the figure given below.
 02:17View Solution
The area of the shaded part in the figure given below is ______.
 02:10View Solution
The inequation represented by the graph given below is :
04:23View SolutionThe inequation that best describes the graph given below is _________
01:59View Solution

