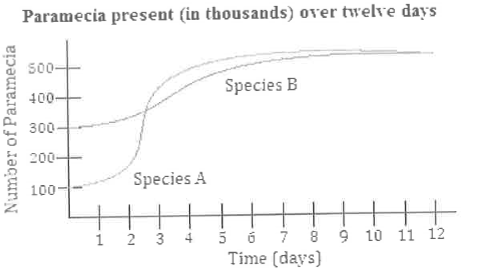
A small puddle is monitored by scientists for the number of paramecia present. The scientists are in two distinct species, let's call them ''species A'' and ''species B''. At time t = 0, the scientists measure and estimate the amount of species A and species B present in the puddle. They then proceed to measure and record the number of each species of paramecium present every hour for 12 days. the data for each species were then fit by a smooth curve, as shown in the graph above. Which of the following is a correct statement about the data above?
At time t = 0, the number species B present is 150% greater than the number of species A present
At time t = 0, the number of species A present is 75% less than the number of species B present
For the first 3 days, the average growth rate of species B is higher than the average growth rate of species A.
The growth rate of both rate of both species A and species B decreases for the last 8 days.
The correct Answer is:D
Similar Questions
Knowledge Check
The scientist who first gave the dynamic concept of species
AJulian HuxleyBLinnaeusCLamarckDJohn RayIn which species O-O bond is present
AS2O−28BS4O−26CSO−23DS2O−27
What type of species are usually present in the atmosphere ?
View SolutionHow do ecologists estimate the total number of species present in the world?
View SolutionHow do ecologists estimate the total number of species present in the world?
View SolutionHow do ecologists estimate the total number of species present in the world?
View SolutionHow do scientists extrapolate the total number of species on earth ?
View SolutionHow do scientists extrapolate the total number of species on earth ?
View Solution
