A survey was conducted among a randomly chosen sample of 100 males and 100 females to gather data on family size. The data are shown in the table below.
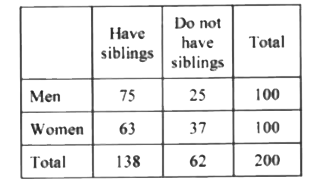
Which of the following is closest to the perecent of those surveyed who have siblings?
31
63
69
75
The correct Answer is:C
Step by step video, text & image solution for A survey was conducted among a randomly chosen sample of 100 males and 100 females to gather data on family size. The data are shown in the table below. Which of the following is closest to the perecent of those surveyed who have siblings? by Maths experts to help you in doubts & scoring excellent marks in Class 12 exams.
Similar Questions
A survey was conducted among a randomly chosen sample of 250 single woman about whether they owned and dogs or cats. The table below displays a summery of the survey results.
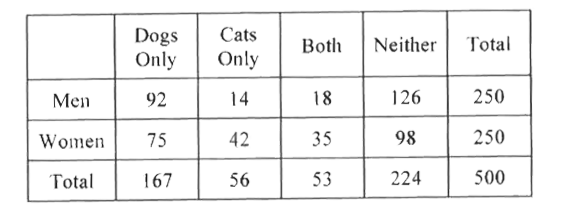
What fraction of the people surveyed who said they own dogs are women?View SolutionIn State X,Mr. Camp’s eighth-grade class consisting of 26 students was surveyed and 34.6percent of the students reported that they had at least two siblings. The average eighth‑grade class size in the state is 26. If the students in Mr. Camp’s class are representative of students in the state’s eighth-grade classes and there are 1,800 eighth-grade classes in the state, which of the following best estimates the number of eighth‑grade students in the state who have fewer than two siblings?
View Solution
Knowledge Check
- Question 1 - Select One
A survey was conducted among a randomly chosen sample of 250 single men and 250 single women about whether they owned any dogs or cats. The table below displays a summary of the survey results.
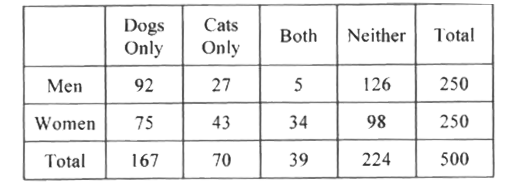
According to the table, which of the following statements is most likely to be false?AThe porability that a woman is a cat owner is greater than the probability that a cat owner is a womanBThe probability that a dog owner is male is greater than the probability that a randomly chosen person is a cat owner.CThe probability that a woman does not own a dog or cat is greater than the probability that a man owns at least one dog and one cat.DThe probability that a cat owner is a woman is greater than the probability that a men owns a dog. - Question 2 - Select One
A survey was conducted among a randomly chosen sample of 250 single men and 250 single women about whether they owned any dogs or cats. The table below displays a summary of the survey results.
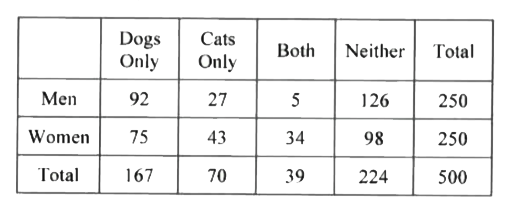
According to the table, which of the following statements is true?AThe number of men that reported they had any pets is greater than the number of people that reported they had dogs only.BThe number of people that reported they had any pets is less than twice the number of women that reported they had dogs only.CThe percentage of men that reported they had dogs only is less than the percentage of people that reported they had cats only.DThe percentage of women that reported they had any pets is greater than the percentage of people that reported they did not have any pets. - Question 3 - Select One

A group of tenth-grade students responded to a survey that asked which math course they were currently enrolled in. The survey data were broken down as shown in the table above. Which of the following categories accounts for approximately 19 percent of all the survey respondents?AFemales taking GeometryBFemales taking Algebra IICMales taking GeometryDMales taking Algebra I
Each month. The Bureau of Labor Statistics conducts a survey called the Current Population Survey (CPS) to measure unemployement in the United States. Across the country, about 60,000 households are included in the survey sample. These households are grouped by geographic region. A summery of the January 2014 survey results for make responds in one geographica region is shown in the table below.

Q. If one unemployed man from this sample is chosen at random for a follow-up survey, what is the probability that he will be between the ages of 45 to 54?View Solution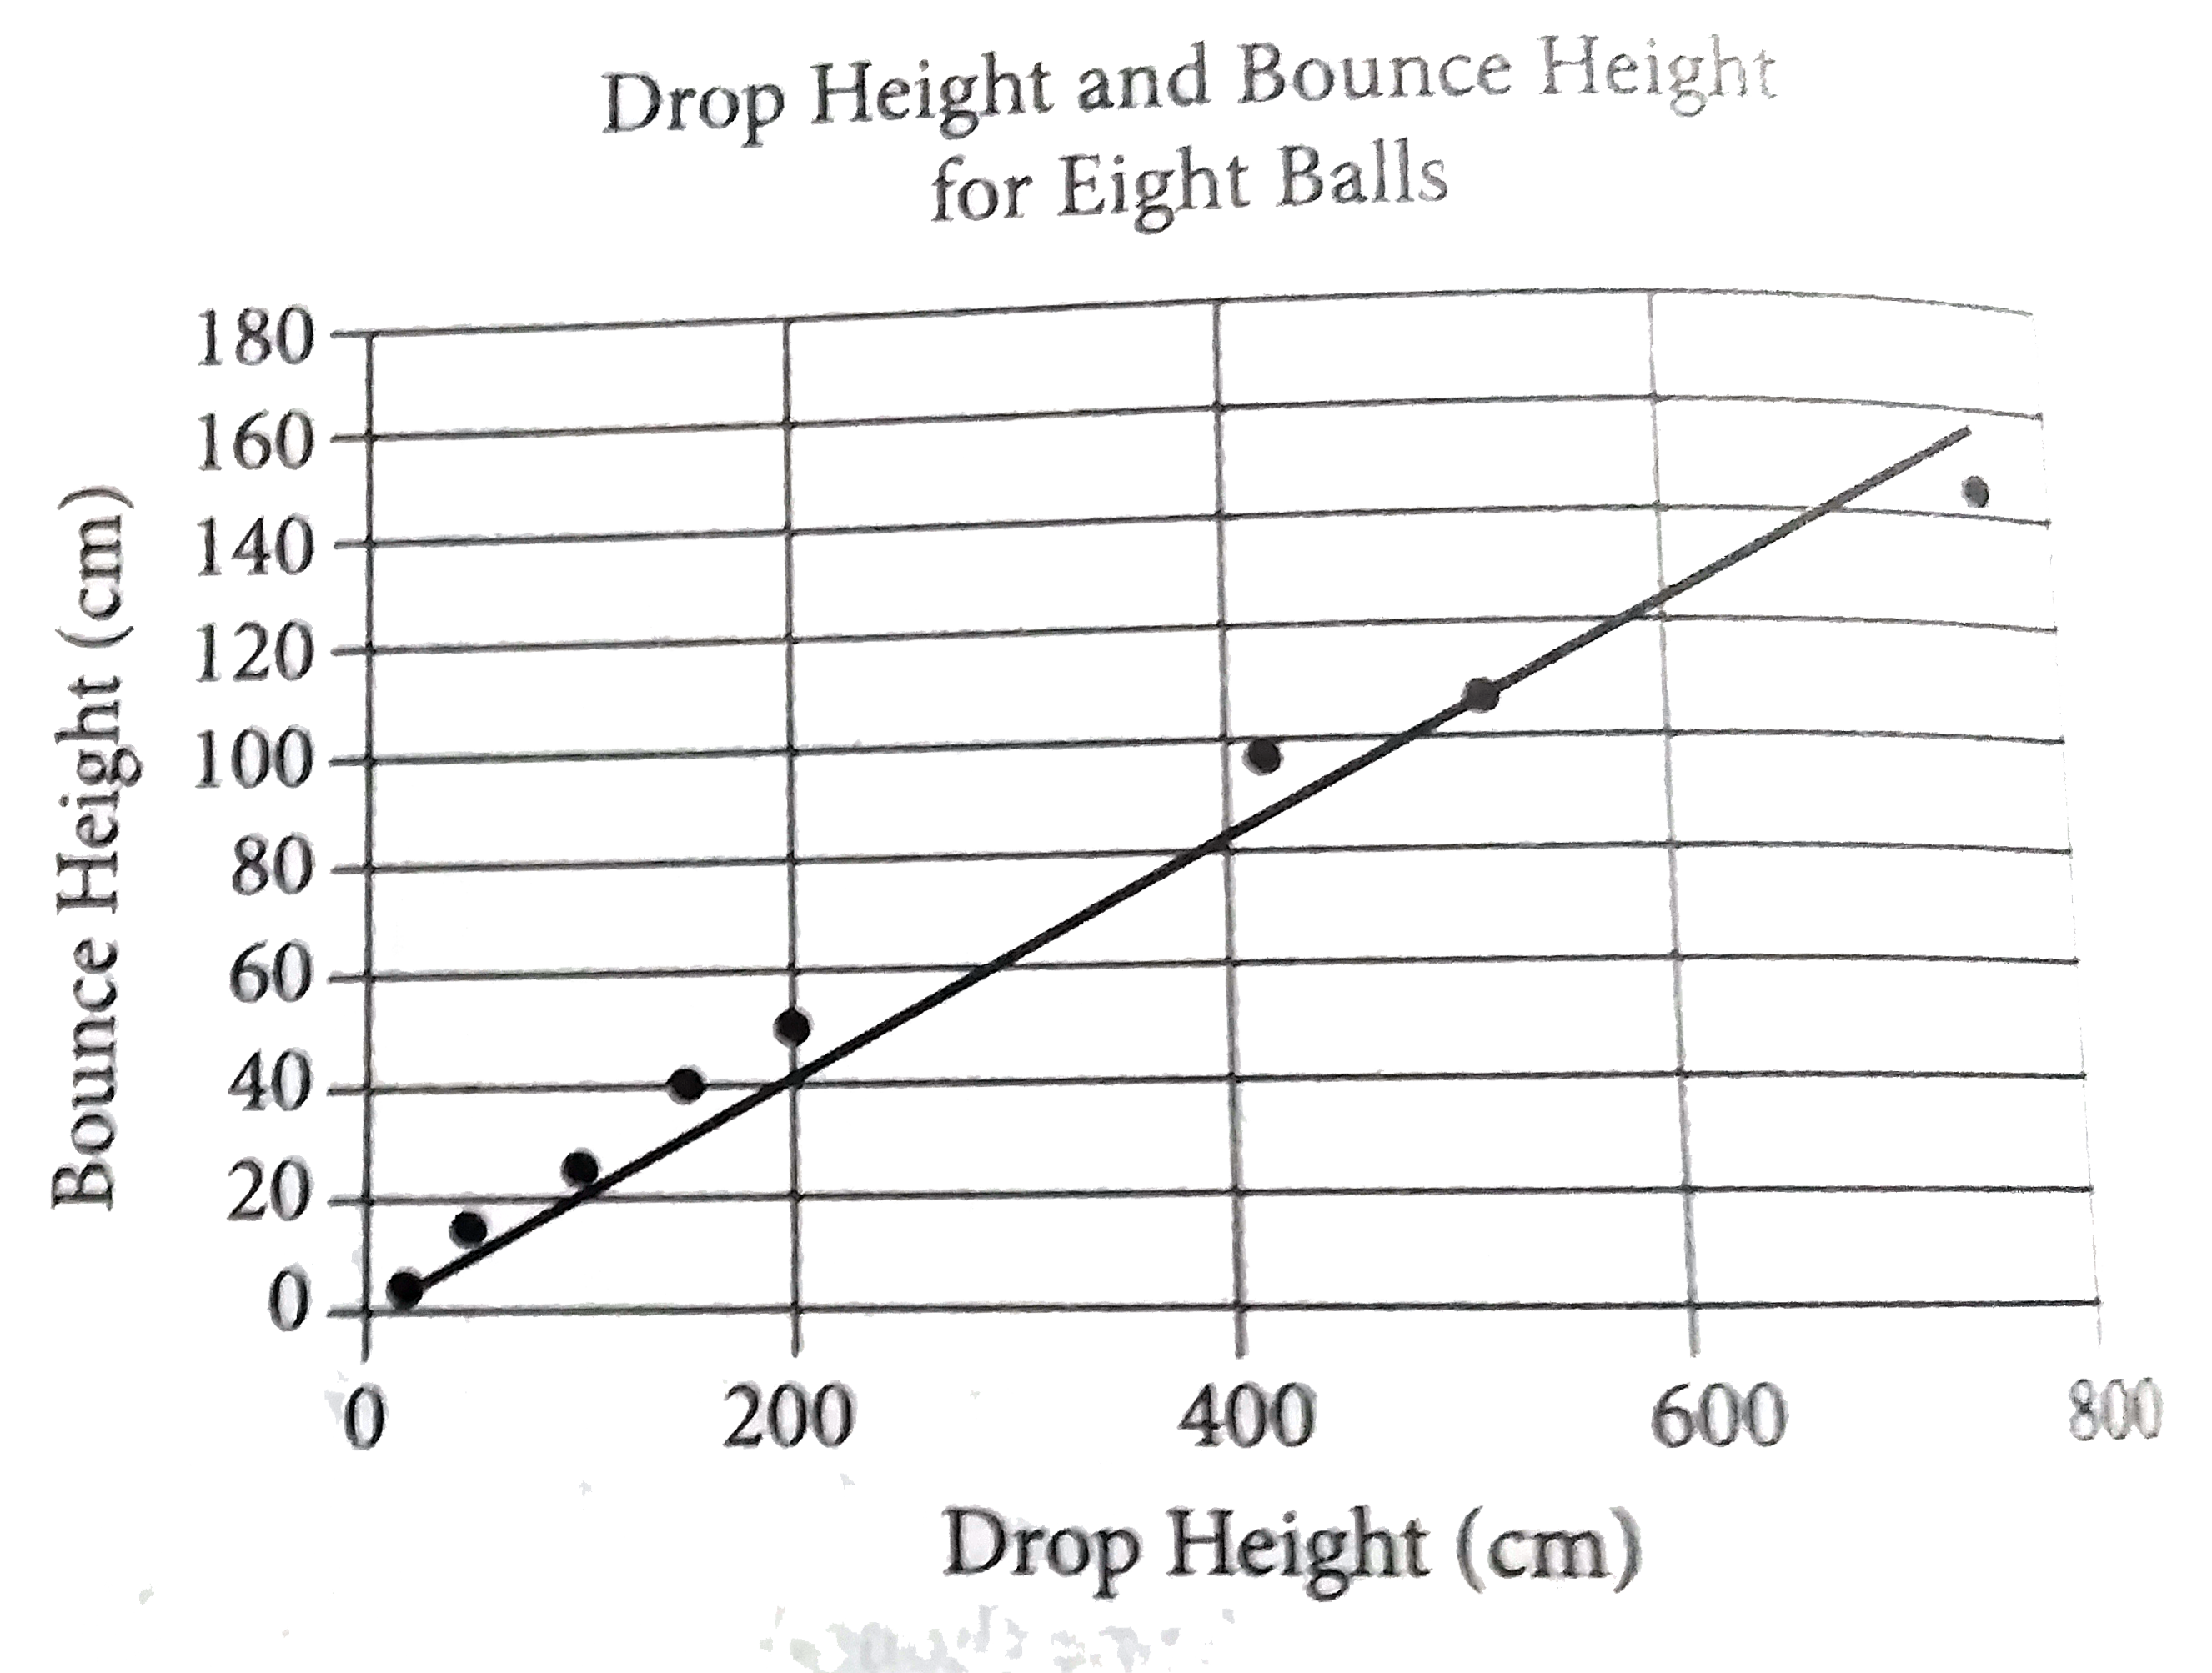
The scatterplot above shows the height in centimeters for both the drop and bounce of eight different balls of the same type. The line of best fit for the data is also shown. According to the lines of best fit, which of the following is closest to the predicted increase in bounce height, in centimeters, for every increase of 100 centimeters in drop height?View SolutionA psychlogist wanted to determine if there is an association between diet and stress levels for the population of middle aged women diet and stress levels for the population of middle aged women in New York. He surveyed a random sample of 1500 middle aged female New Yorkers and found substantial evidence of a positive association between diet and stress levels. Which of the following conclusions is well supported by the data?
View SolutionThe Harrisburg Recreation Center recently changed its hours to open 1 hour later and close 3 hours later than it had previously. Residents of Harrisburg age 16 or older were given a survey and 560 residents replied. The survey asked each resident his or her student status (high school, college, or nonstudent) and what he or she thought about the change in hour (approve, disapprove, or no opinion). The results are summarized in the table below.

Suppose a person will be chosen at random from these 560 residents. Which of the following values is closest to the probability that the person chosen will NOT be a high student and will NOT have replied with no opinion?View SolutionA sociologist chose 300 students at random from each of two schools and asked each student how many siblings he or she has. The results are shown in the table below.
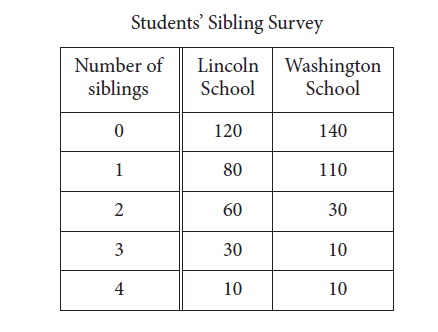
There are a total of 2,400 students at Lincoln School and 3,300 students at Washington School.
Based on the survey data, which of the following most accurately compares the expected total number of students with 4 siblings at the two schools?View Solution
