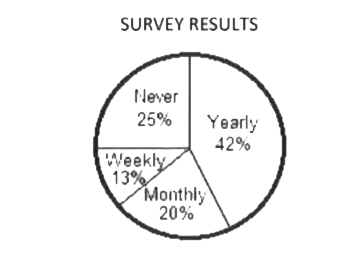
The circle graph abvoe shows the distribution of responses to a survey in which a group of people were asked how often they donate to charity. What fraction of those surveyed reported that they donate at least yearly?
The correct Answer is:3/4 OR .75
Step by step video, text & image solution for The circle graph abvoe shows the distribution of responses to a survey in which a group of people were asked how often they donate to charity. What fraction of those surveyed reported that they donate at least yearly? by Maths experts to help you in doubts & scoring excellent marks in Class 12 exams.
Updated on:21/07/2023Similar Questions
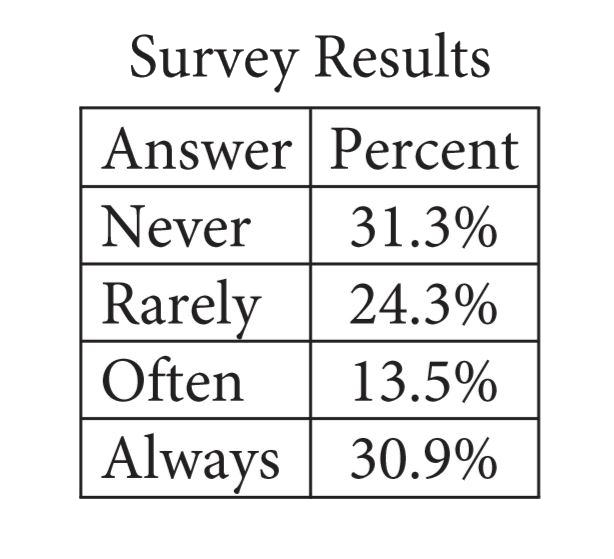
The table above shows the results of a survey in which tablet users were asked how often they would watch video advertisements in order to access streaming content for free. Based on the table, which of the following is closest to the probability that a tablet user answered “Always,” given that the tablet user did not answer “Never”?
View Solution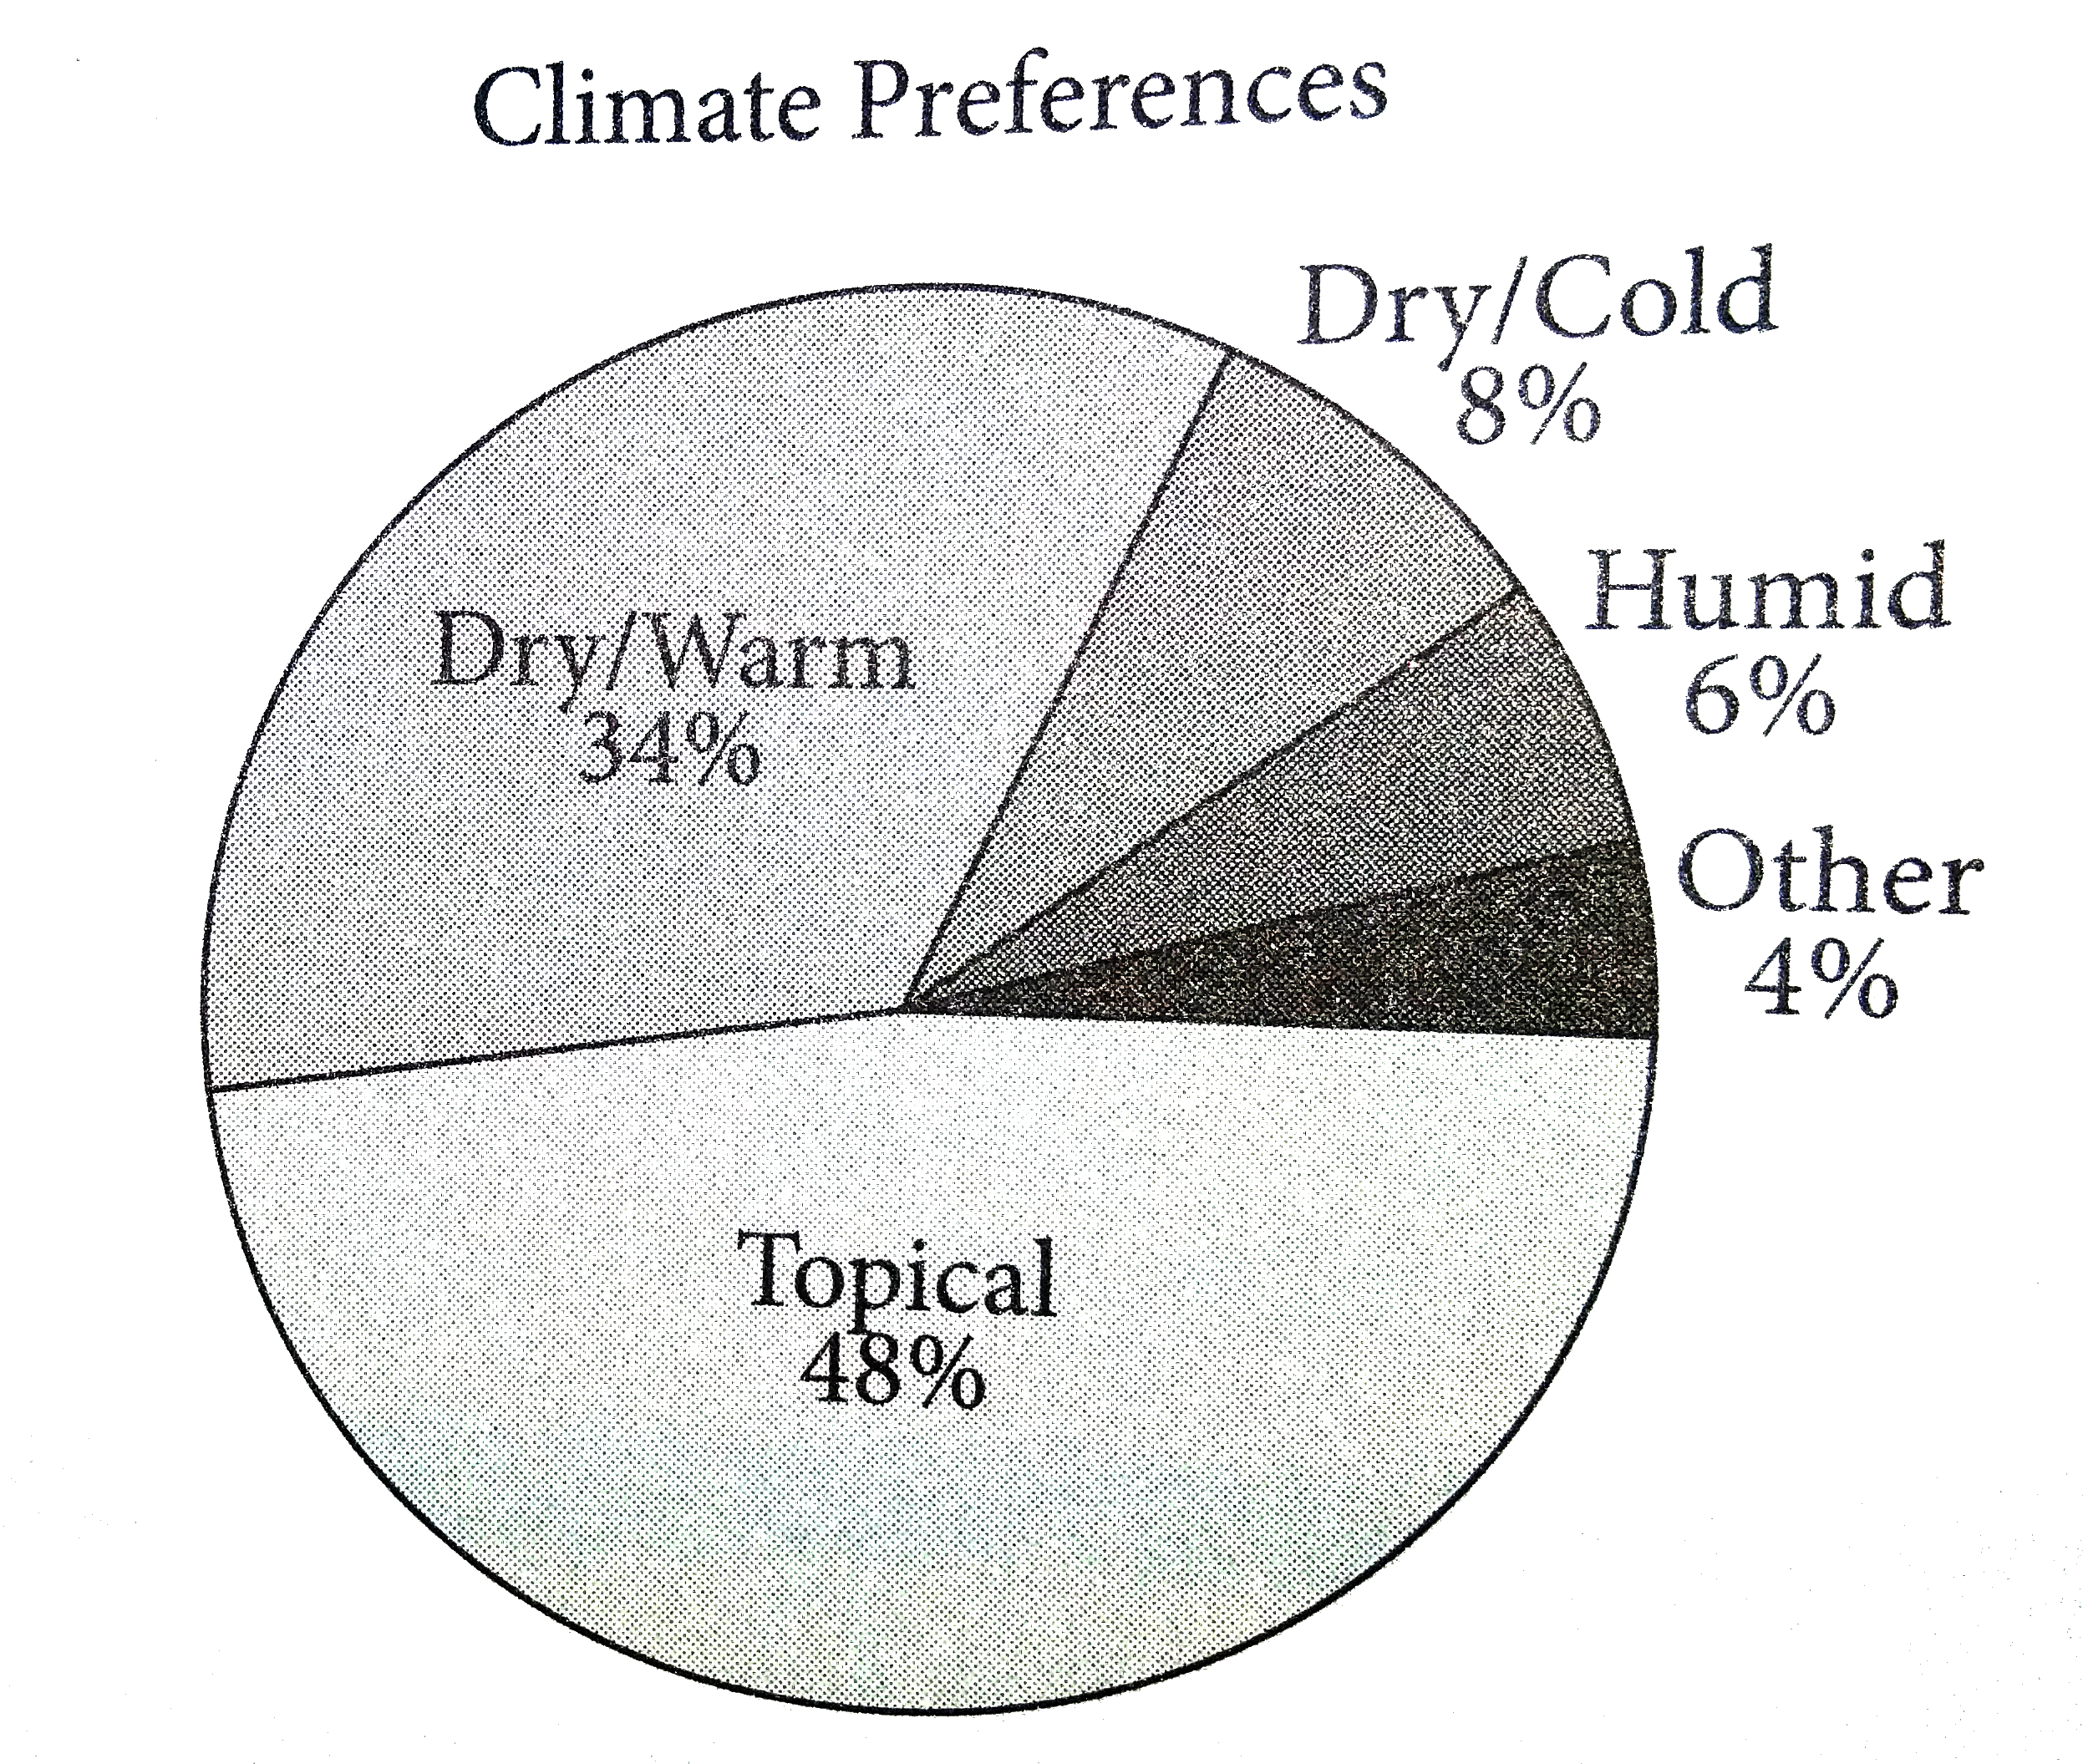
The graph above shows the result of a survery in which adults were asked to name first prefecnce among various types of climates. Of the adults surveryed a total of 280 answered "Humid" or "other". How many answered "Other" in the survey?
View Solution
Knowledge Check
The table below shows the results of a survey of 250 people who were asked whether they like to read and whether they play a musical instrument.
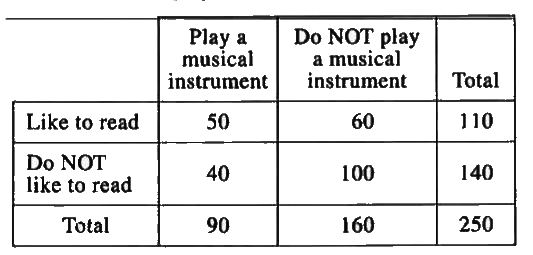
According the the results, what is the probability that a randomly selected person who was surveyed likes to read, given that the person plays a musical instrument?A15B59C511D925A survey in a study skills class asked the 20 students enrolled in the class how many hours (rounded to the nearest hour) they had spent studying on the previous evening. The 20 responses are summarized by the histogram below.
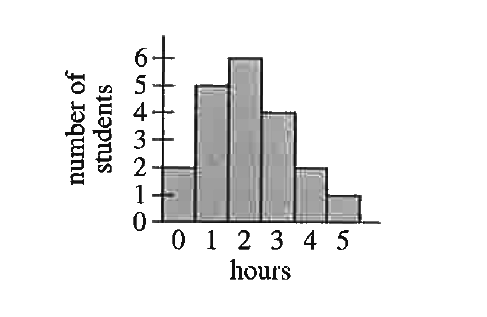
What fraction of the students responded that they had spent less than 3 hours studing?A13100B15C310D1320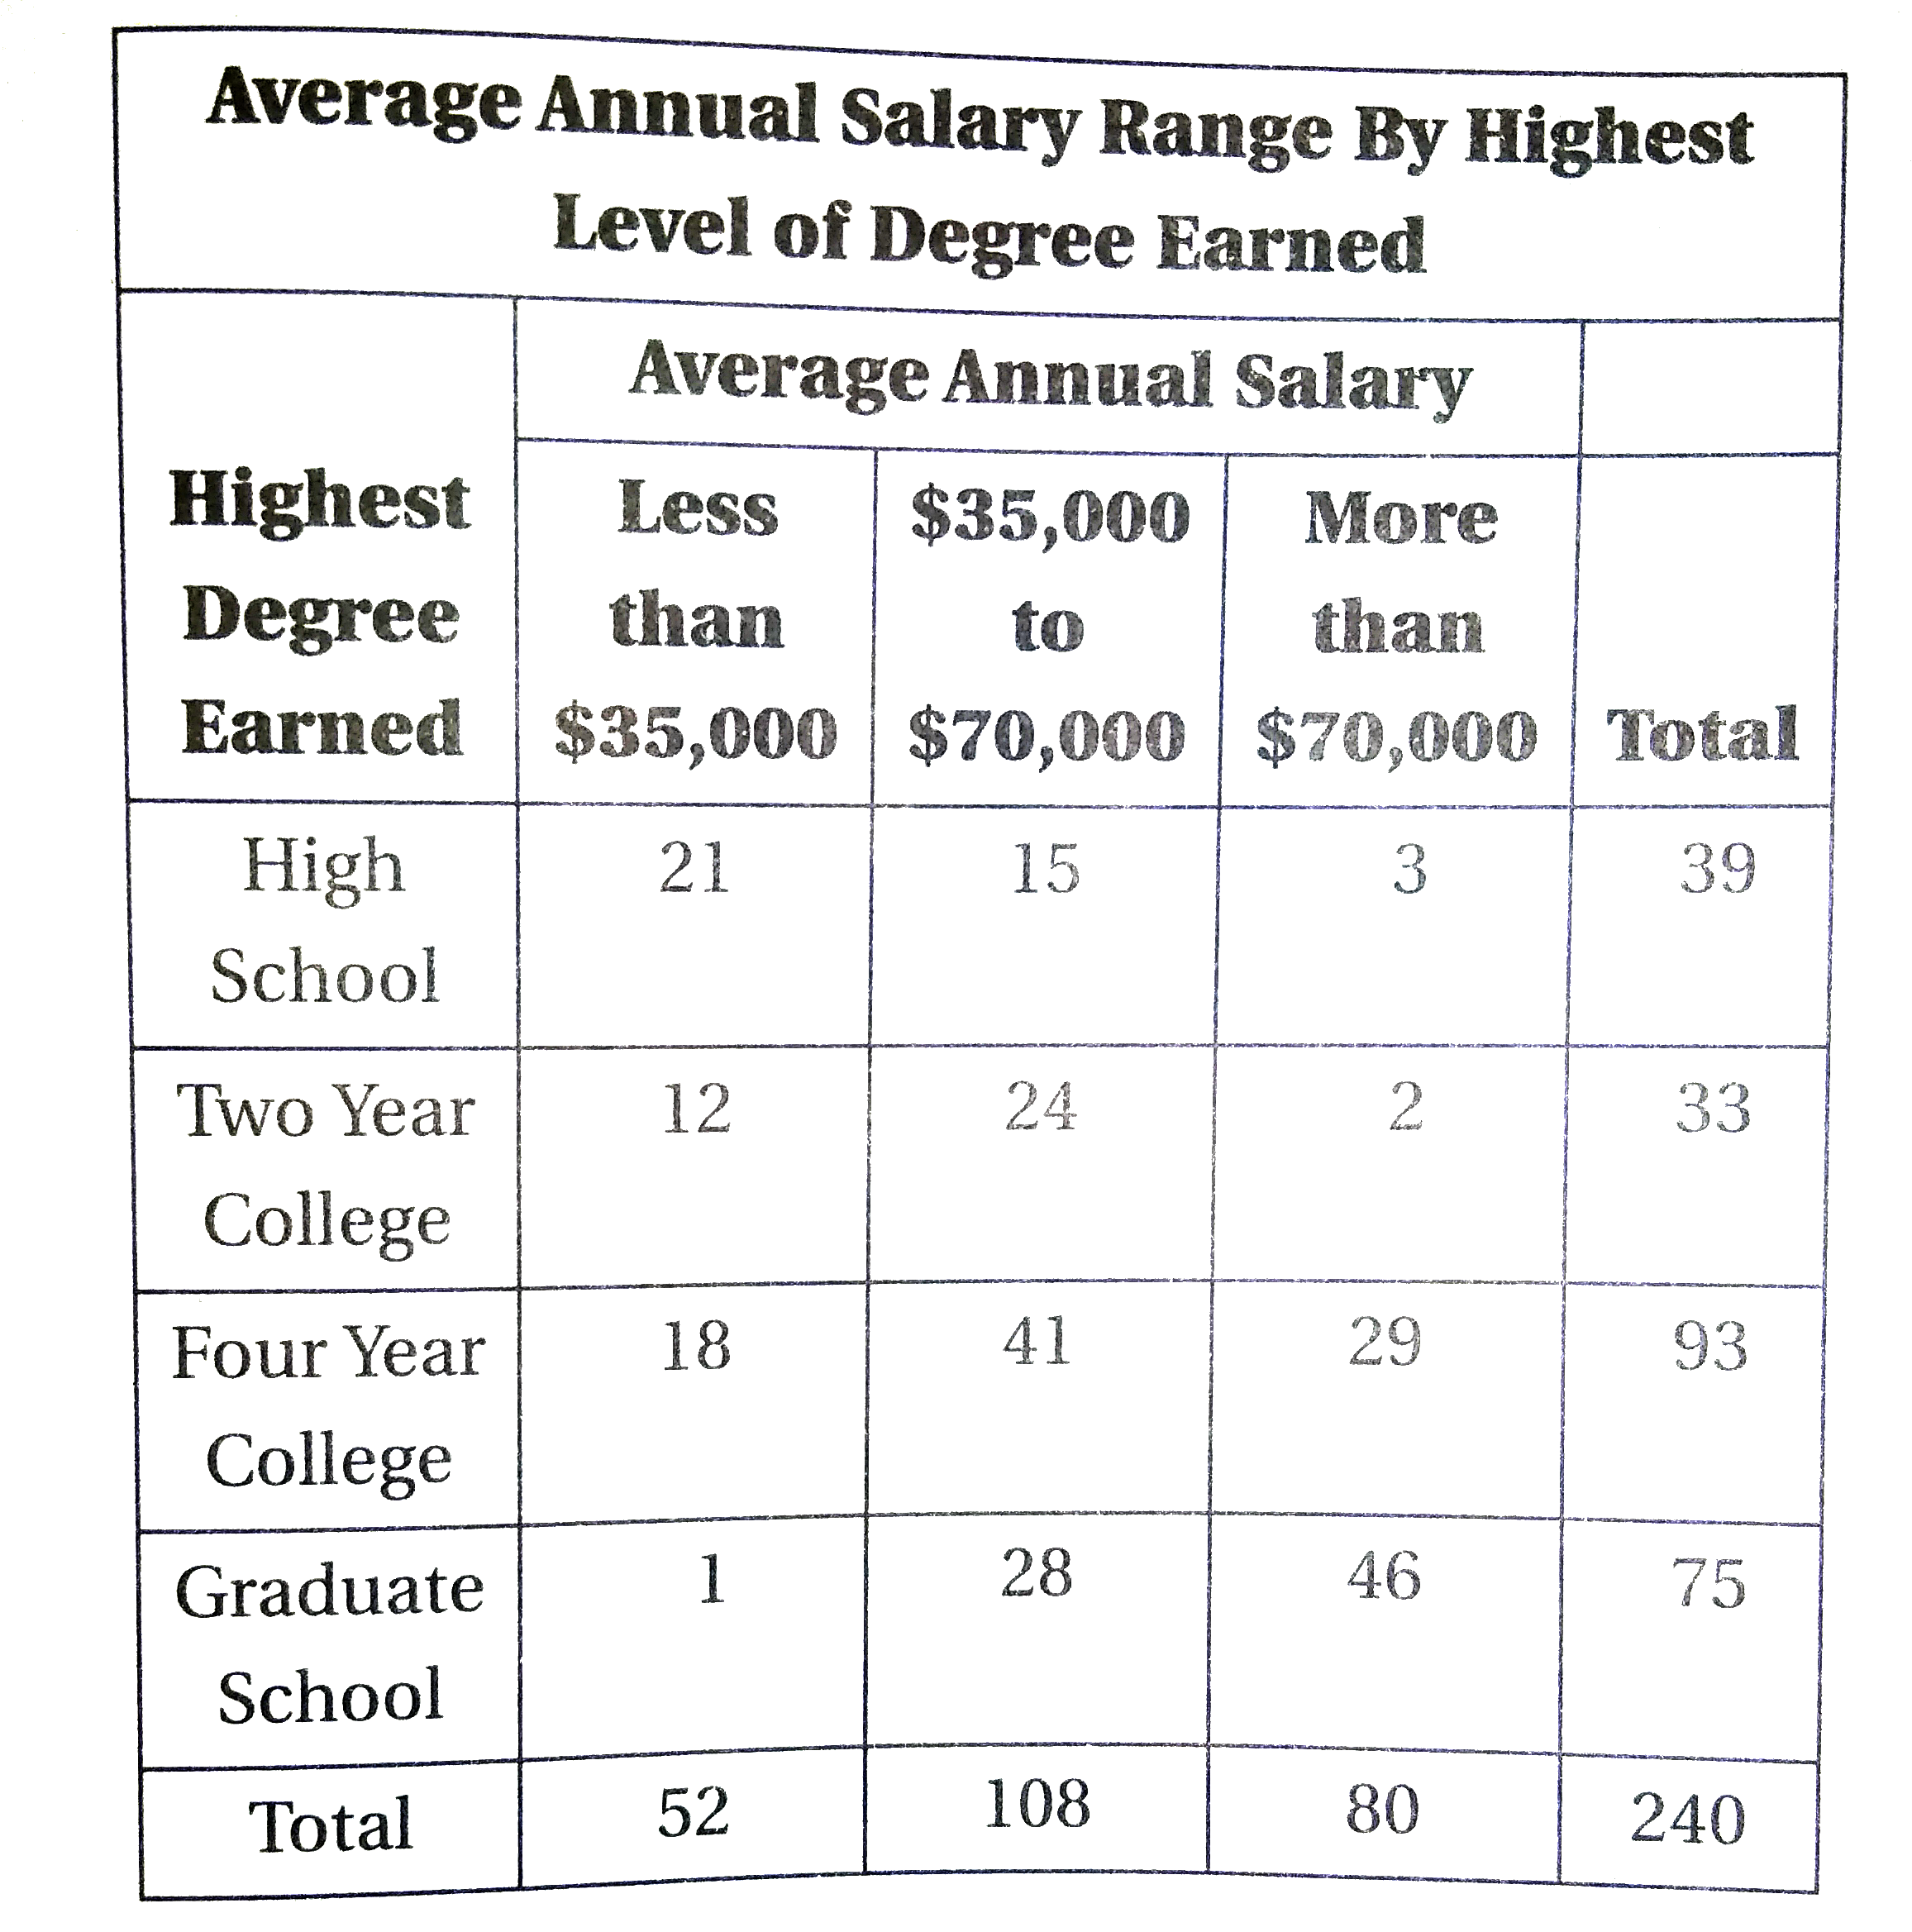
The table above summarizes the result of a survey taken in which 240 adults were asked about their education level and current annual salary. If a participant who reported earning $35,000 or more per year is selected at random, what is the best estimate of the probability that the person does not have a graduate school degreee?A0.31B0.40C0.60D0.69
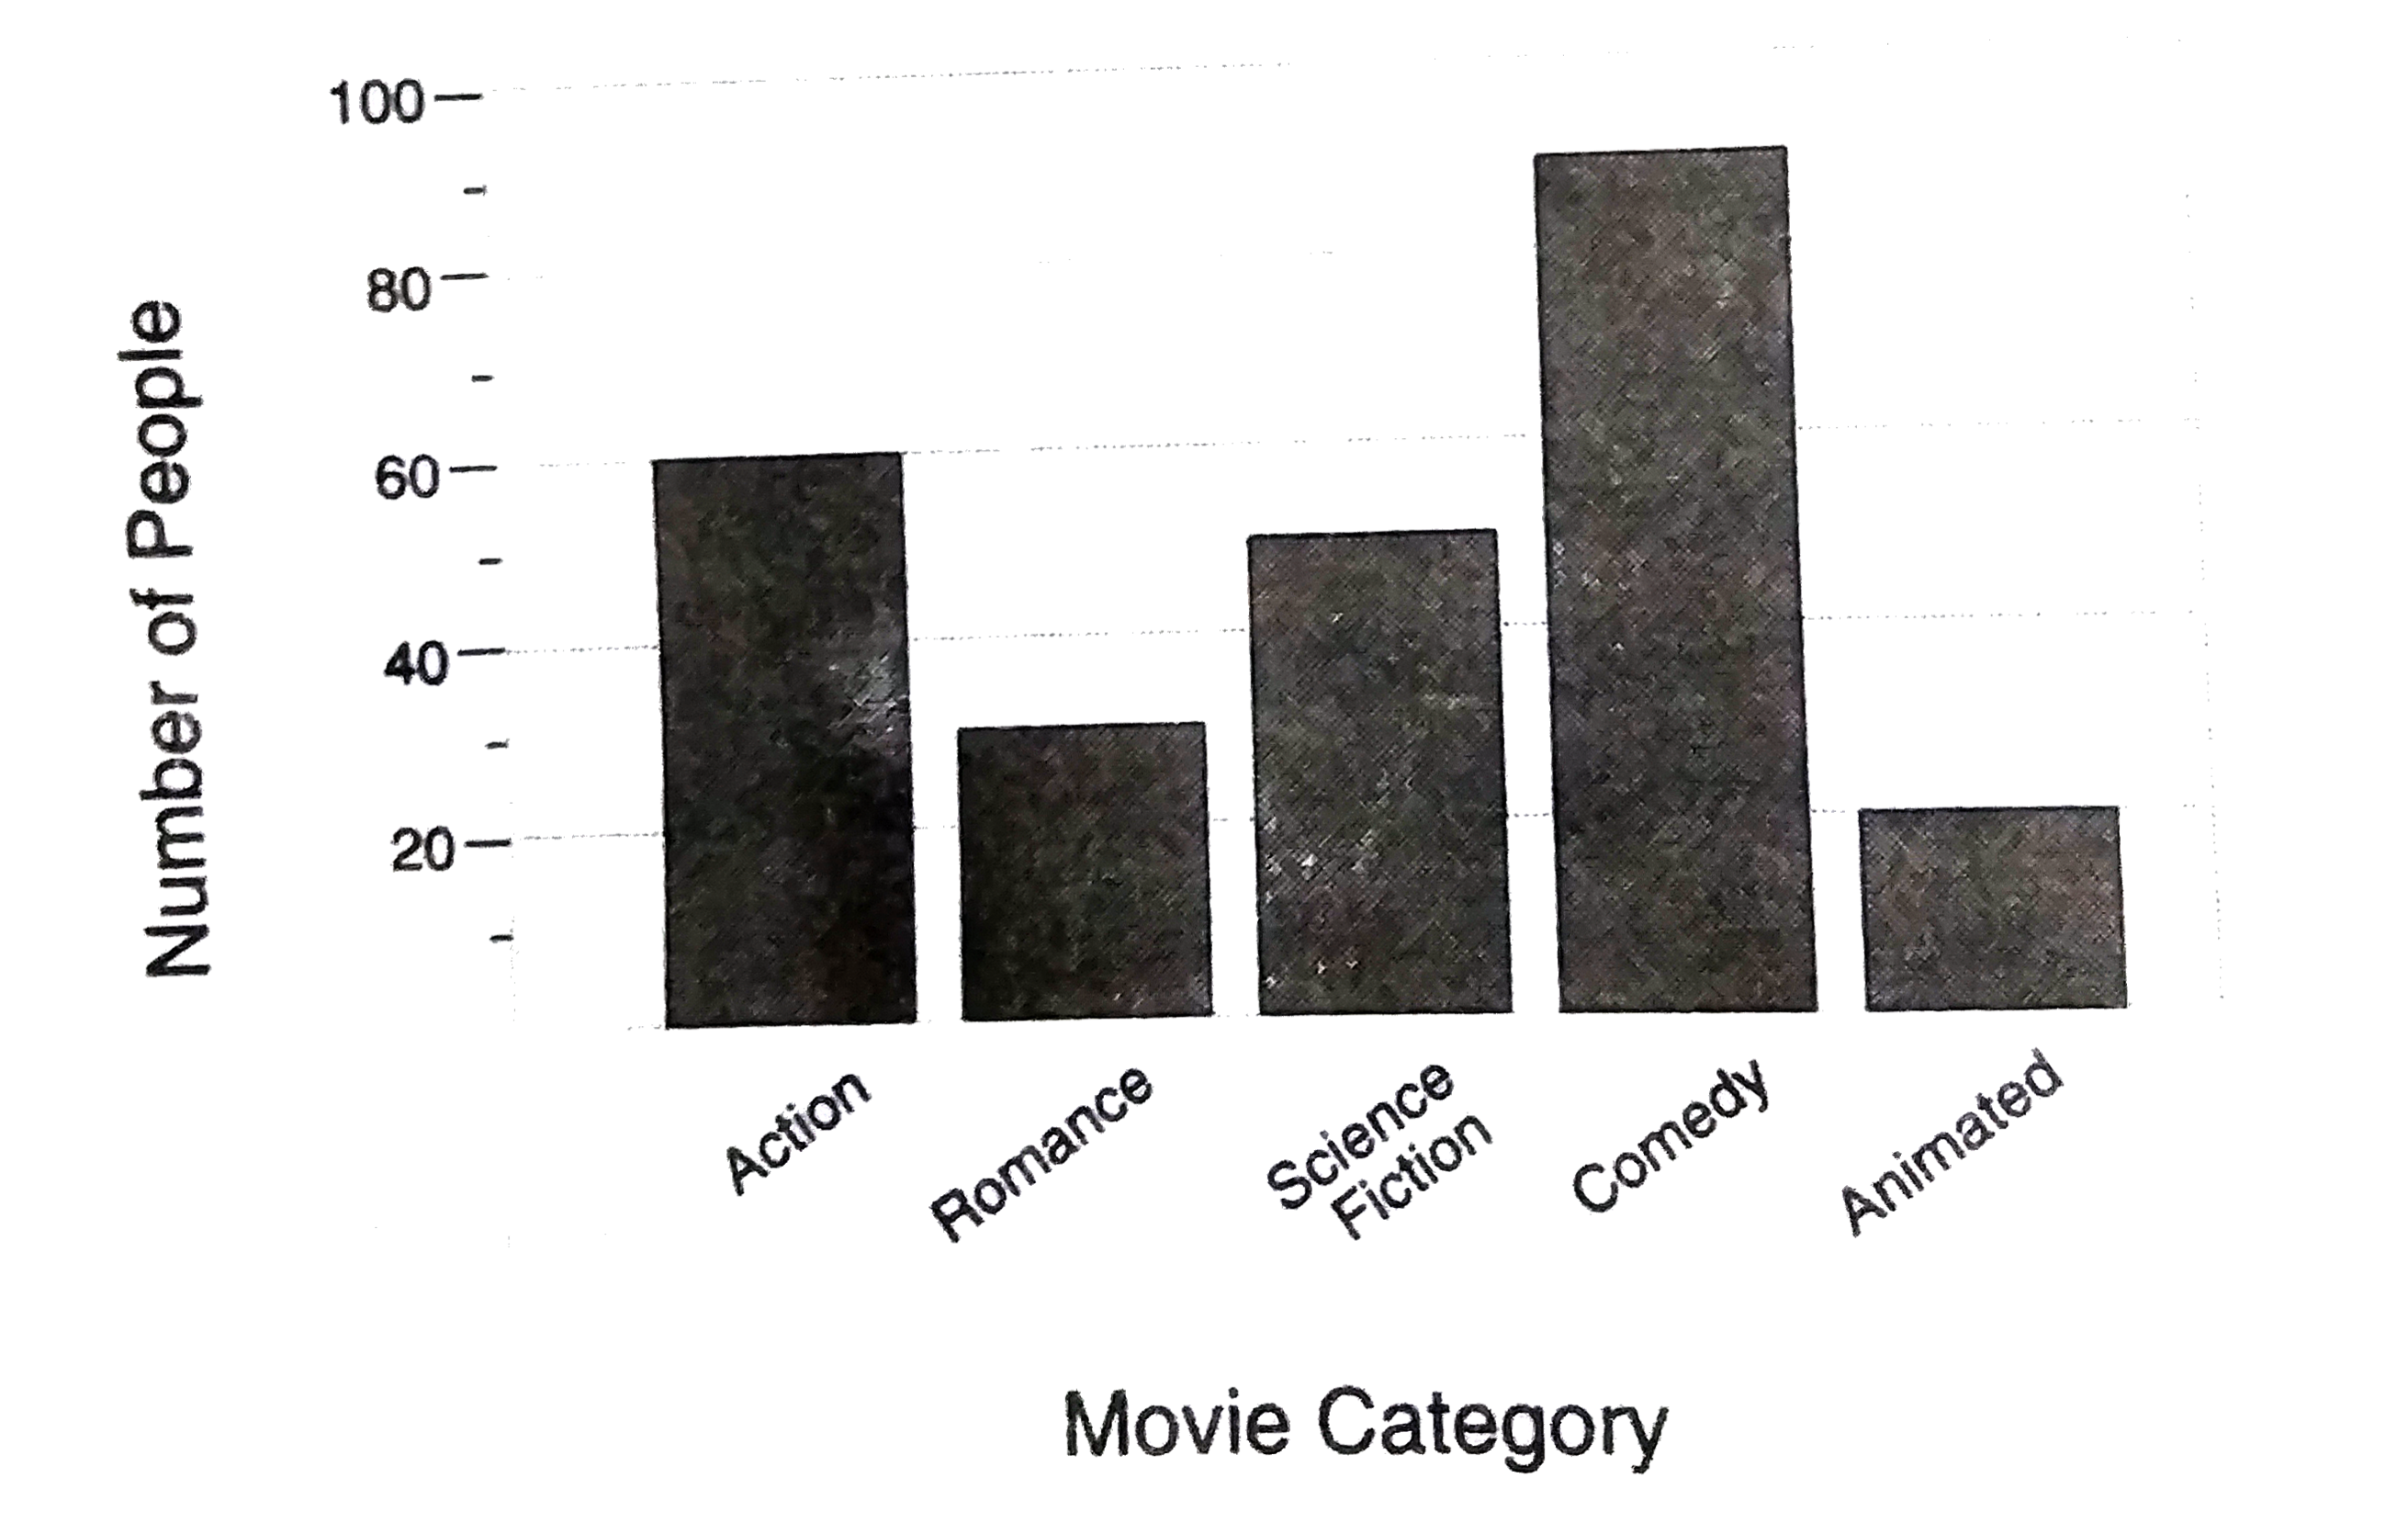
the graph above that summarizes a survey of a group of 250 people who were randomly selected when leaving a multiplex movie threater and asked what type of movie they had seen.
Q. The percent of the people surveyed saw either an action or a science fiction movie?
View Solution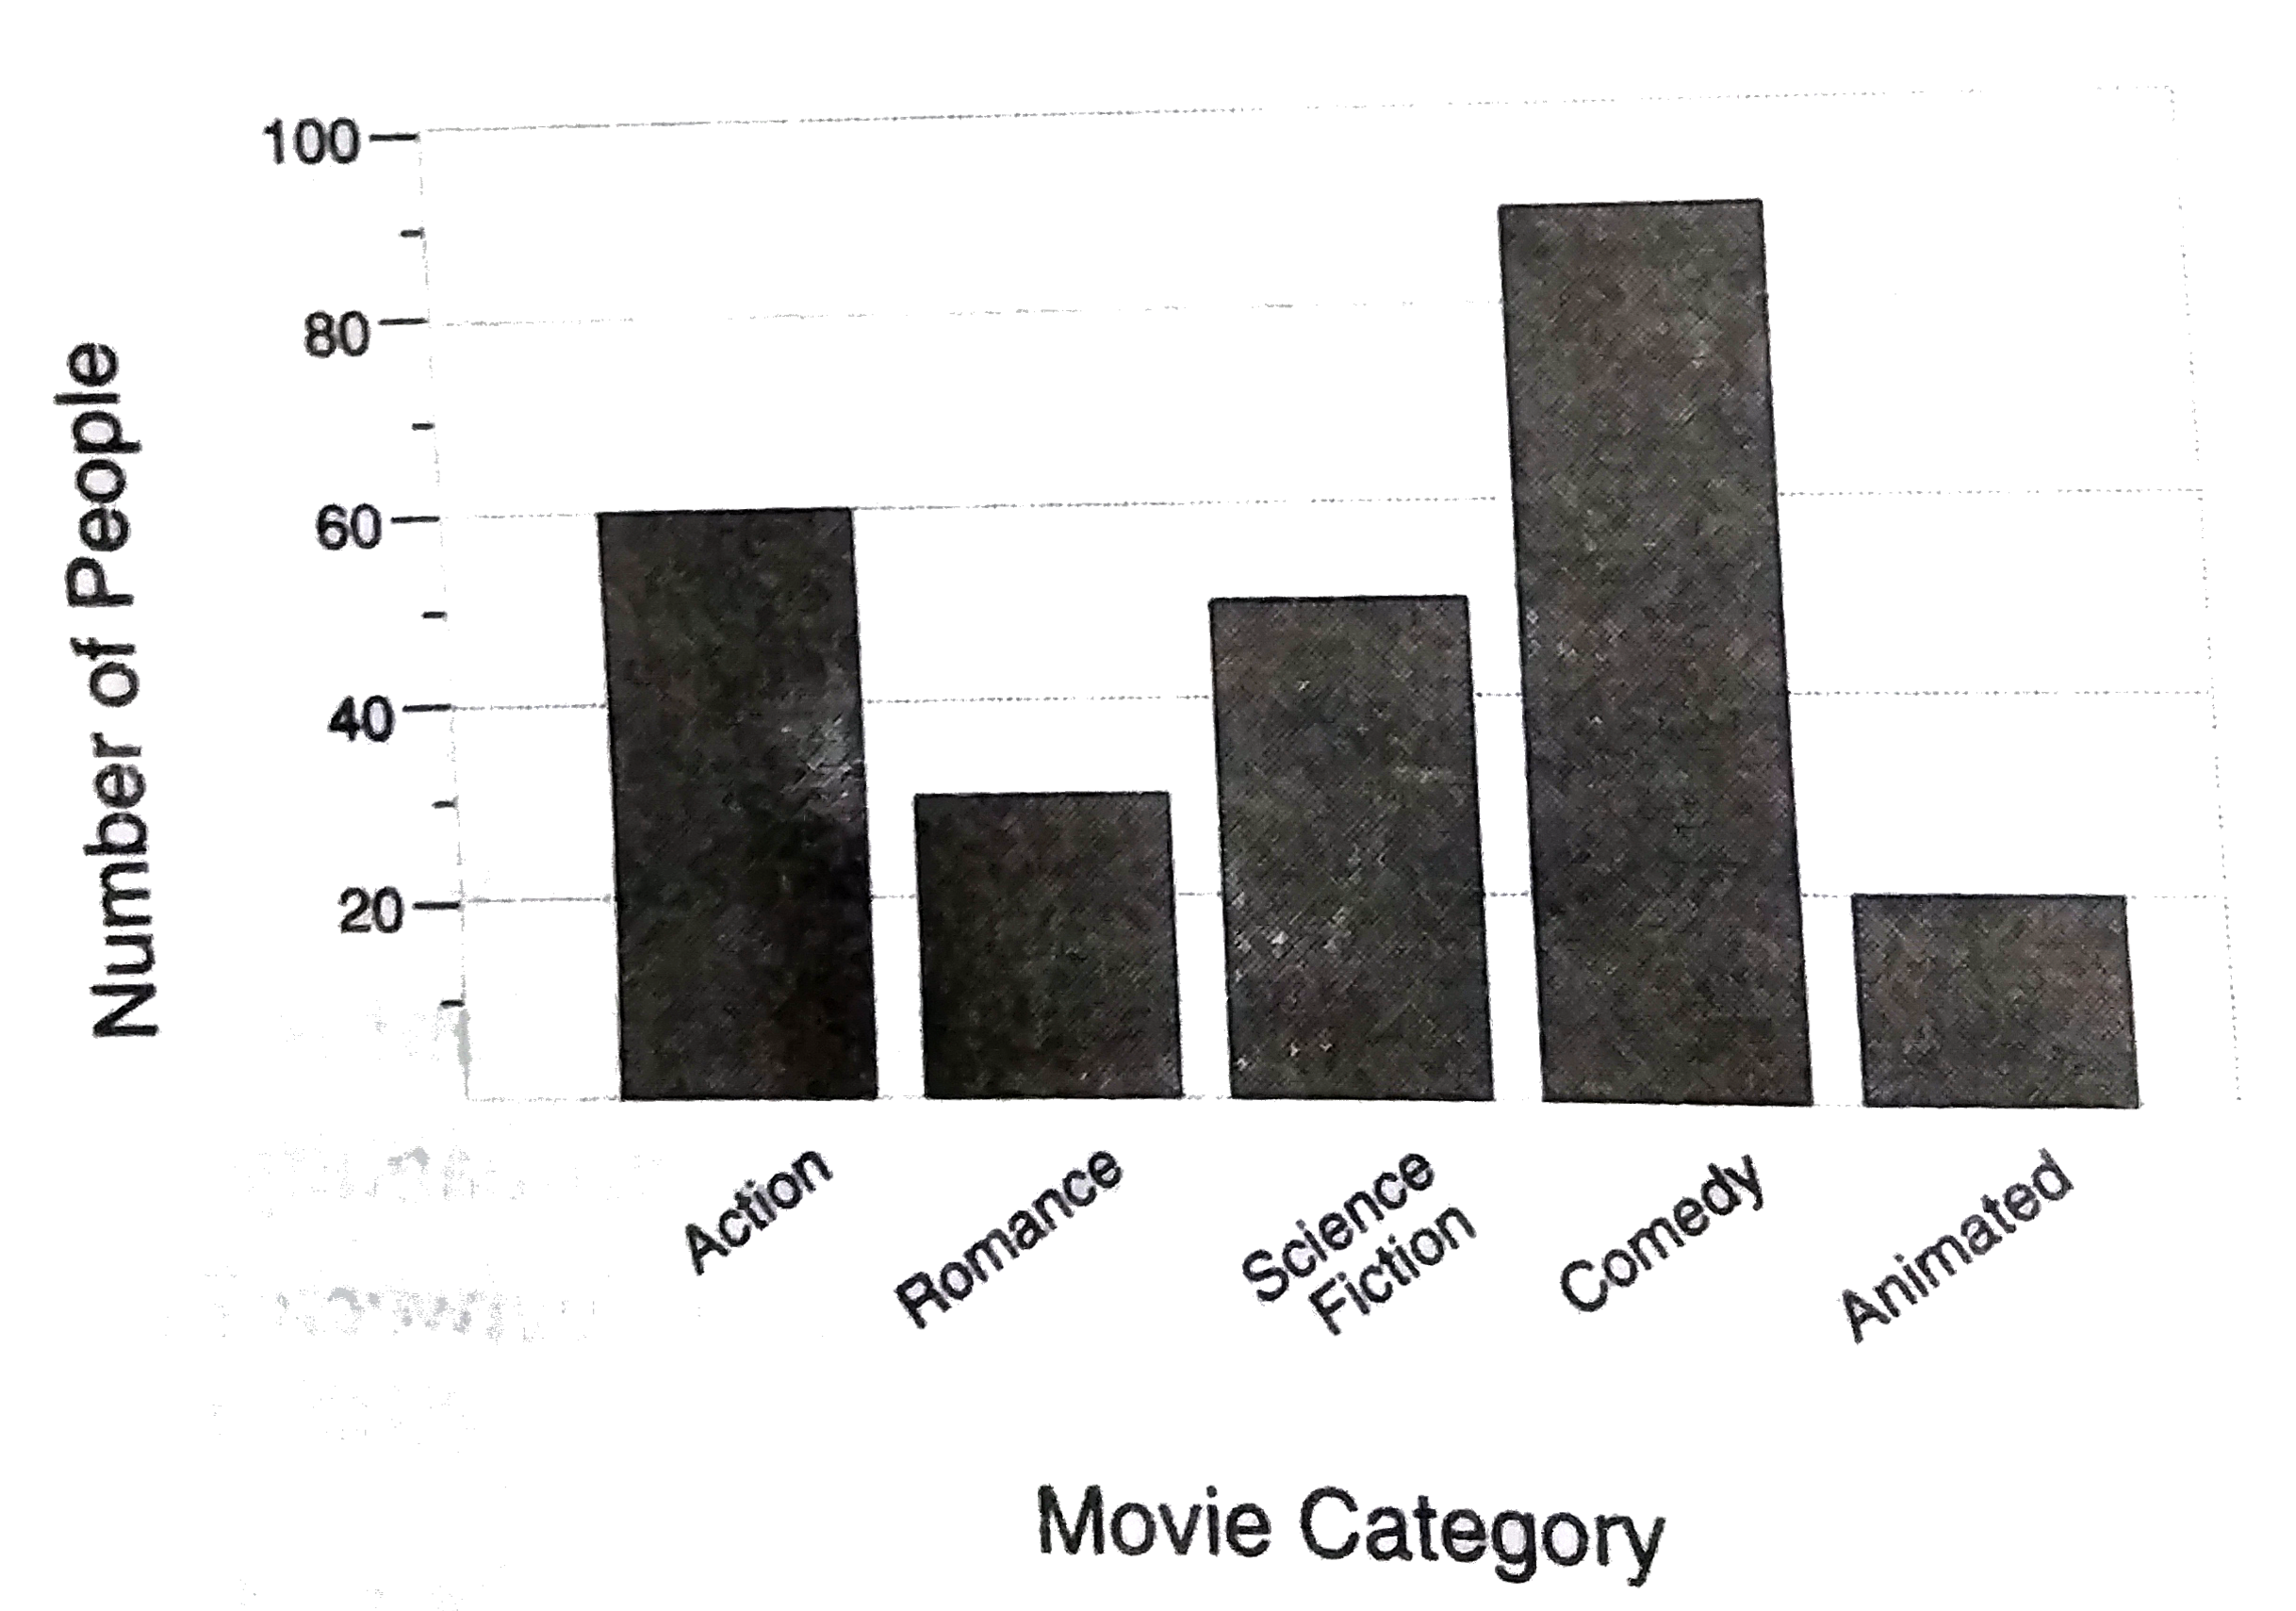
Question 1 and 2 refer to the graph above that summarizes a survey of a group of 250 people who were randomly selected when leaving a multiplex movie threater and asked what type of movie they had seen.
Q. If a total of 1,700 tickets were sold for the five types movies represented in the histogram, what is the best estimate for the number of tickets sold to the Ramance movie?
View SolutionA survey was made to find the type of music that a certain group of young people liked in a city.Adjoining pie chart shows the findings of this survey. From this pie chart answer the following:(i) If 20 people liked classical music, how many young people were surveyed?(ii) Which type of music is liked by the maximum number of people?
View SolutionA polling agency recently surveyed 1,000 adults who were selected at random from alargecity and asked each of the adults,“Are you satisfied with the quality of air in the city?”Of those surveyed,78 percent responded that they were satisfied with the quality of air in the city. Based on the results of the survey, which of the following statements must be true?
I. Of all adults in the city,78 percent are satisfied with the quality of air in the city.
II. If another 1,000 adults selected at random from the city were surveyed,78 percent of them would report they are satisfied with the quality of air in the city.
III. If 1,000adults selected at random from a differentcity were surveyed,78percent of them would report they are satisfied with the quality of air in the city
View SolutionA survey in a study skills class asked the 20 students enrolled in the class how many hours (rounded to the nearest hour) they had spent studying on the previous evening. The 20 responses are summarized by the histogram below.
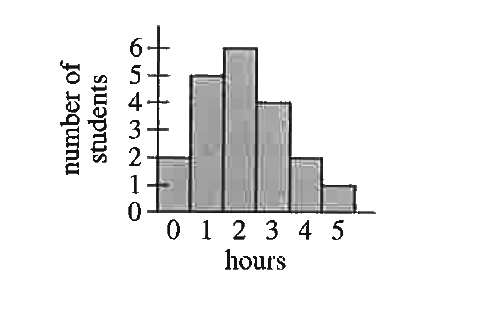
The teacher decides to show the data in a circle graph (pie chart). What should be the measure of the central angle of the sector for 3 hours?
View Solution
