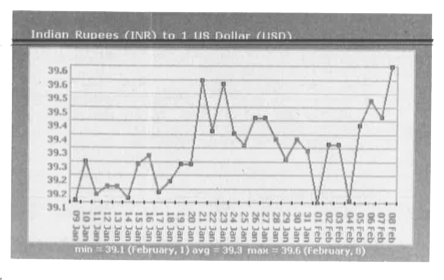
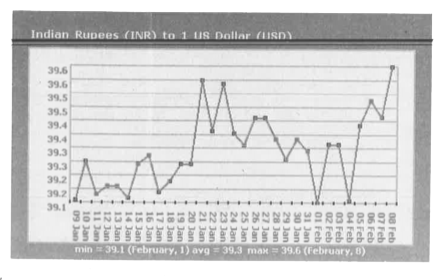
The graph below shows historical exchange rates between the Indian Rupee ( INR) and the US Dollar ( USD) between January 9 and February 8 of a parrticular year .

John had 100 dollars. The exchange rate converts the amount in US dollars to a number in Indian Rupees by directly multiplying by the value of the exchange rate. By what amount did John's $100 increase in terms of Indian Rupees from Jan.9 to Fed. 8?
A
5
B
10
C
15
D
50
Text Solution
The correct Answer is:D
|
Similar Questions
Knowledge Check
The graph below shows historical exchange rates between the Indian Rupee ( INR) and the US Dollar ( USD) between January 9 and February 8 of a parrticular year .

On which day shown on the graph did the value of the US dollar increase against the Rupee by the greatest amount?AJan. 10BJan. 14CJan . 21D43853Foreign exchange rate is determined by:
Ademand for foreign exchangeBsupply of foreign exchangeCboth a and bDneither a nor b
