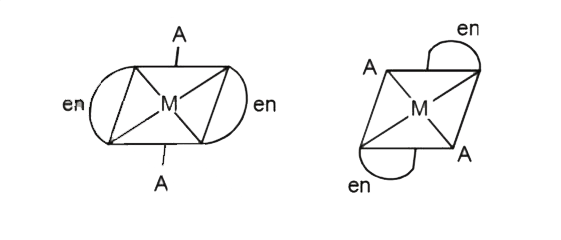
The complexes given below show : 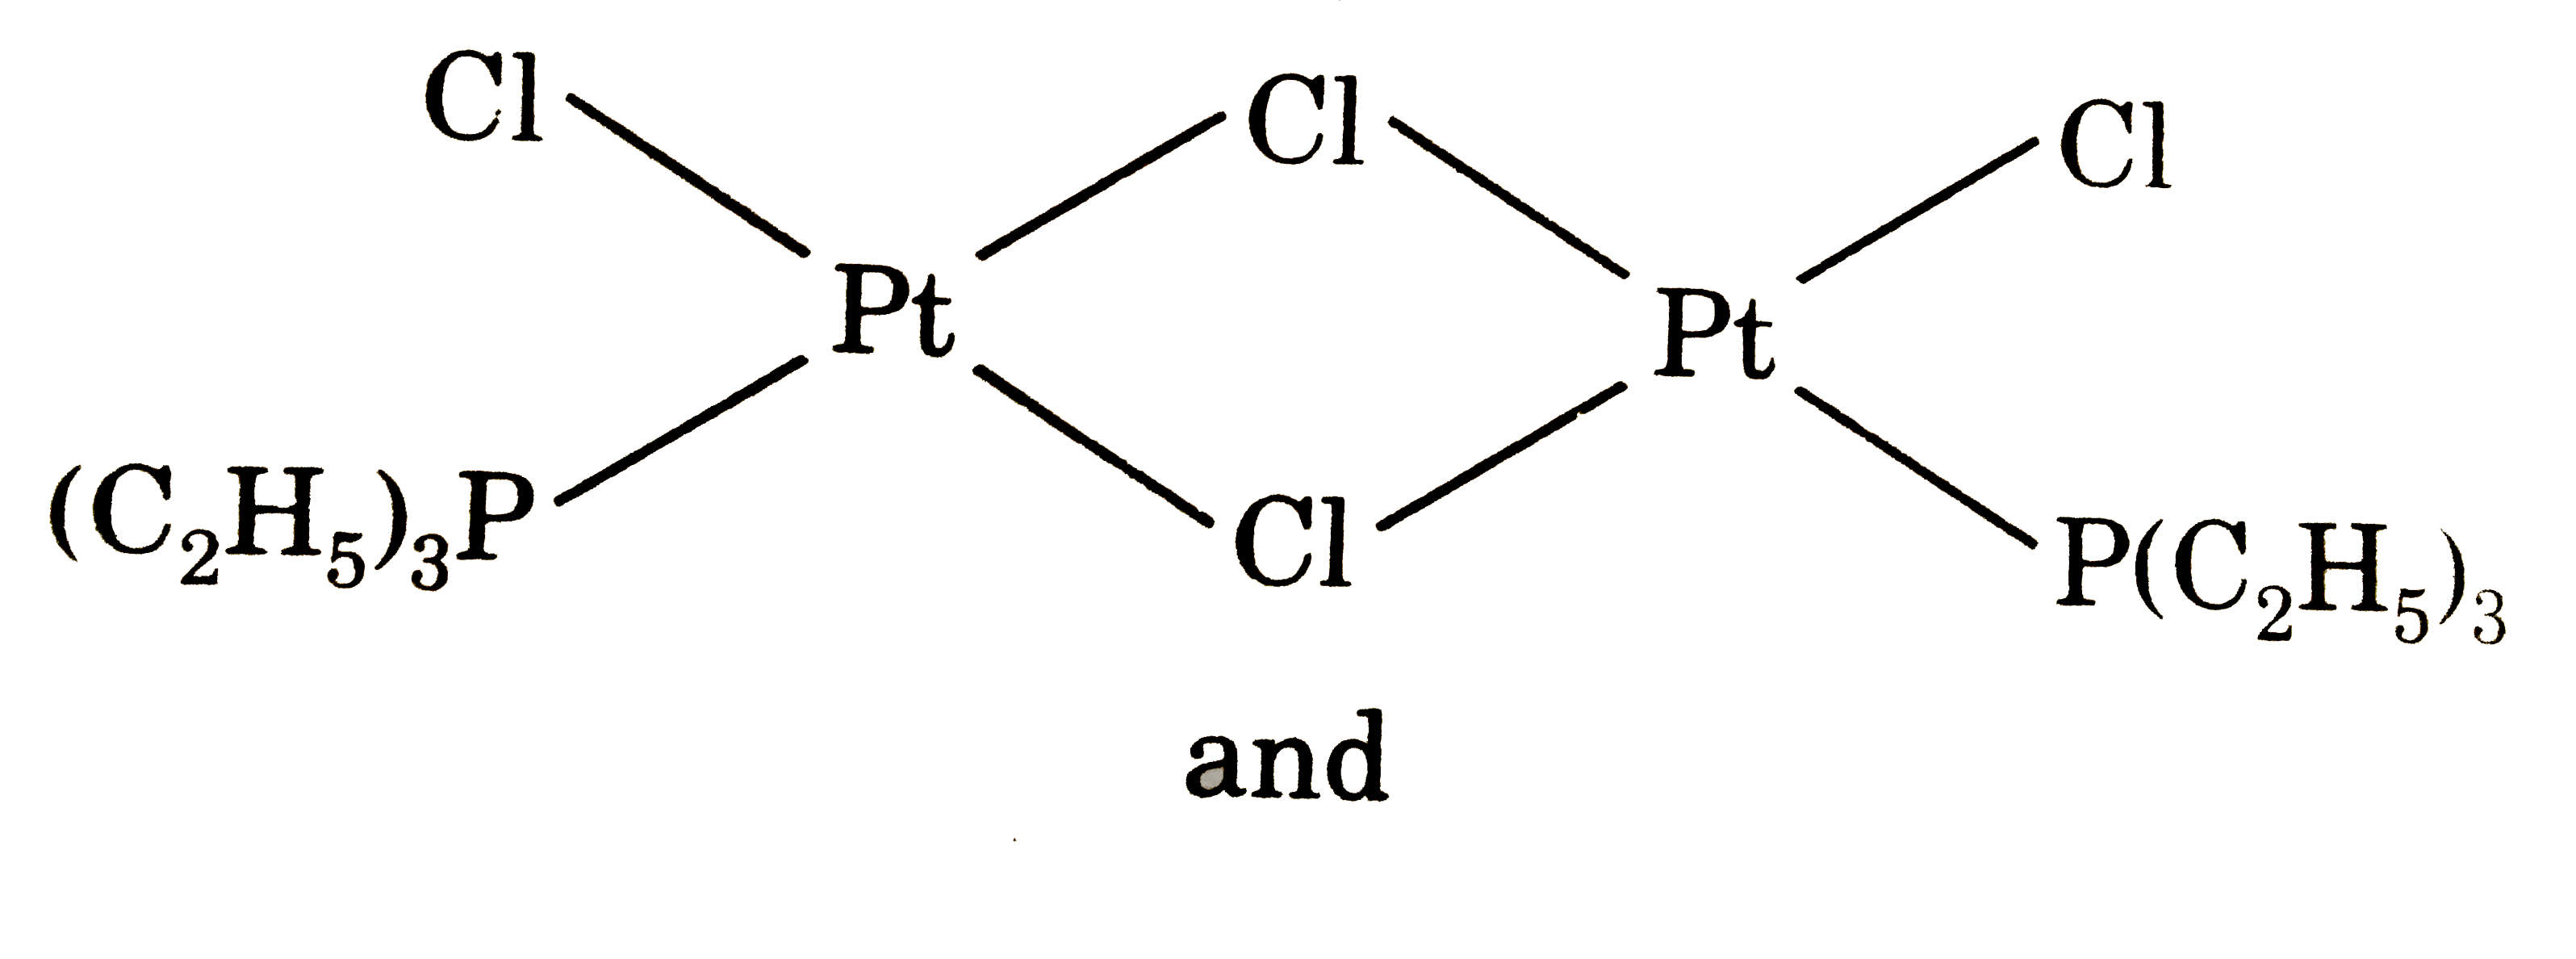 " and "
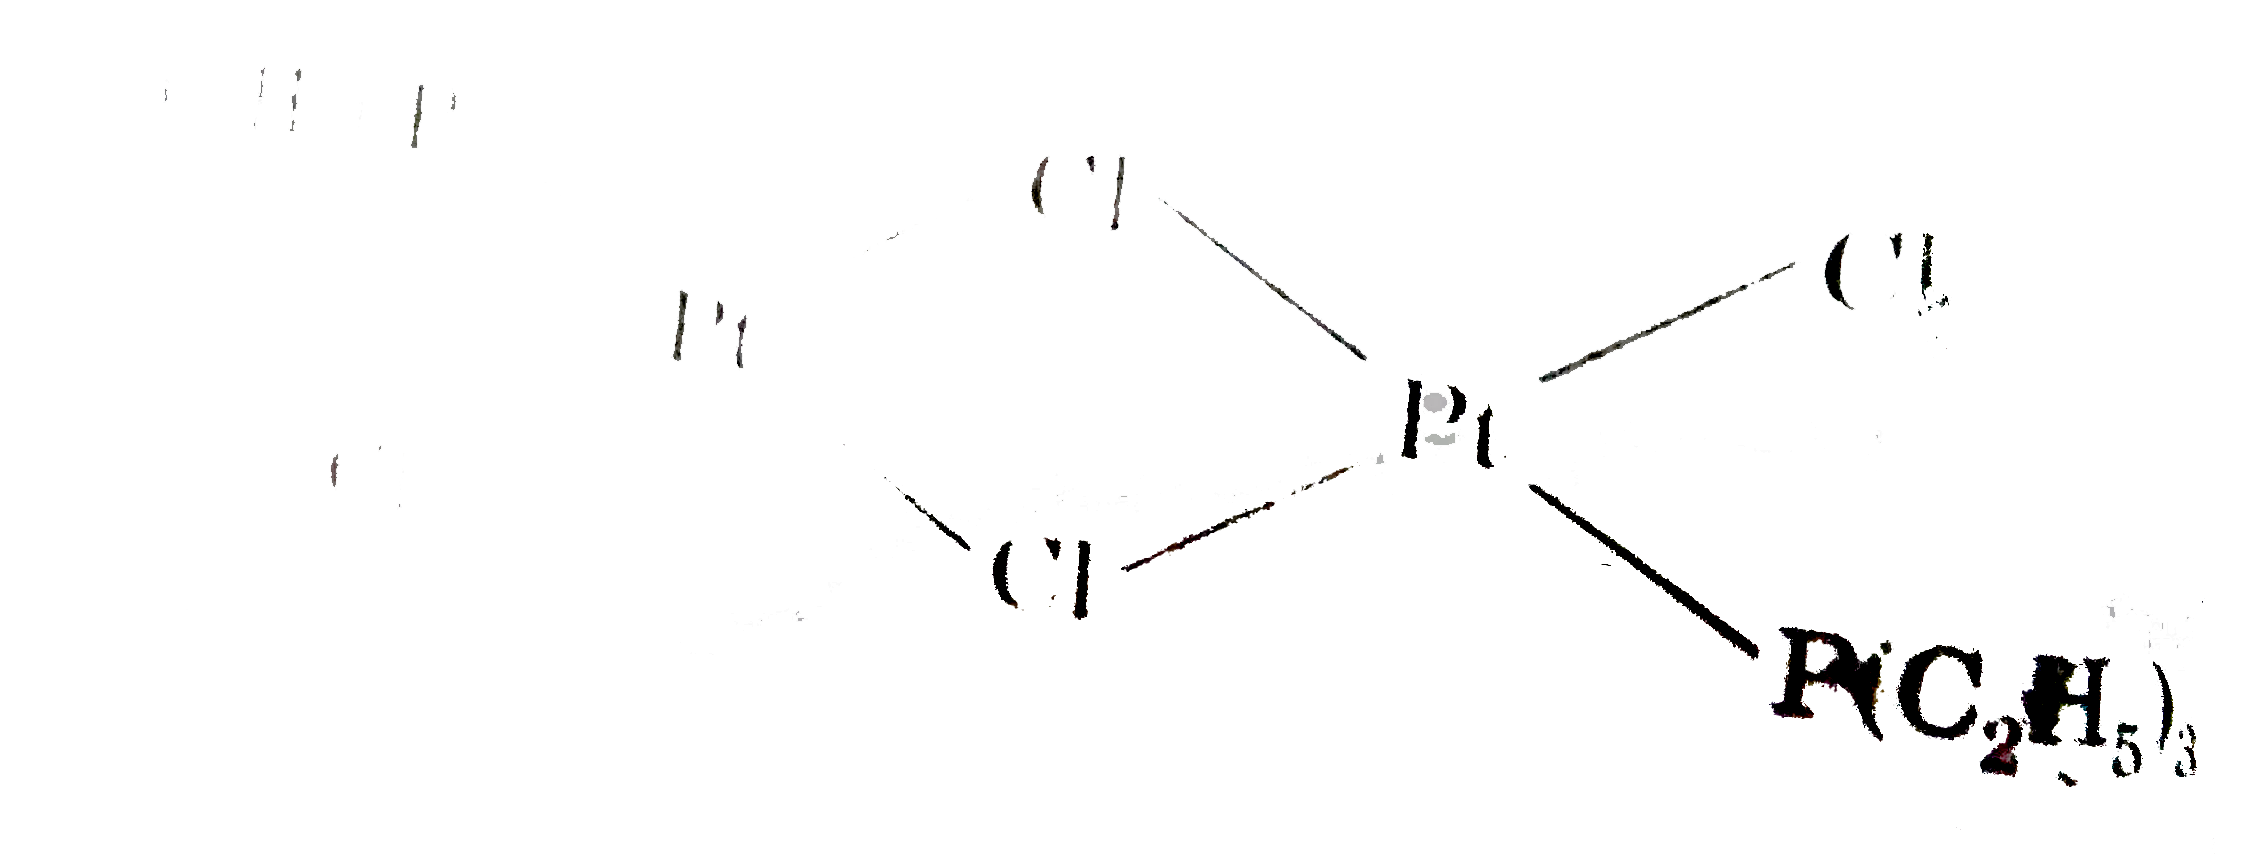
Optical isomerism
Co-ordination isomerism
Geometrical isomerism
Coordination position isomerism
The correct Answer is:C
Step by step video, text & image solution for The complexes given below show : " and " by Chemistry experts to help you in doubts & scoring excellent marks in Class 12 exams.
Topper's Solved these Questions
- BOOK - MOTIONCHAPTER - COORDINATION COMPOUNDEXERCISE - EXERCISE-2 (LEVEL -II) MULTIPLE CORRECT JEE ADVANCED50videos
COORDINATION COMPOUND
- BOOK - MOTIONCHAPTER - COORDINATION COMPOUNDEXERCISE - EXERCISE-2 (LEVEL -II) MULTIPLE CORRECT JEE ADVANCED Match the Column10videos
COORDINATION COMPOUND
- BOOK - MOTIONCHAPTER - COORDINATION COMPOUNDEXERCISE - EXERCISE-4 LEVEL-II PREVIOUS YEAR JEE ADVANCED37videos
COORDINATION COMPOUND
- BOOK - MOTIONCHAPTER - CLASSROOM PROBLEMS 1EXERCISE - THERMODYNAMICS17videos
CLASSROOM PROBLEMS 1
- BOOK - MOTIONCHAPTER - D-BLOCK ELEMENTS EXERCISE - Exercise IV Level-II9videos
D-BLOCK ELEMENTS
Similar Questions
Knowledge Check
- Question 1 - Select One
The complexes given below are –
 AGeometrical isomersBPosition isomersCOptical isomersDIdentical
 - Question 2 - Select One
The two complexes given below are
 Ageometrical isomersBpsition isomersCoptical isomersDidentical
 - Question 3 - Select One
The two complexes given given below are
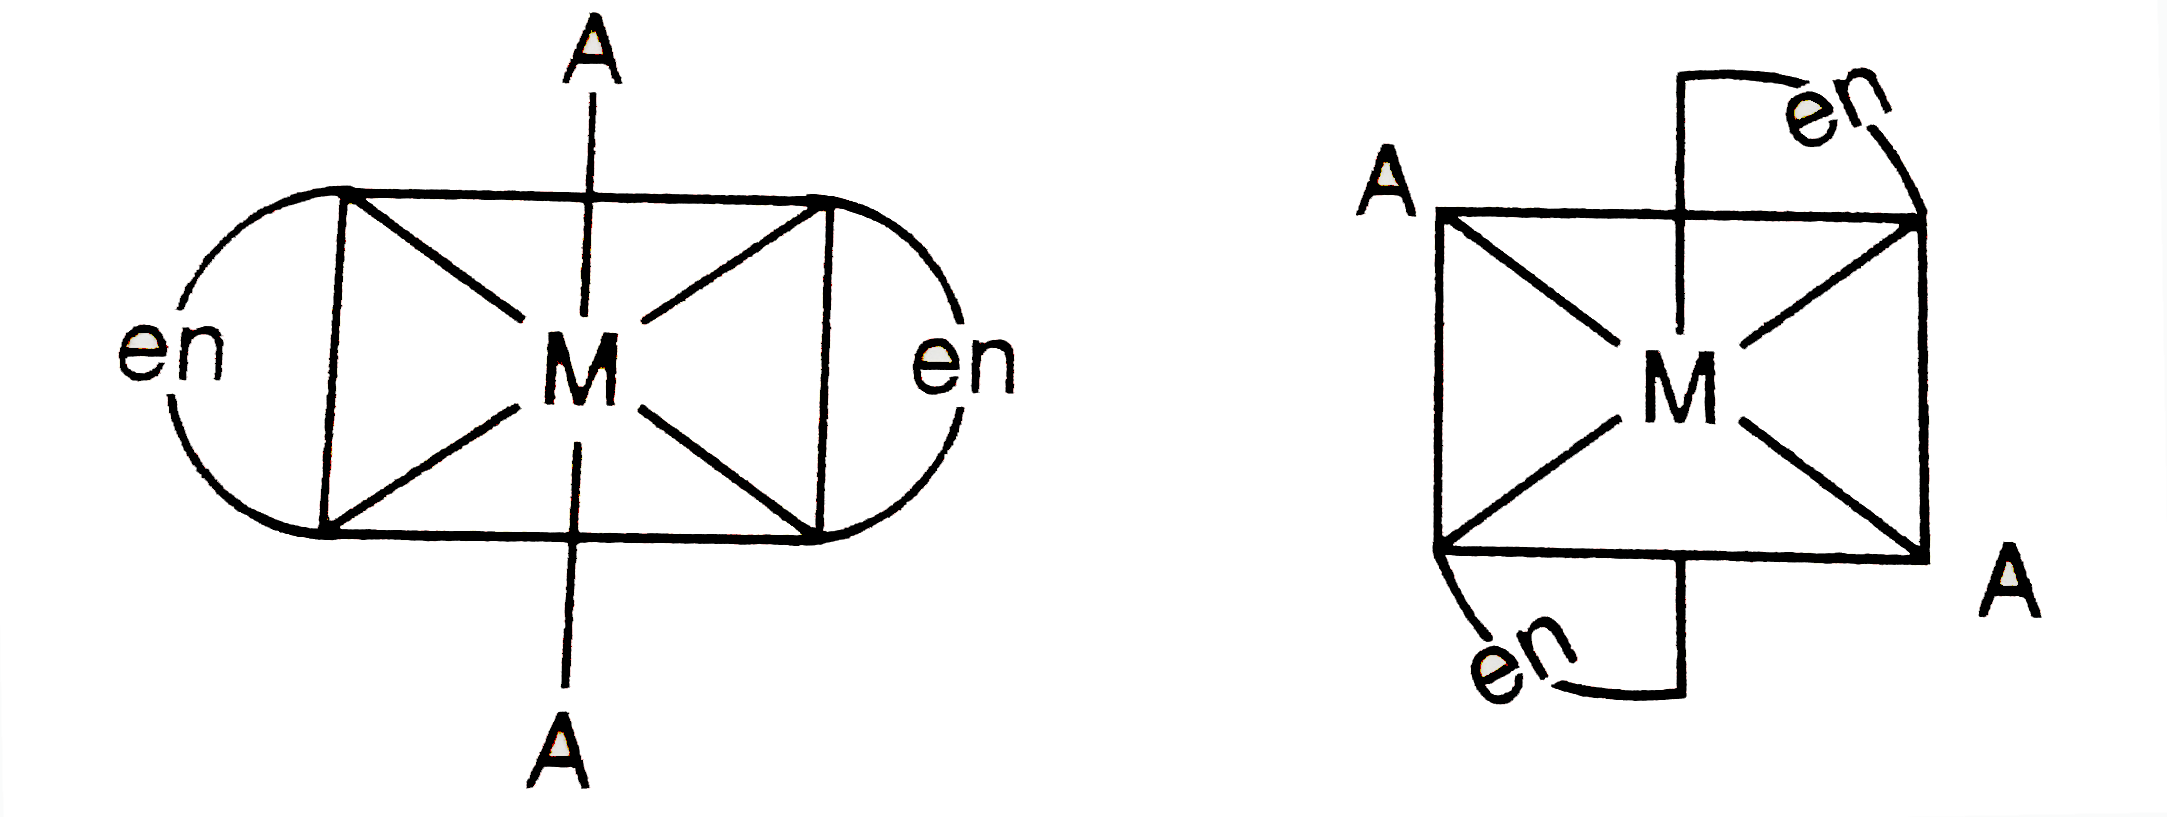 AGeometrical isomersBPosition isomersCOptical isomersDIdentical
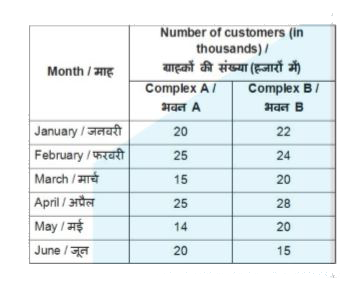
The table given below shows the number of customers (in thousand) visiting 2 shopping complexes A and B from january 2017 to June 2017.
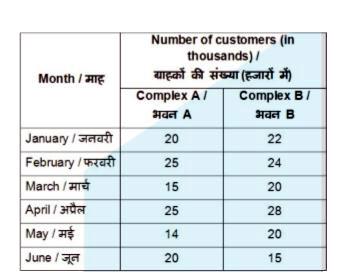
What is the total number of customers (in thousands) in the 2 complexes in the month of April?View SolutionThe table given below shows the number of customers (in thousand) visiting 2 shopping complexes A and B from january 2017 to June 2017.
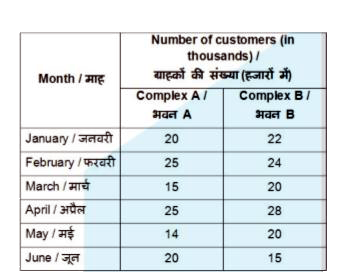
What is the average number of customers (in thousands) in complex B from February to May?View SolutionThe table given below shows the number of customers (in thousand) visiting 2 shopping complexes A and B from january 2017 to June 2017.
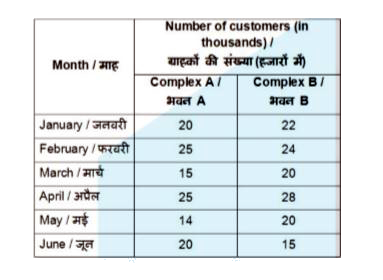
What is the maximum difference (in thousands) between the numbers of customers in the 2 complexes among the given months?View SolutionWhich of the figures given below show the adiabatic process ?
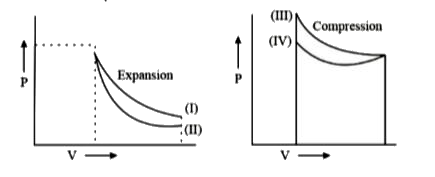 View Solution
The figure given below shows a cell undergoing meiosis.
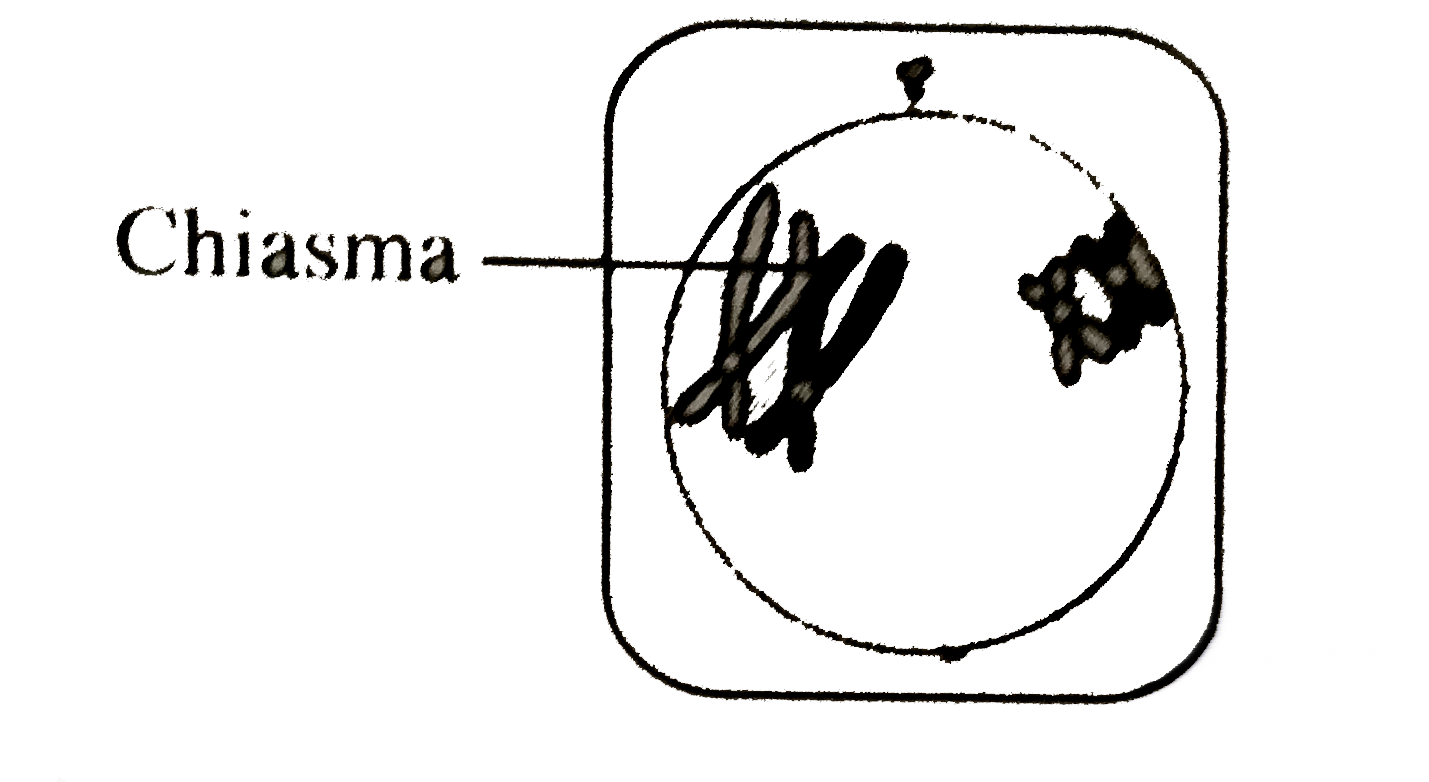
Which of the option below shows the next stage in the process?View Solution


