The following graph between Ψ2 probability density and distance from the nucleus represents -
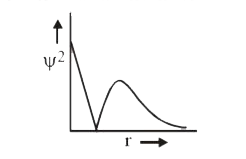
A
2s
B
3s
C
1s
D
4p
Video Solution
Text Solution
The correct Answer is:A
|
Answer
Step by step video, text & image solution for The following graph between Psi^(2) probability density and distance from the nucleus represents - by Chemistry experts to help you in doubts & scoring excellent marks in Class 12 exams.
Updated on:21/07/2023Topper's Solved these Questions
- ATOMIC STRUCTURE BOOK - MOTIONCHAPTER - ATOMIC STRUCTURE EXERCISE - EXERCISE-2 (LEVEL-II)
31 Videos
- ATOMIC STRUCTURE BOOK - MOTIONCHAPTER - ATOMIC STRUCTURE EXERCISE - EXERCISE-3
30 Videos
- ATOMIC STRUCTURE BOOK - MOTIONCHAPTER - ATOMIC STRUCTURE EXERCISE - EXERCISE-1
77 Videos
- AROMATIC COMPOUNDBOOK - MOTIONCHAPTER - AROMATIC COMPOUNDEXERCISE - Exercise - 4 | Level-II
16 Videos
- BIOMOLECULES & POLYMERSBOOK - MOTIONCHAPTER - BIOMOLECULES & POLYMERSEXERCISE - EXERCISE - 4 (LEVEL II)
17 Videos
Similar Questions
Knowledge Check
Which of the following is correct graph between Probability density sπ2(r) vs radial distance of electron (r) form nucleus for 3 s ?
A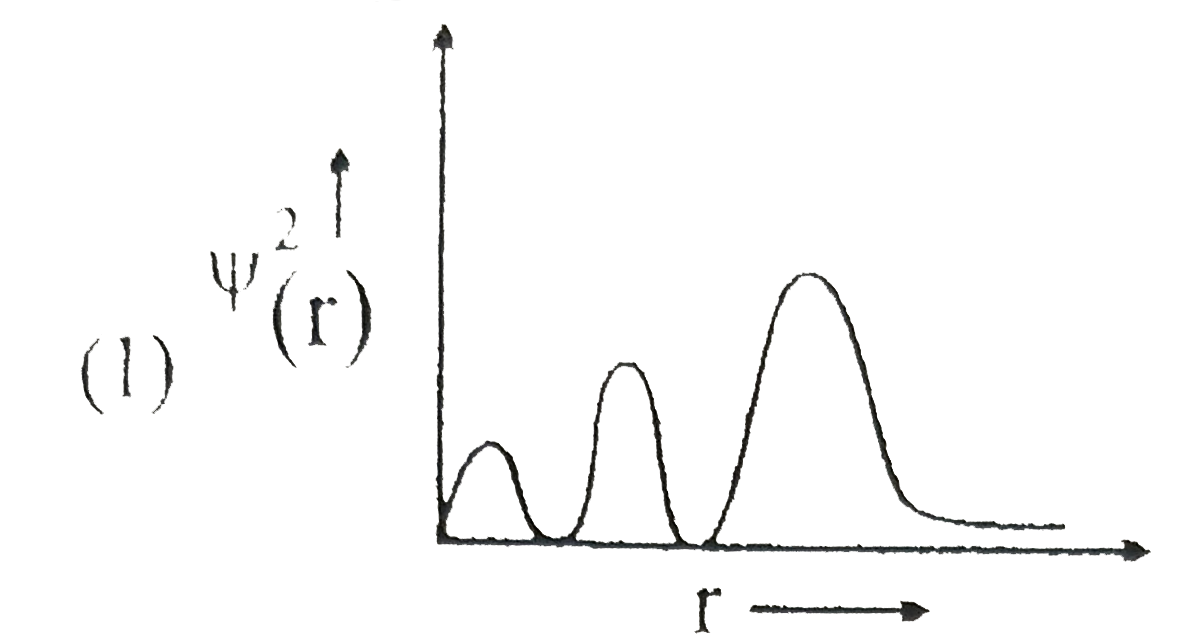 B
B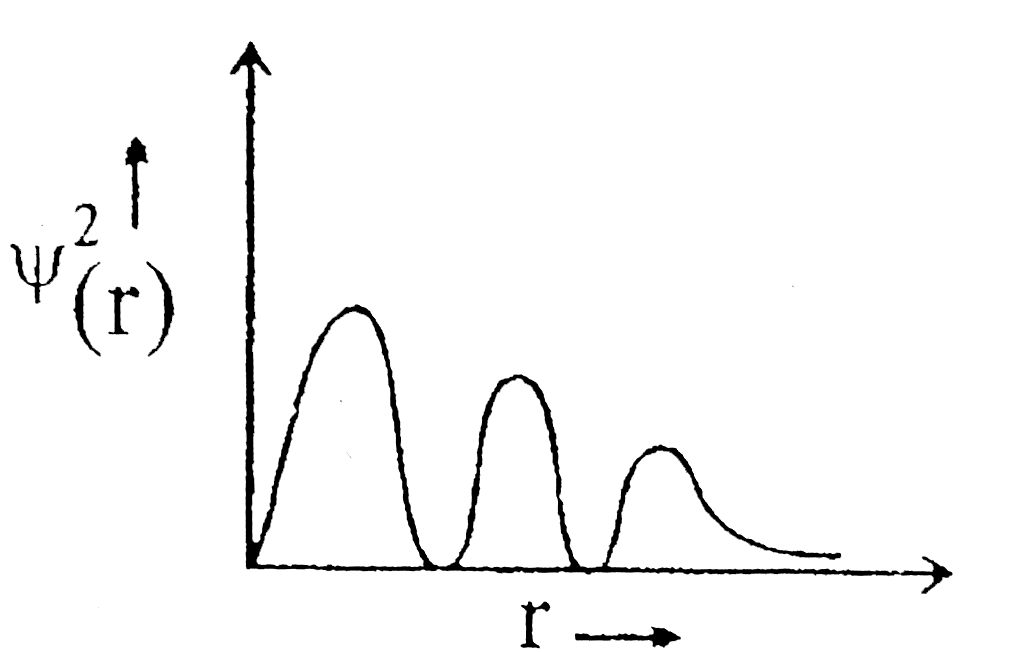 C
C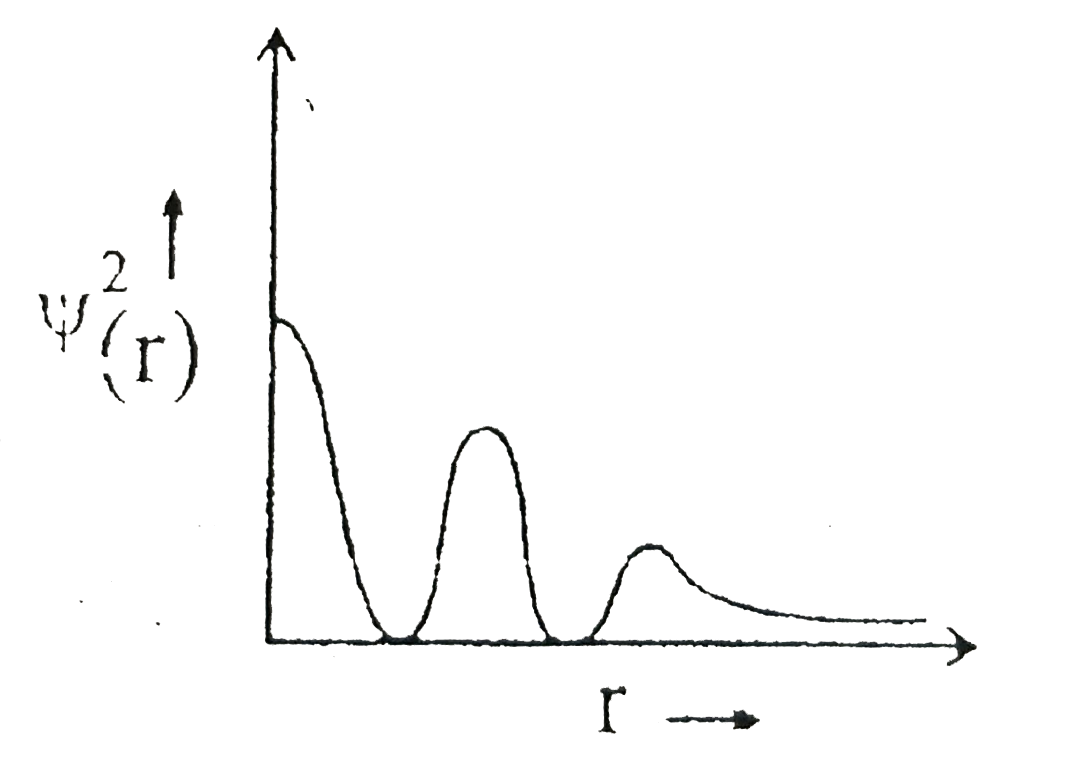 D
D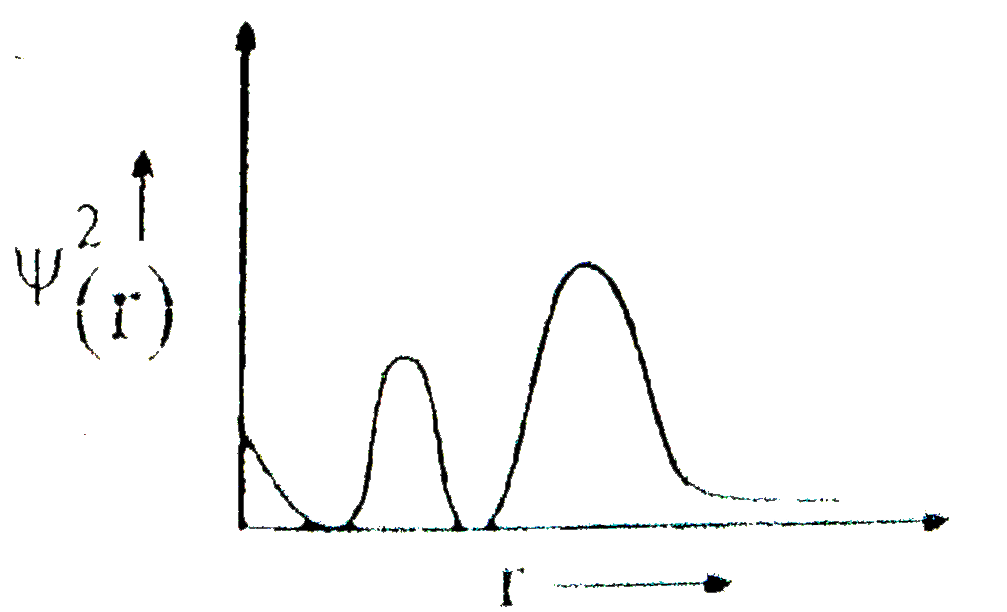
For which of the following orbitals is the radial probaility density R2 the maximum at the nucleus and descrease sharply as the distance form the nucleus increases?
A1sB2sC3sDAll the s orbitalsAssertion. The plots of probability density and radial probability function versus distance r from the nucleus for any particular orbital are not identical
Reason. Probability density is Ψ2 whereas radial probability function represents probability of finding the electron in a shell of thickness dr.AIf both assertion and reason are true, and reason is the true explanation of the assertionBIf both assertion and reason are true, but reason is not the true explanation of the assertionCIf assertion is true, but reason is falseDIf both assertion and reason are false
If earth is assumed to be a sphere of uniform density then plot a graph between acceleration due to gravity (g) and distance from the centre of earth.
View SolutionWhich one of the following graphs represents the variation of electric field with distance r from the centre of a charged spherical conductor of radius R?
View Solutionψ2=0 represent
View SolutionWhich of the following graph represents e−x?
View SolutionThe graph between the image distance (v ) and object distance (u) from the convex lens is
View Solution

