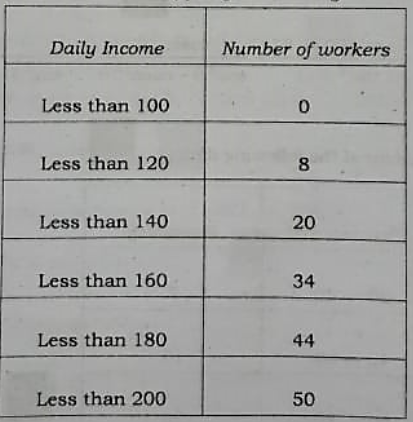
The following table gives the information of daily income of 50 workers of a factory. Draw a 'less than type ogive' for the given data:
 Solution in Kannada
Step by step video & image solution for The following table gives the information of daily income of 50 workers of a factory. Draw a 'less than type ogive' for the given data: by Maths experts to help you in doubts & scoring excellent marks in Class 10 exams.
Updated on:21/07/2023Similar Questions
The area of the shaded part in the figure given below is ______.

View SolutionThe inequation represented by the graph given below is :
View SolutionThe inequation that best describes the graph given below is _________
View SolutionThe inequation that best describes the following graph is _________
View SolutionWhich inequations represent the shaded region in the given figure
View SolutionMatch the items given in column A and B: ltimg src="https://d10lpgp6xz60nq.cloudfront.net/physics_images/NCERT_BIO_XII_C16_E01_004_Q01.png" width="80%"gt
View SolutionThe total surface area of the given solid figure is _______________.

View Solution
