दी गई आकृति AT वृत्त की स्पर्श रेखा है। यदि m∠ABC=50∘ तथा AC=BC तो ∠BAT है -
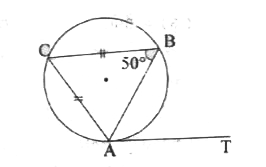
50∘
70∘
75∘
80∘
The correct Answer is:(घ )
Step by step video & image solution for दी गई आकृति AT वृत्त की स्पर्श रेखा है। यदि mangleABC=50^(@) तथा AC=BC तो angleBAT है - by Maths experts to help you in doubts & scoring excellent marks in Class 10 exams.
Updated on:21/07/2023Topper's Solved these Questions
- वृत्त एवं स्पर्श रेखा BOOK - SANJEEV PUBLICATIONCHAPTER - वृत्त एवं स्पर्श रेखा EXERCISE - अतिलघुतरात्मक प्रशन
10 Videos
- वृत्त एवं स्पर्श रेखा BOOK - SANJEEV PUBLICATIONCHAPTER - वृत्त एवं स्पर्श रेखा EXERCISE - लघुत्तरात्मक प्रशन
13 Videos
- वृत्त एवं स्पर्श रेखा BOOK - SANJEEV PUBLICATIONCHAPTER - वृत्त एवं स्पर्श रेखा EXERCISE - प्रशनमाला 13.2
6 Videos
- वृत्तBOOK - SANJEEV PUBLICATIONCHAPTER - वृत्तEXERCISE - अन्य महत्त्वपूर्ण प्रश्न (निबन्धात्मक प्रश्न)
7 Videos
- वृत्त की परिधि एवं क्षेत्रफल BOOK - SANJEEV PUBLICATIONCHAPTER - वृत्त की परिधि एवं क्षेत्रफल EXERCISE - अन्य महत्त्वपूर्ण प्रश्न (निबंधात्मक प्रश्न)
14 Videos
Similar Questions
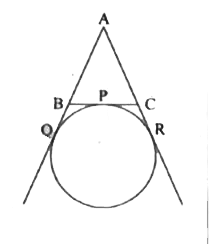
दी गई आकृति में △ABC का बहिर्वृत्त भुजाओ को Q ,P एवं R पर स्पर्श करता है। यदि AQ=8 सेमी हो तो △ABC का परिमाप ज्ञात कीजिए।
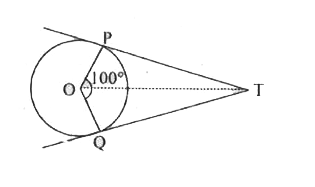
View Solutionचित्र में TP और TQ , O केंद्र वाले वृत्त कि स्पर्श रेखाएं। यदि ∠TOQ=50∘ हो ,तो ∠OTP ज्ञात कीजिए।
View Solutionआकृति को देखकर निम्न प्रशनो के उत्तर लिखिए-
∠BAQ का एकान्तर वृत्तखंड क्या है ?
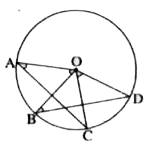
View Solutionआकृति में, चाप AB = चाप CD है, सिद्ध कीजिए कि ∠A=∠B है।
View Solutionचित्र मे छायांकित भाग का क्षेत्रफल ज्ञात कीजिये।
View SolutionHow many lines of symmetry does the above figure have ?
View SolutionWhich of the following are correct chain isomers of butane ? (i)
View SolutionDetermine the point of symmetry of a regular hexagon.
View SolutionDtermine the images of the following figure about the given line :
View SolutionMatch the following Column A to Column B

View SolutionMatch the following Column A to Column B

View SolutionMatch the following Column A to Column B

View SolutionFind the area of the figure given below.

View SolutionThe area of the shaded part in the figure given below is ______.

View SolutionThe inequation represented by the graph given below is :
View Solution
