Study the following table and answer the questions

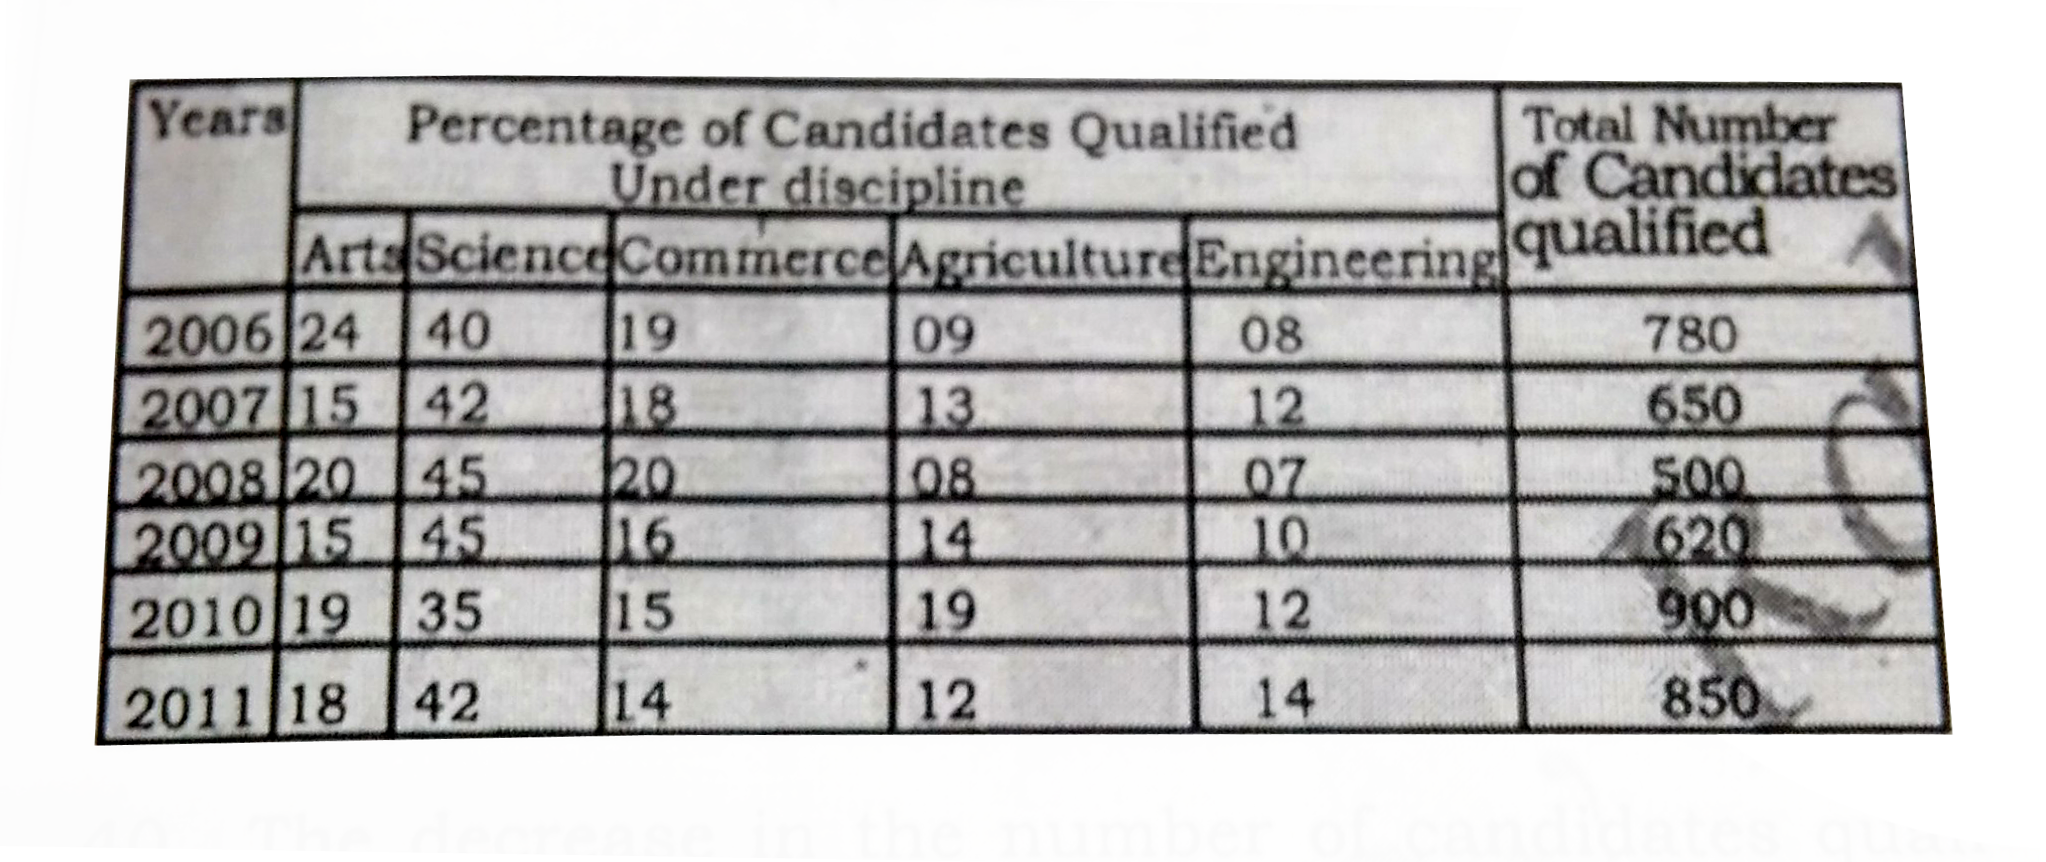
वर्ष 2006 से 2008 तक विज्ञानं समूह में प्रत्येक वर्ष पास होने वाले छात्रों की औसत संख्या उसी समूह में वर्ष 2009- 11 तक पास होने वाले छात्रों की औसत संख्या के बीच अंतर बताये ।
47
57
74
141
Candidates qualified under science discipline
In year 2006 =780×40100=312
Year 2008 ⇒500×45100=225
Year 2009 ⇒620×45100=279
Year 2010⇒900×35100=315
Year 2011⇒850×42100=357
Required average difference
=13{(279315+357)−(312+273+225)}
=13(951−810)=13×141=47
Topper's Solved these Questions
Similar Questions
सरल करें: 1+11+22+31+45
View SolutionA एक काम को 6 दिनों में तथा B उसी काम को 9 दिनों में कर सकता है दोनों मिलकर उस काम को कितने दिन में पूरा करेंगे ?
View SolutionMatch the following Column A to Column B

View Solutionयह ज्ञात है की महाविद्यालय के छात्रों में से 60 % छात्रावास में रहते है और 40 % छात्रावास में नहीं रहते है । पूर्ववर्ती वर्ष से परिणाम सूचित करते है की छात्रावास में रहने वाले छात्रों में से30 % छात्रों में से 20 % छात्रों ने A ग्रेड लिए। वर्ष के अंत में महाविद्यालय के एक छात्र को यादृच्छया चुना गया और पाया गया की उसे A ग्रेड मिला है । इस बात की क्या प्रायिकता है की वह छात्रावास में रहने वाला है ?
View SolutionThe average age of a group of 36 students is 23 years. 4 students leave the group whose average age is 22 years. What is the average age of new group in years ? ( Correct to one decimal place ).
36 छात्रों के समूह की औसत आयु 23 वर्ष है | 22 वर्ष की औसत आयु वाले 4 छात्र समूह छोड़ देते हैं | नए समूह की औसत आयु वर्षों में (एक दशमलव स्थान तक) कितनी है ?
View SolutionIn an examination, the average score of students in a class who passed is 69 and that of who failed is 61. If the average score of all the students, who appeared in the examination is 66, then the percentage of students who passed is:
एक परीक्षा में, किसी कक्षा में पास करने वाले छात्रों का औसत अंक 69 है तथा फेल करने वाले छात्रों का औसत अंक 61 है | यदि परीक्षा में शामिल होने वाले सभी छात्रों का औसत अंक 66 है, तो पास करने वाले छात्रों का प्रतिशत ज्ञात करें |
View SolutionThis table shows the number of students studying in various streams in different colleges. निम्नलिखित तालिका पांच कॉलेजों के तीन विषयों में पढ़ने वाले छात्रों की संख्या दर्शाती है | The number of students in the science stream of college C is approximately what percentage of students studying in that college? कॉलेज C में विज्ञान विषय में छात्रों की संख्या उस कॉलेज में पढ़ने वाले छात्रों की संख्या का लगभग कितना प्रतिशत है ?
View SolutionThe given Bar Graph presents the results in terms of number of students for the five academic years, 2013-2014 to 2017-2018. दिया गया दंड आरेख पांच शैक्षणिक वर्षों : 2013-2014 से 2017-2018 तक छात्रों की संख्या के संदर्भ में परिणामों को प्रस्तुत करता है | The difference between the number of students passed and those who failed is the highest in which academic year? किस शैक्षणिक वर्ष में पास करने वाले तथा फेल करने वाले छात्रों की संख्या में सर्वाधिक अंतर है ?
View SolutionThe given Bar Graph presents the number of students of two schools for six years. दिया गया दंड आरेख छः वर्ष की अवधि में दो विद्यालयों में छात्रों की संख्या को दर्शाता है | In which year, the absolute difference between the numbers of students in two schools is the highest? किस वर्ष में, दोनों विद्यालयों में छात्रों की संख्या के बीच पूर्ण अंतर सबसे अधिक है ?
View SolutionThe given Bar Graph presents the number of students of two schools for six years. दिया गया दंड आरेख छः वर्ष की अवधि में दो विद्यालयों में छात्रों की संख्या को दर्शाता है | What is the average number of students from school B during the six year period (correct to two decimal places)? छः वर्षों की अवधि में विद्यालय B के छात्रों की औसत संख्या कितनी रही है? (दशमलव के दो स्थान तक )
View SolutionThe given Bar Graph presents the number of students of two schools for six years. दिया गया दंड आरेख छः वर्ष की अवधि में दो विद्यालयों में छात्रों की संख्या को दर्शाता है | In which year, the percentage increase in students in school B is the highest in comparison to its previous year? किस वर्ष में, विद्यालय B में छात्रों की संख्या में प्रतिशत वृद्धि इसके पिछले वर्ष की तुलना में सबसे अधिक रही है?
View SolutionThe given Bar Graph presents the number of students of two schools for six years. दिया गया दंड आरेख छः वर्ष की अवधि में दो विद्यालयों में छात्रों की संख्या को दर्शाता है | In which year, the percentage increase of students in school A is the highest in comparison to its previous year? किस वर्ष, विद्यालय A में छात्रों की संख्या में प्रतिशत वृद्धि पिछले वर्ष की तुलना में सर्वाधिक है ?
View SolutionThe given Bar Graph presents the number of students of two schools for six years. दिया गया दंड आरेख छः वर्ष की अवधि में दो विद्यालयों में छात्रों की संख्या को दर्शाता है | What is the ratio of the number of students taken together for the years 2008, 2012 and 2013 in School A to the number of students taken together for the years 2008, 2012 and 2013 in school B? विद्यालय A में 2008, 2012 तथा 2013 को मिलाकर छात्रों की संख्या का विद्यालय B में 2008, 2012 तथा 2013 को मिलाकर होने वाले छात्रों की संख्या के साथ अनुपात ज्ञात करें |
View SolutionThe given Bar Graph presents the results in terms of the number of students in a school for the five academic years, 2013-2014 to 2017-2018. दिया गया दंड आरेख पांच शैक्षणिक वर्षों : 2013-2014 से 2017-2018 तक एक विद्यालय में छात्रों की संख्या के संदर्भ में परिणामों को प्रस्तुत करता है | In which academic year the difference between the number of students passed and that of those failed is the lowest? किस शैक्षणिक वर्ष में, पास करने वाले छात्रों तथा फेल करने वाले छात्रों की संख्या में सबसे कम अंतर है ?
View SolutionStudy the following frequency polygon and answer the questions. Given a line graph showing the number of students passed in Higher Secondary Examination in a school over the years 2008 to 2013:

The average of passed students in the years 2008, 2009, 2012 approximately is.
निम्नलिखित बारम्बारता बहुभुज का अध्ययन करें और दिए गए प्रश्नों के उत्तर दें। नीचे रेखा ग्राफ में एक स्कूल में वर्ष 2008 से 2018 तक के वर्षों में उच्चतर माध्यमिक परीक्षा में उत्तीर्ण होने वाले विद्यार्थियों की संख्या दर्शायी गई है :
वर्ष 2008, 2009, 2012 में उत्तीर्ण होने वाले विद्यार्थियों की संख्या का औसत लगभग क्या था?
View SolutionStudy the following frequency polygon and answer the questions. Given a line graph showing the number of students passed in Higher Secondary Examination in a school over the years 2008 to 2013:

The increase in percentage of passed students from 2008 to 2011 approximately is.
निम्नलिखित बारम्बारता बहुभुज का अध्ययन करें और दिए गए प्रश्नों के उत्तर दें। नीचे रेखा ग्राफ में एक स्कूल में वर्ष 2008 से 2018 तक के वर्षों में उच्चतर माध्यमिक परीक्षा में उत्तीर्ण होने वाले विद्यार्थियों की संख्या दर्शायी गई है :
वर्ष 2008 से 2011 तक उत्तीर्ण होने वाले विद्यार्थियों की प्रतिशतता में लगभग कितनी वृद्धि हुई है?
View Solution
