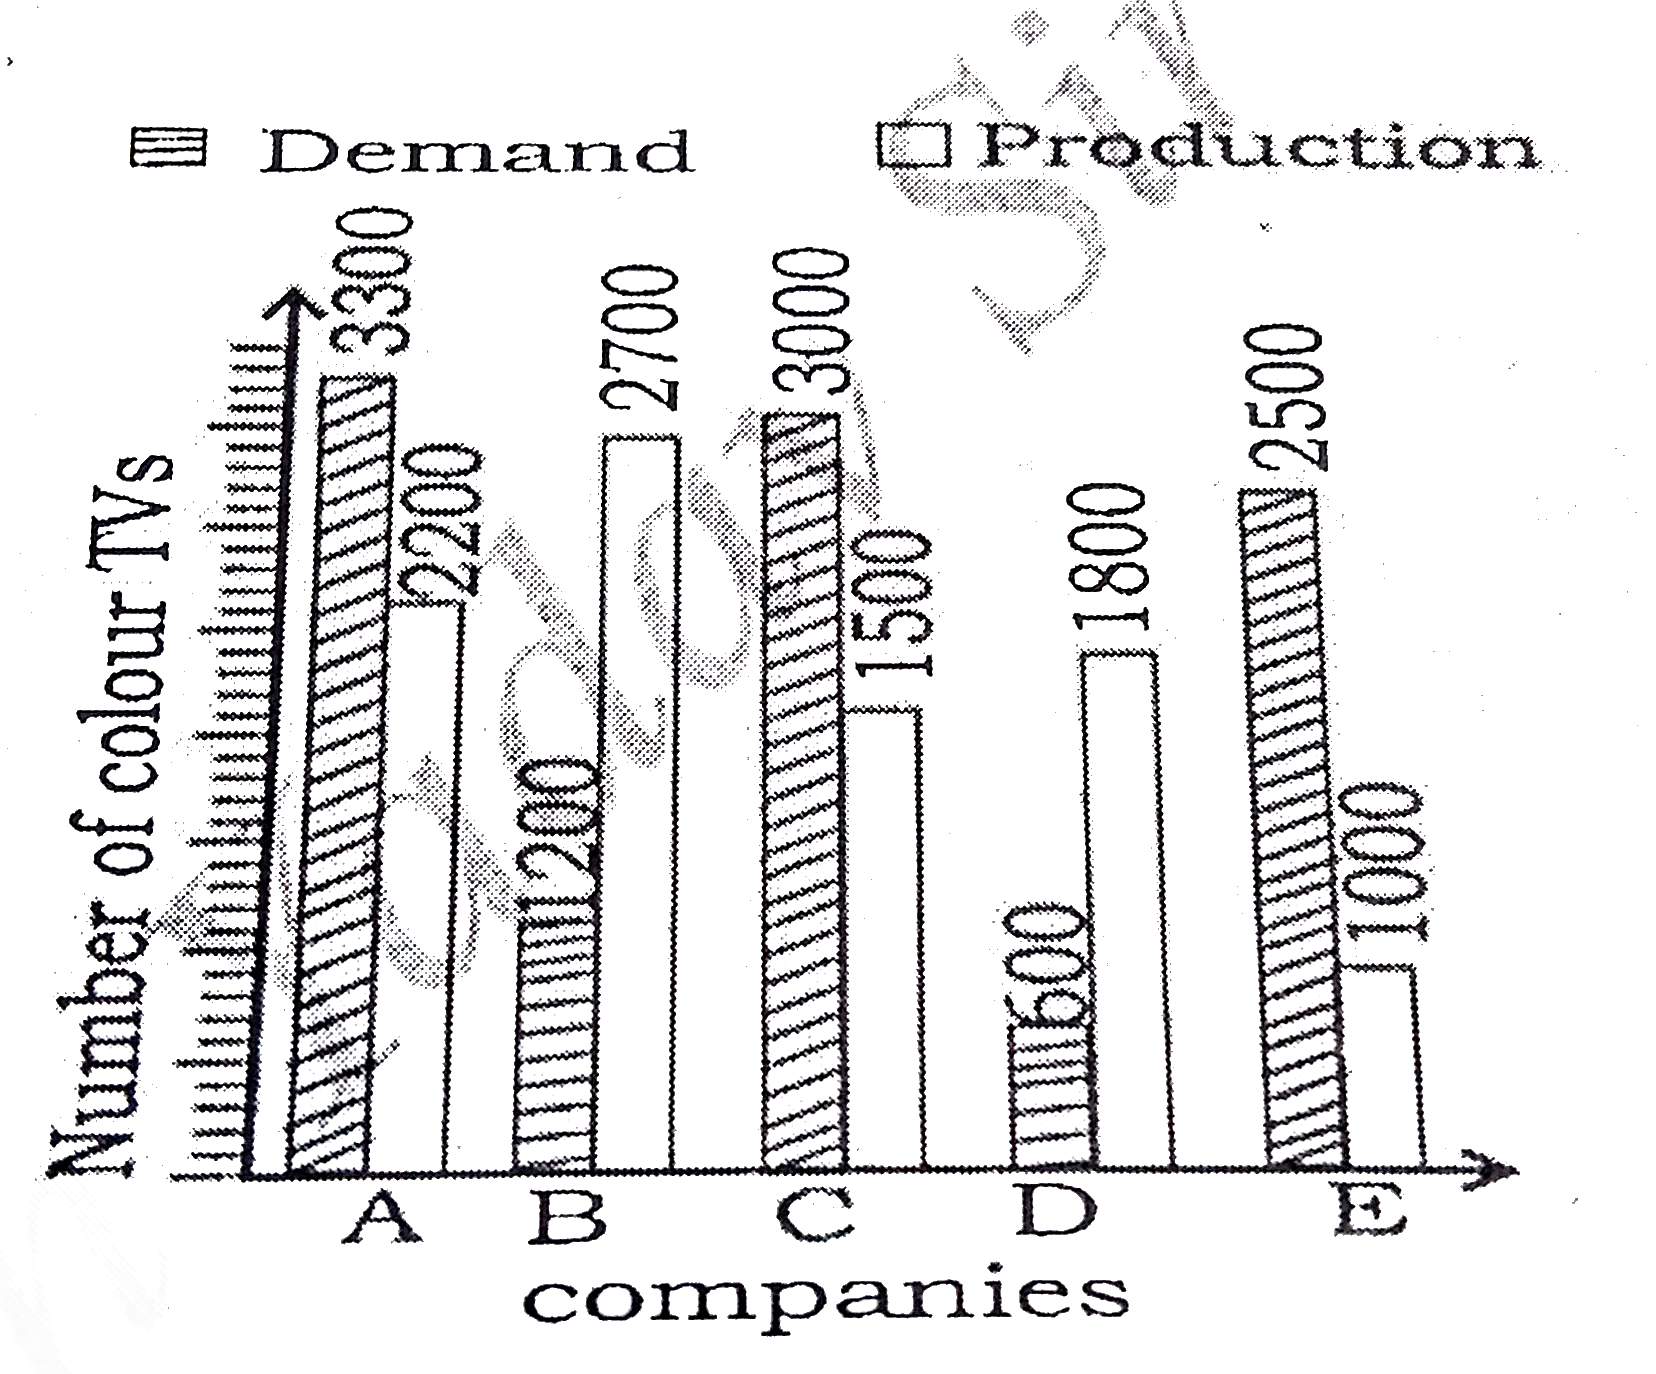
Study the bar diagram and answer the following questions Demand and products of colour TV of five companies A,B,C,D and E (Number on the top of a bar is the number of colour TVs)

पांचो कंपनियों की औसत मांग तथा औसत उत्पादन के बीच अंतर बताये :
1400
400
280
138
Required difference
Topper's Solved these Questions
Similar Questions
सरल करें: 1+11+22+31+45
View SolutionA एक काम को 6 दिनों में तथा B उसी काम को 9 दिनों में कर सकता है दोनों मिलकर उस काम को कितने दिन में पूरा करेंगे ?
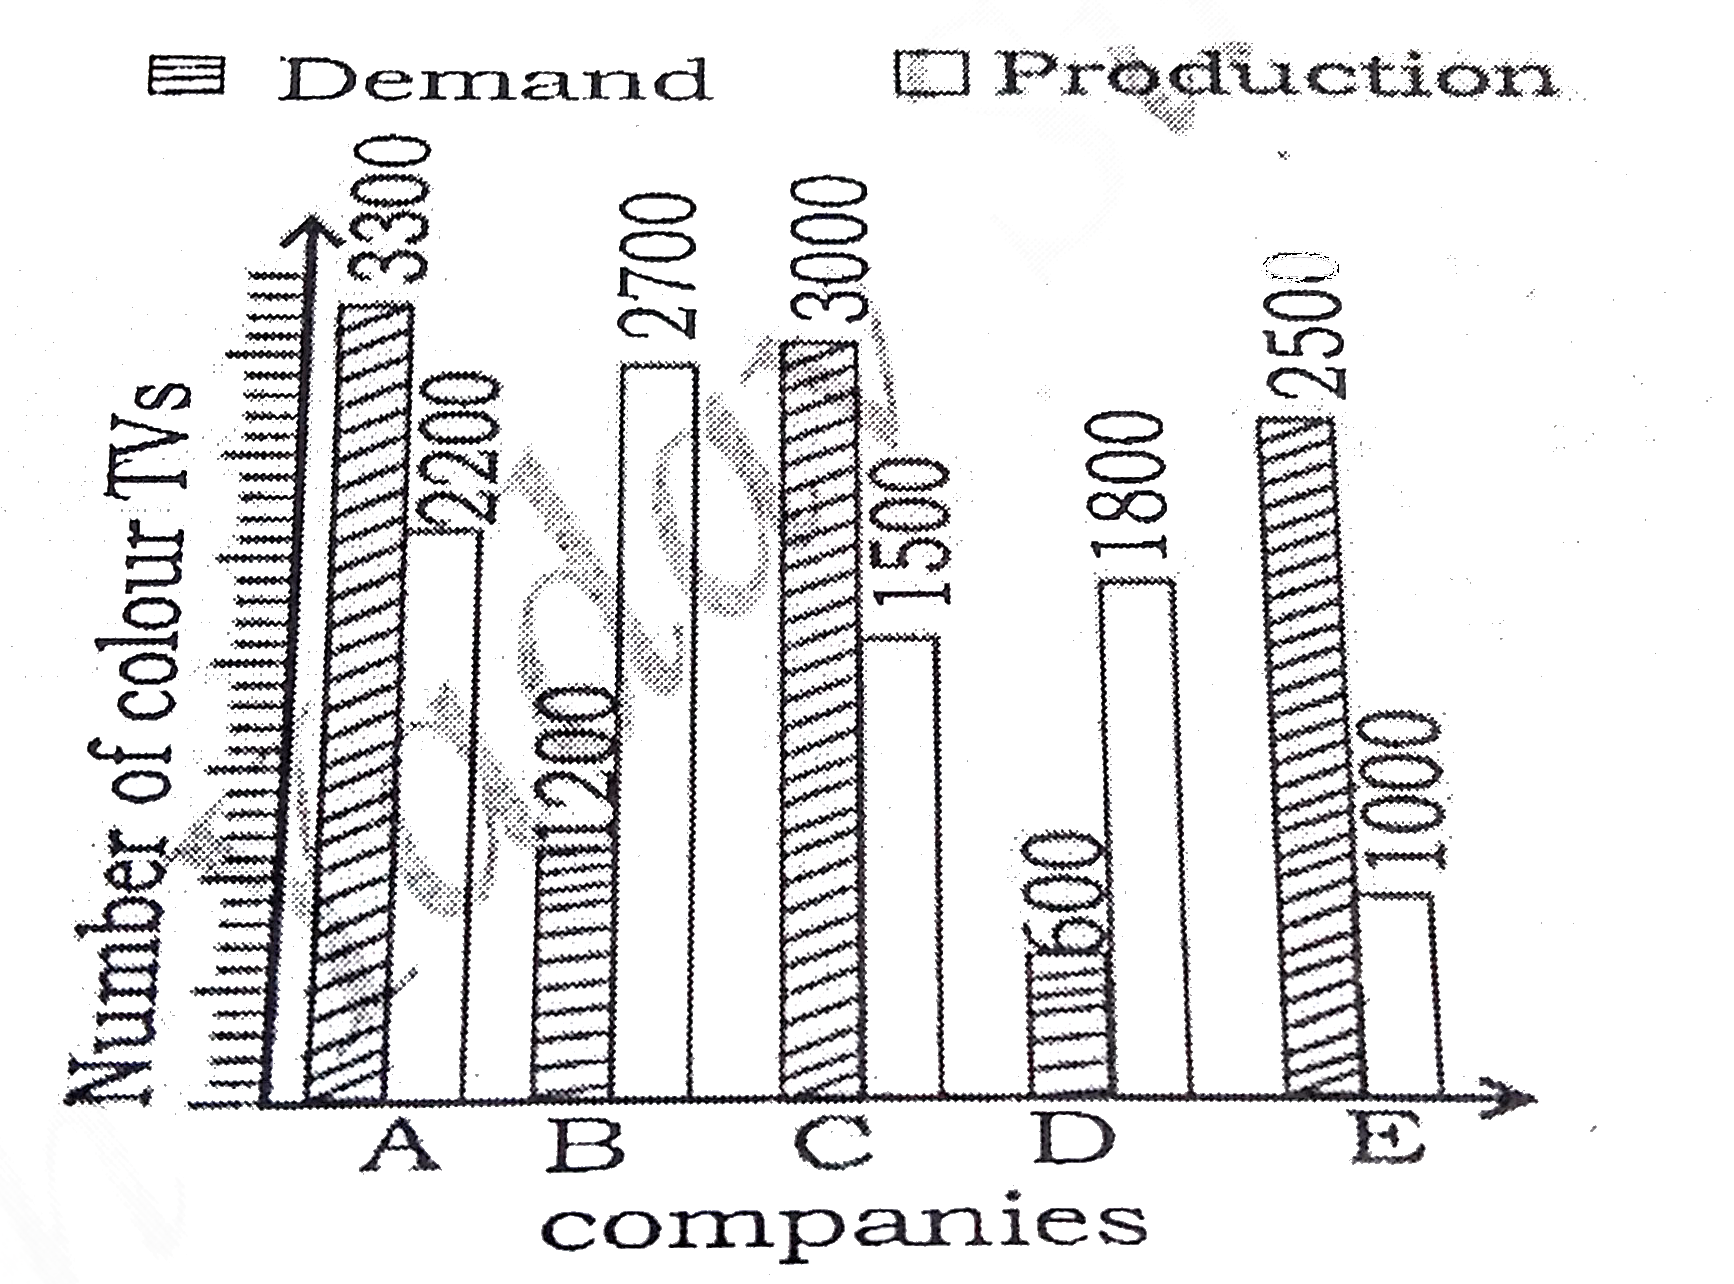
View SolutionStudy the bar diagram and answer the following questions Demand and products of colour TV of five companies A,B,C,D and E (Number on the top of a bar is the number of colour TVs)

उत्पादन की तुलना में अधिक मांग तथा मांग की तुलना में अधिक उत्पादन वाली कंपनियों की संख्या में अनुपात बताये :
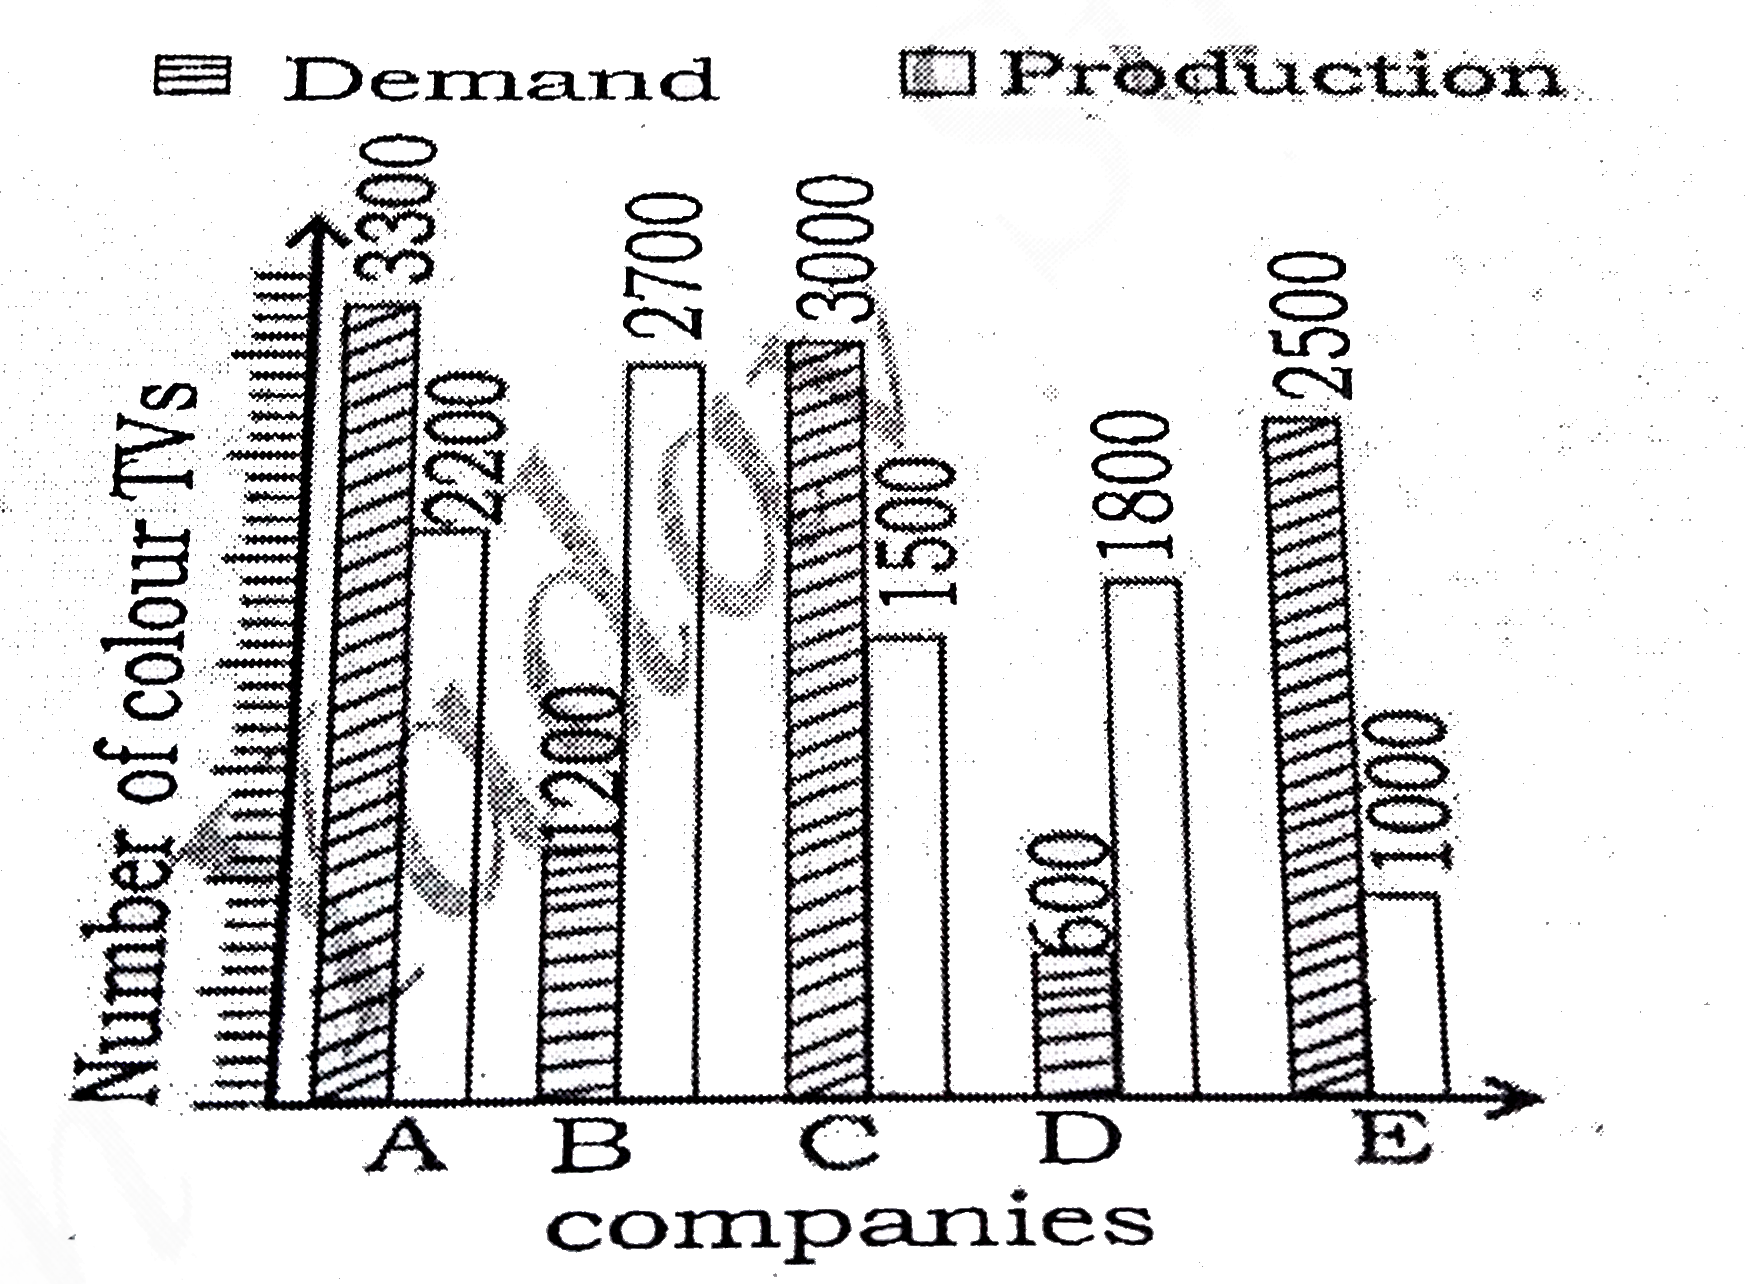
View SolutionStudy the bar diagram and answer the following questions Demand and products of colour TV of five companies A,B,C,D and E (Number on the top of a bar is the number of colour TVs)

कंपनी 'D' की मांग कंपनी 'E' की मांग की कितनी % है ।
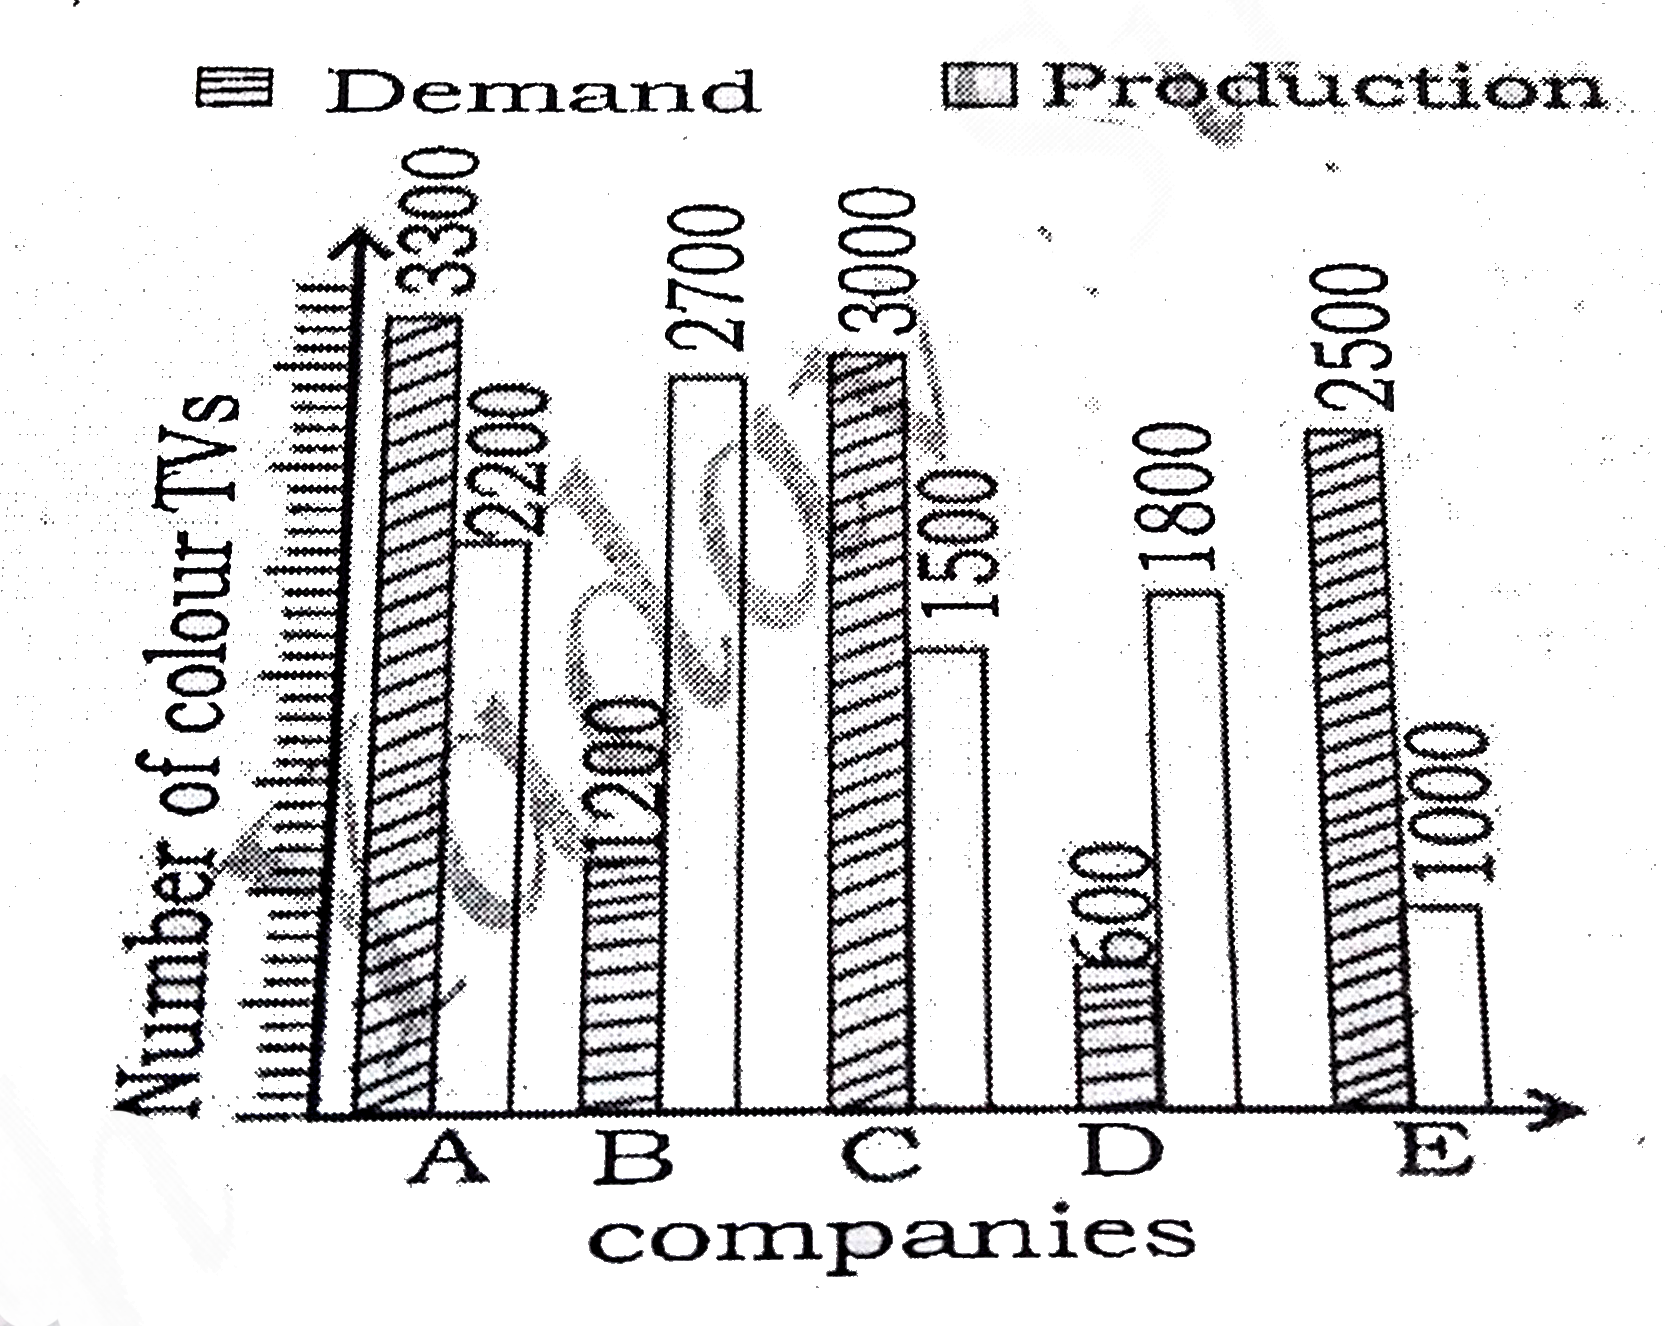
View SolutionStudy the bar diagram and answer the following questions Demand and products of colour TV of five companies A,B,C,D and E (Number on the top of a bar is the number of colour TVs)

कंपनी B तथा की औसत मांग तथा औसत उत्पादन के बीच अनुपात बताये ।
View SolutionHow many lines of symmetry does the above figure have ?
View SolutionWhich of the following are correct chain isomers of butane ? (i)
View SolutionDetermine the point of symmetry of a regular hexagon.
View SolutionDtermine the images of the following figure about the given line :
View SolutionMatch the following Column A to Column B

View SolutionMatch the following Column A to Column B

View SolutionMatch the following Column A to Column B

View SolutionThe inequation represented by the graph given below is :
View SolutionThe inequation that best describes the graph given below is _________
View SolutionThe inequation that best describes the following graph is _________
View Solution
