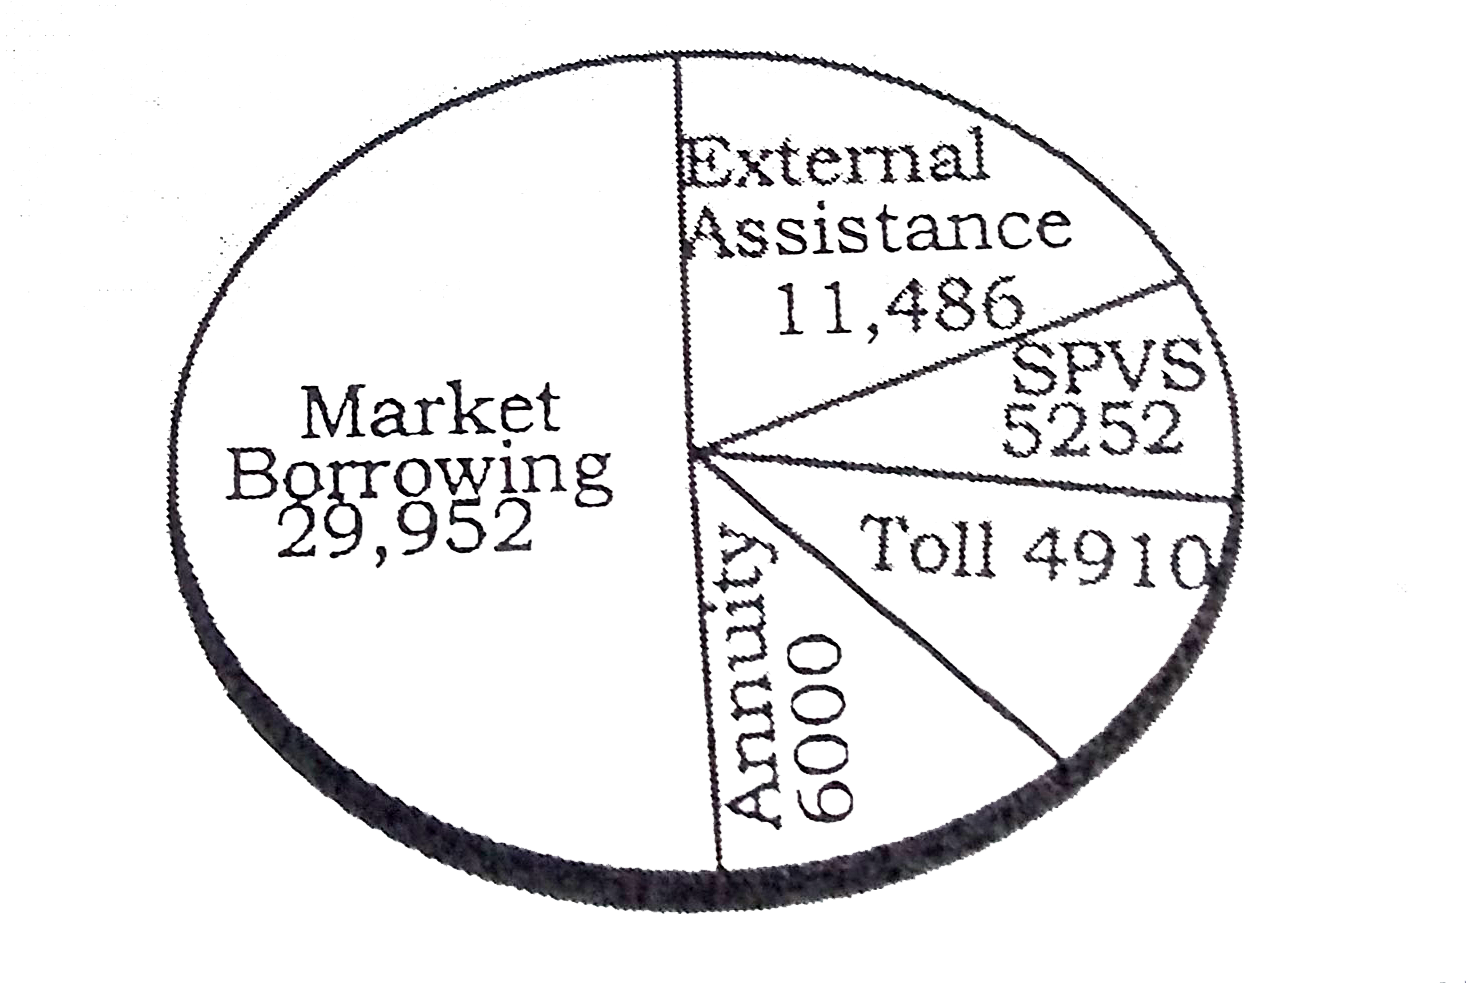
निर्देश :- दिए गए चार्ट में राष्ट्रीय राजमार्ग प्राधिकरण (NHAI) के द्वारा फ़ैज़-II परियोजनाओं के लिए धन जमा करने के विभिन्न स्रोतों को दर्शाया गया है पाई चार्ट को ध्यान से पढ़कर प्रश्नो के उत्तर दे ?

बाजार ऋण दर्शाने वाले भाग का केंद्रीय कोण क्या होगा ?
52∘
137.8
187.2∘
192.4∘
Total funds =29,952+11
486+5252+4910+6000=57600
57600=360∘
then 29,952=2995257600×100=52∘
Topper's Solved these Questions
Similar Questions
सरल करें: 1+11+22+31+45
02:11View SolutionA एक काम को 6 दिनों में तथा B उसी काम को 9 दिनों में कर सकता है दोनों मिलकर उस काम को कितने दिन में पूरा करेंगे ?
02:45View SolutionDetermine the point of symmetry of a regular hexagon.
02:17View SolutionMatch the following Column A to Column B
 05:41View Solution
Match the following Column A to Column B
 02:10View Solution
Match the following Column A to Column B
 02:17View Solution
The inequation represented by the graph given below is :
02:10View SolutionThe inequation that best describes the graph given below is _________
View SolutionThe inequation that best describes the following graph is _________
01:37View Solutionनिम्नलिखित पद्यांशों को पढ़कर नीचे दिए प्रश्नो के उत्तर लिखिए : '' जो तोको काँटा बुवै, ताहि बोय तू फूल । तोहि फूल को फूल है, वाको है तिरसूल ।।'' हमारे लिए काँटा बोने वाले के लिए फूल बोने पर हमें क्या मिलेगा ?
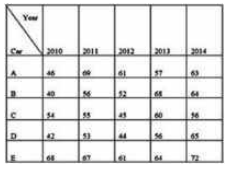
02:04View SolutionThe table shows the production of different types of cars (in thousands). यह तालिका अलग-अलग प्रकार के कारों का उत्पादन ( हज़ार में) दर्शाती है | If the data related to the production of cars of type E is represented by a pie chart, then the central angle of the sector representing the data of production of cars in 2013 will be: यदि E प्रकार की कारों के उत्पादन से संबंधित आंकड़ों को एक पाई-चार्ट के द्वारा प्रदर्शित किया जाए, तो 2013 में कारों के उत्पादन के आंकड़ों को दर्शाने वाले खंड का केंद्रीय कोण होगा :
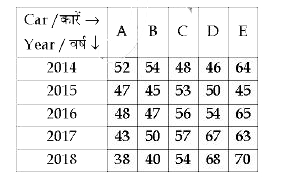
02:00View SolutionThe table shows the production of different types of cars by a company (in thousands) in 5 years.
 If the data related to the production of cars in 2018 is represented by pie chart, then the central angle of the sector representing the production of type C cars will be:
यदि 2018 में कारों के उत्पादन से संबंधित आंकड़ों को एक पाई-चार्ट में प्रस्तुत किया जाए, तो C प्रकार की कारों के उत्पादन को दर्शाने वाले खंड का केंद्रीय कोण होगा :02:48View SolutionThe table shows the production of different types of cars (in thousands).
यह तालिका एक कंपनी द्वारा 5 वर्षों में अलग-अलग कारों के उत्पादन (हज़ार में ) को दर्शाती है | If the data related to the production of type D cars is represented by a pie chart, then the central angle of the sector representing the production of
cars in 2013 will be:
यदि D प्रकार की कारों के उत्पादन से संबंधित आंकड़ों को एक पाई-चार्ट में प्रस्तुत किया जाए, तो 2013 में कारों के उत्पादन को दर्शाने वाले खंड का केंद्रीय कोण होगा :02:28View SolutionThe table shows the production of different types of cars (in thousands).
यह तालिका एक कंपनी द्वारा अलग-अलग कारों के उत्पादन ( हज़ार में ) को दर्शाती है |
If the data related to the production of type E cars is represented by a pie-chart, then the central angle of the sector representing production of cars in 2013 will be:
यदि E प्रकार की कारों के उत्पादन से संबंधित आंकड़ों को एक पाई-चार्ट में प्रस्तुत किया जाए, तो 2013 में कारों के उत्पादन को दर्शाने वाले खंड का केंद्रीय कोण होगा :02:00View SolutionThe table shows the production of different types of cars (in thousands).
यह तालिका एक कंपनी द्वारा अलग-अलग कारों के उत्पादन (हज़ार में ) को दर्शाती है | If the data related to the production of type C cars is represented by a pie-chart, then the central angle of the sector representing production of cars in 2012 will be:
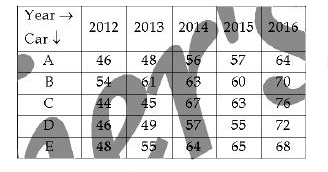
यदि C प्रकार की कारों के उत्पादन से संबंधित आंकड़ों को एक पाई-चार्ट में प्रस्तुत किया जाए, तो 2012 में कारों के उत्पादन को दर्शाने वाले खंड का केंद्रीय कोण होगा :01:15View SolutionThe table shows the production of different types of cars (in thousands). यह तालिका एक कंपनी द्वारा अलग-अलग कारों के उत्पादन (हज़ार में ) को दर्शाती है | If the data related to the production of type B cars is represented by a pie chart, then the central angle of the sector representing the production of cars in 2016 is: यदि B प्रकार की कारों के उत्पादन से संबंधित आंकड़ों को एक पाई-चार्ट में प्रस्तुत किया जाए, तो 2016 में कारों के उत्पादन को दर्शाने वाले खंड का केंद्रीय कोण होगा :
02:56View Solution

