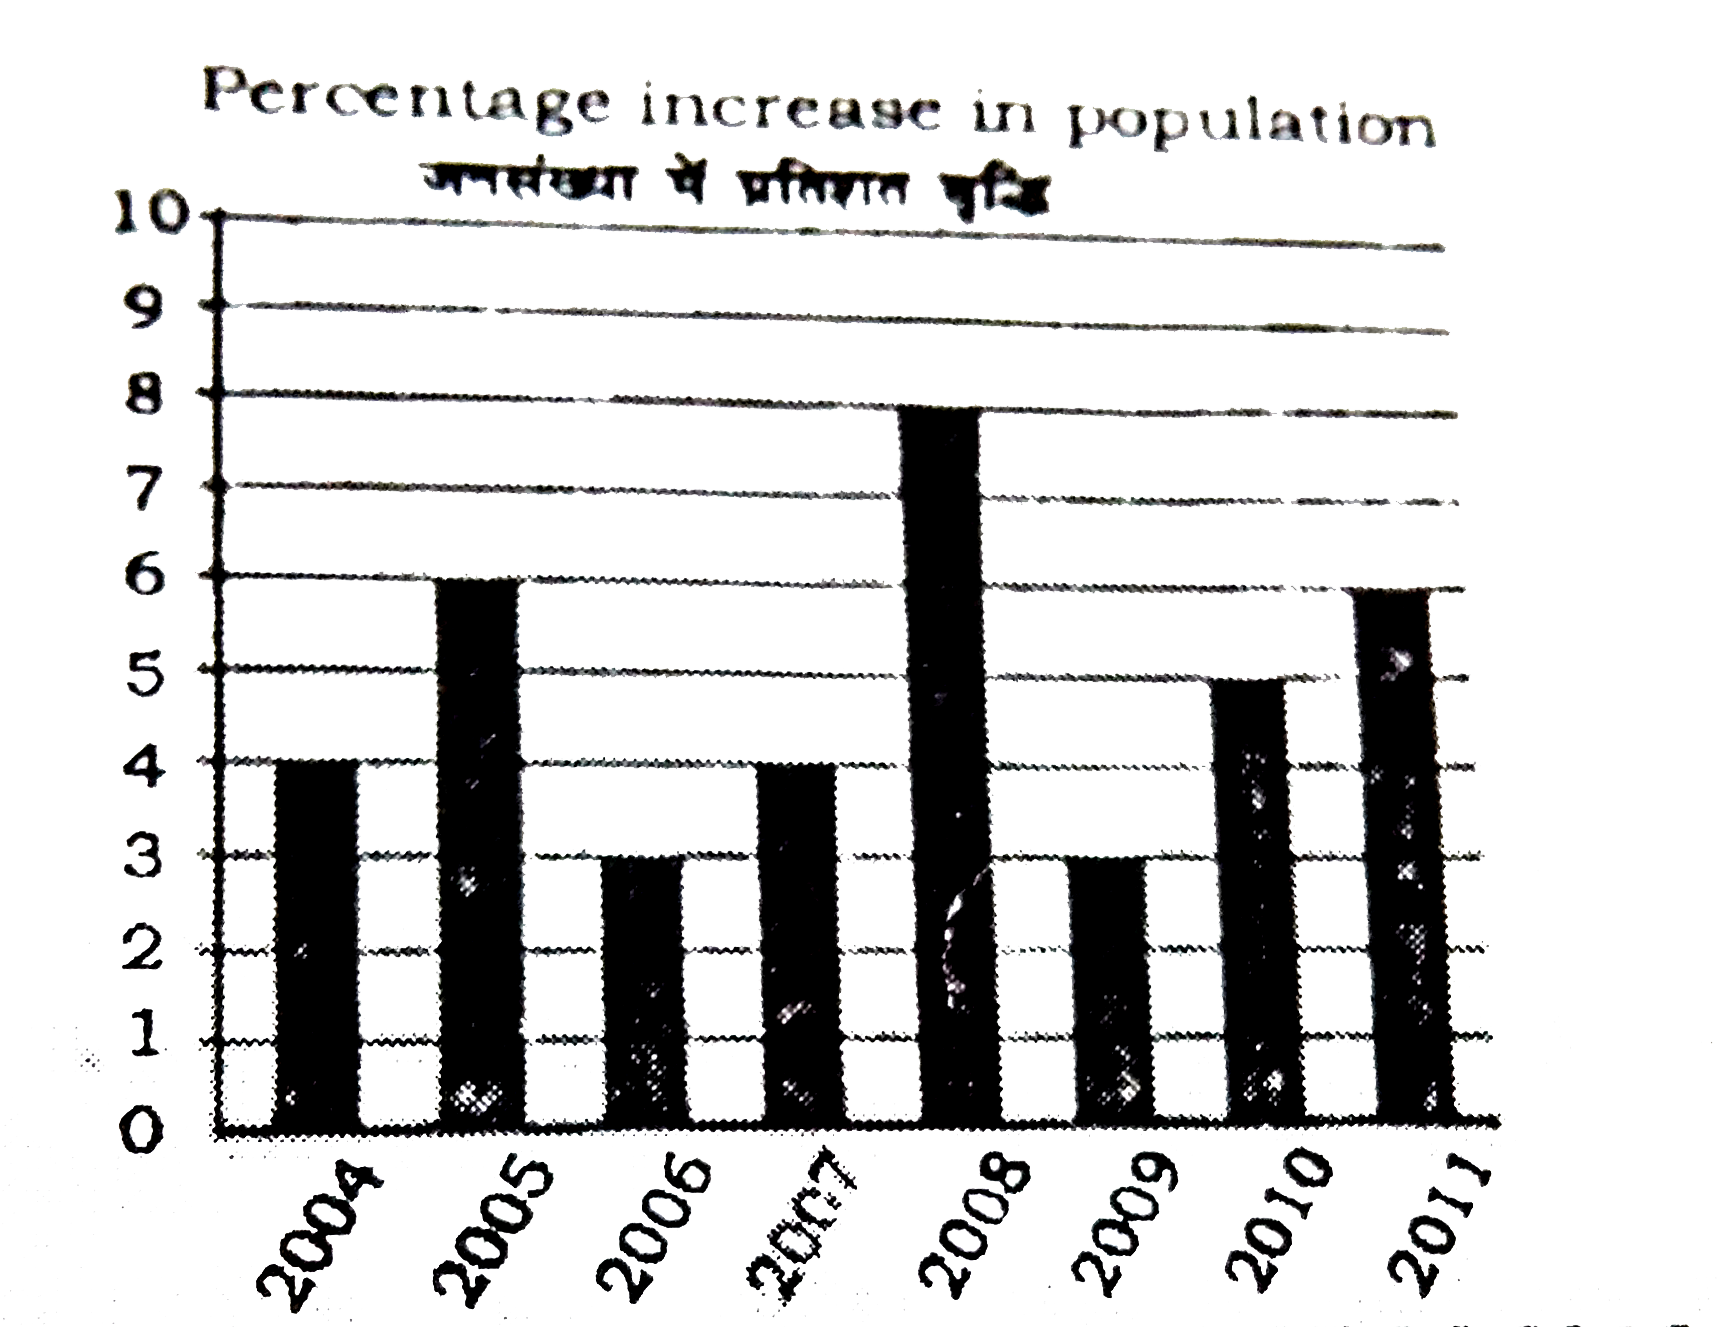
निमिन्लिखित तालिका दिए गए वर्षो में किसिस नगर की जनसख्या के प्रतिसत परिवर्तन को दर्शाती है! दिए गए चार्ट को पढ़े और पर्सन उतर दे!

2005 से 2008 तक नगर की जनसँख्या विर्धि का प्रतिसत क्या था?
0.19
0.3333
0.226
can't determined
The correct Answer is:D
Step by step video & image solution for निमिन्लिखित तालिका दिए गए वर्षो में किसिस नगर की जनसख्या के प्रतिसत परिवर्तन को दर्शाती है! दिए गए चार्ट को पढ़े और पर्सन उतर दे! 2005 से 2008 तक नगर की जनसँख्या विर्धि का प्रतिसत क्या था? by Maths experts to help you in doubts & scoring excellent marks in Class 14 exams.
Similar Questions
The area of the shaded part in the figure given below is ______.
 02:03View Solution
The inequation represented by the graph given below is :
02:10View SolutionThe inequation that best describes the graph given below is _________
02:17View SolutionThe inequation that best describes the following graph is _________
02:10View SolutionWhich inequations represent the shaded region in the given figure
04:23View Solutionदिए गए व्यापक हल वाले अवकल समीकरण का निर्माण|दिए गए वक्रों के कुल को निरूपित करने वाले अवकल समीकरण के निर्माण की प्रक्रिया#!#उदाहरण
54:49View Solution'A' is the portion of adenophypophysis which secrets different hormones 'A' is____
01:54View SolutionIdentify A,B,C and D,E
02:22View Solution

