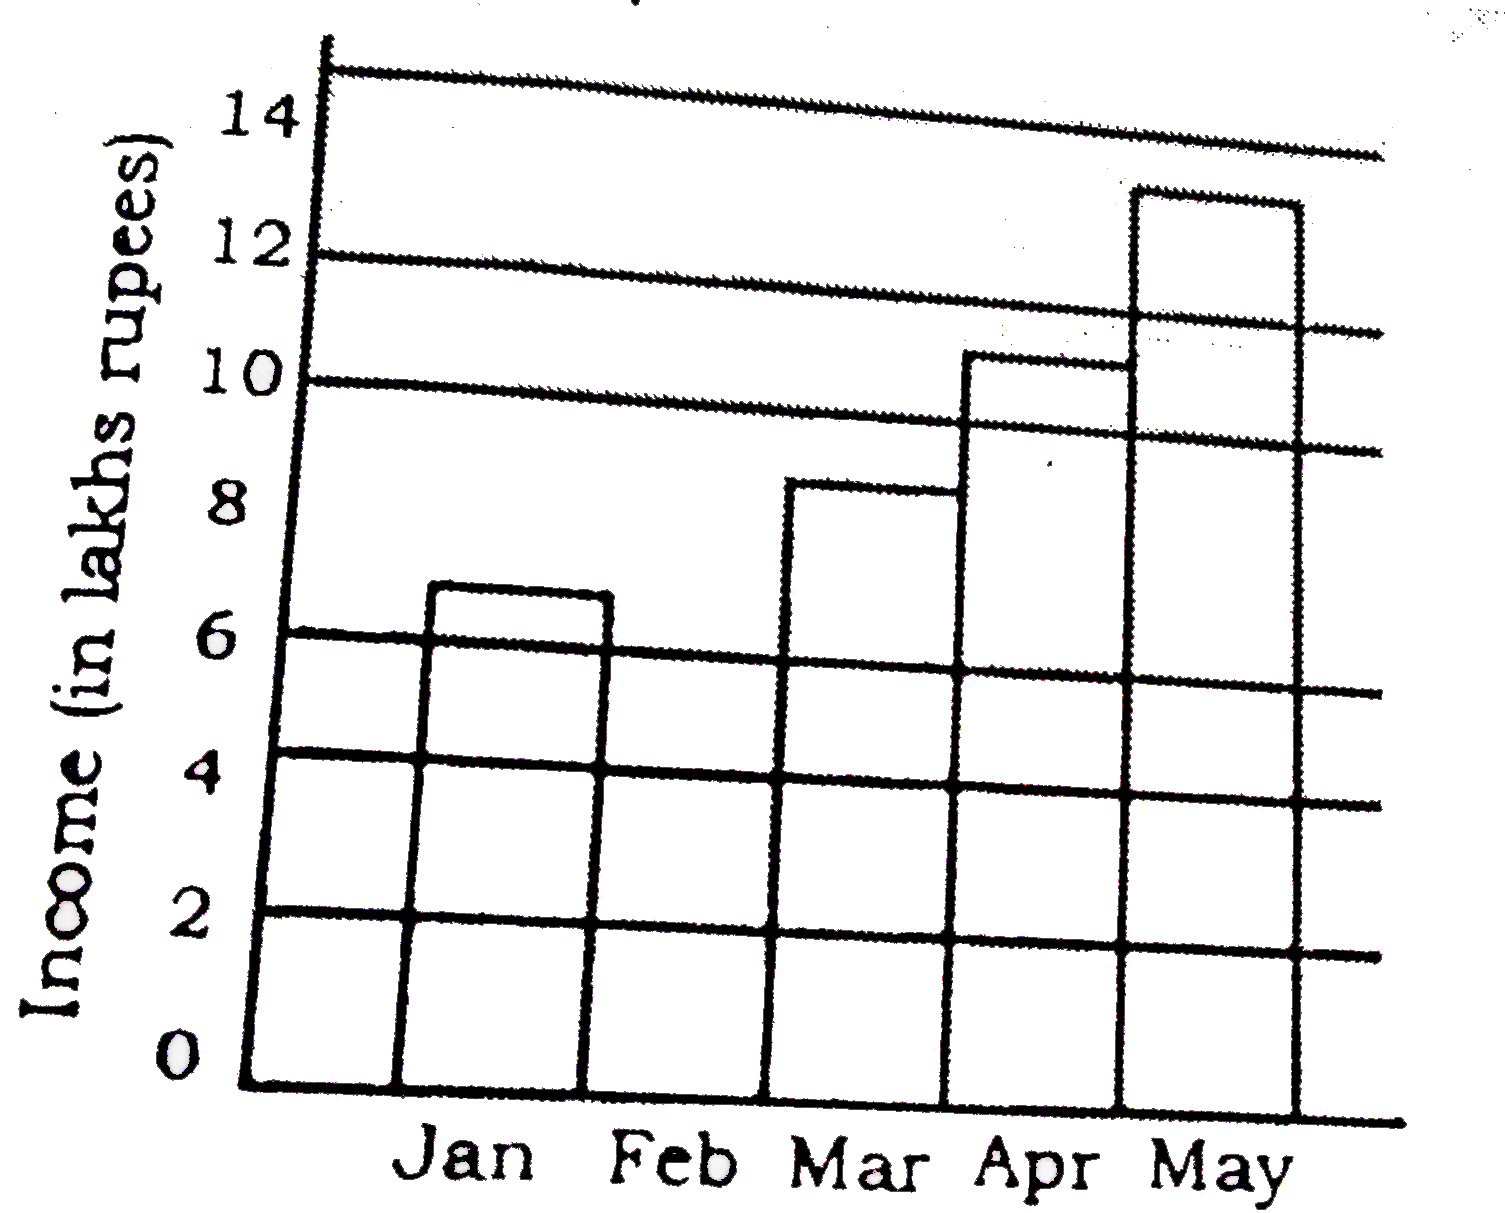
यहाँ दिया गया बार ग्राफ एक कंपनी की आय दर्शता है। बार ग्राफ का अध्ययन कीजिये और प्रशनो के उत्तर दीजिये?

कंपनी की औसत माशीक आय (लाख रु में) क्या है ?
7.6
6
8.8
None of these/ इनमे से कोई नहीं
The average monthly income of the firm
=7+4+9+11+135=445=8.8
Similar Questions
In the given bar graph, the Blue bar shows the income and the Red bar shows the expenditure of a company. Study the graph and answer the question that follows
दिए गए दंड आरेख में, नीला दंड एक कंपनी की आय दिखाता है और लाल दंड खर्च (लाख रुपये में) को दर्शाता है। आरेख का अध्ययन करें और उस प्रश्न का उत्तर दें जो नीचे पूछा गया है। The income in 2001 was equal to the expenditure in the year:
2001 में आय किस वर्ष के व्यय के बराबर है :01:15View SolutionIn the given bar graph, the Blue bar shows the income and the Red bar shows the expenditure of a company. Study the graph and answer the question that follows
दिए गए दंड आरेख में, नीला दंड एक कंपनी की आय दिखाता है और लाल दंड खर्च (लाख रुपये में) को दर्शाता है। आरेख का अध्ययन करें और उस प्रश्न का उत्तर दें जो नीचे पूछा गया है। The percentage decrease in the income of the company in 2002 as compared to that in 2001 is:
2001 की तुलना में 2002 में कंपनी की आय में कितने प्रतिशत में कमी आई है:01:21View SolutionThe given Bar Graph presents Income and Expenditure (in crores of Rupees) of a company for five years, 2014 to 2018. The average Income (per year) of the company in five years is what percentage more than its Expenditure in 2015? दिया गया दंड आरेख॑ (बार ग्राफ) 5 वर्षों, 2014 से 2018 के दौरान किसी कंपनी की आय और व्यय (करोड़ रुपए में) को दर्शाता है| 5 वर्षों में कंपनी की (प्रतिवर्ष) औसत आय 2015 में उसके व्यय से कितने प्रतिशत अधिक है?
05:12View SolutionThe given Bar Graph presents Income and Expenditure (in crores of Rupees) of a company for five years, 2014 to 2018. The total Income of the company in 2015, 2017 and 2018 is approximately what percent less than the total Expenditure in the five years? दिया गया दंड आरेख (बार ग्राफ) 5 वर्षो, 2014 से 2018 के दौरान किसी कंपनी की आय और व्यय (करोड़ रुपए में) को दर्शाता है 2015, 201 और 2018 में कंपनी की कुल आय, 5 वर्षो में कुल व्यय से लगभग कितने प्रतिशत कम है?
03:08View SolutionThe given Bar Graph presents Income and Expenditure (in crores of Rupees) of a company for five years, 2014 to 2018. In which year is the Expenditure more than 40% as compared to the Expenditure in the previous year? दिया गया दंड आरेख (बार ग्राफ) 5 वर्षो, 2014 से 2018 के दौरान किसी कंपनी की आय और व्यय (करोड़ रुपए में) को दर्शाता है| पिछले वर्ष के व्यय की तुलना में किस वर्ष में वह 40% अधिक है?
04:39View SolutionThe given Bar Graph presents Income and Expenditure (in crores of Rupees) of a company for five years, 2014 to 2018. What is the ratio of total Expenditure to total Income of the company in 2014,2016 and 2017? दिया गया दंड आरेख (बार ग्राफ) 5 वर्षों, 2014 से 2018 के दौरान किसी कंपनी की आय और व्यय (करोड़ रुपए में) को दर्शाता है| 2014, 2016 और 2017 में कंपनी के कुल व्यय और कुल आय का अनुपात क्या है?
01:43View SolutionGiven here is a multiple bar diagram of the scores of four players in two innings. Study the diagram and answer the questions % The average score in second innings contributed by the four players is: यहाँ चार खिलाड़ियों की दो पारियों के स्कोर का बहु बार-ग्राफ दिया गया है। आरेख का अध्ययन करें और प्रश्नों का उत्तर दें: दूसरी पारी में चारों खिलाड़ियों का औसत स्कोर है
View SolutionGiven here is a multiple bar diagram of the scores of four players in two innings. Study the diagram and answer the questions % The average runs of two innings of the player who scored highest in average are: यहाँ चार खिलाड़ियों की दो पारियों के स्कोर का बहु बार-ग्राफ दिया गया है। आरेख का अध्ययन करें और प्रश्नों का उत्तर दें: दोनों पारियों में उच्चतम स्कोर प्राप्त करने वाले खिलाड़ी का औसत रन है br>
02:13View Solution

