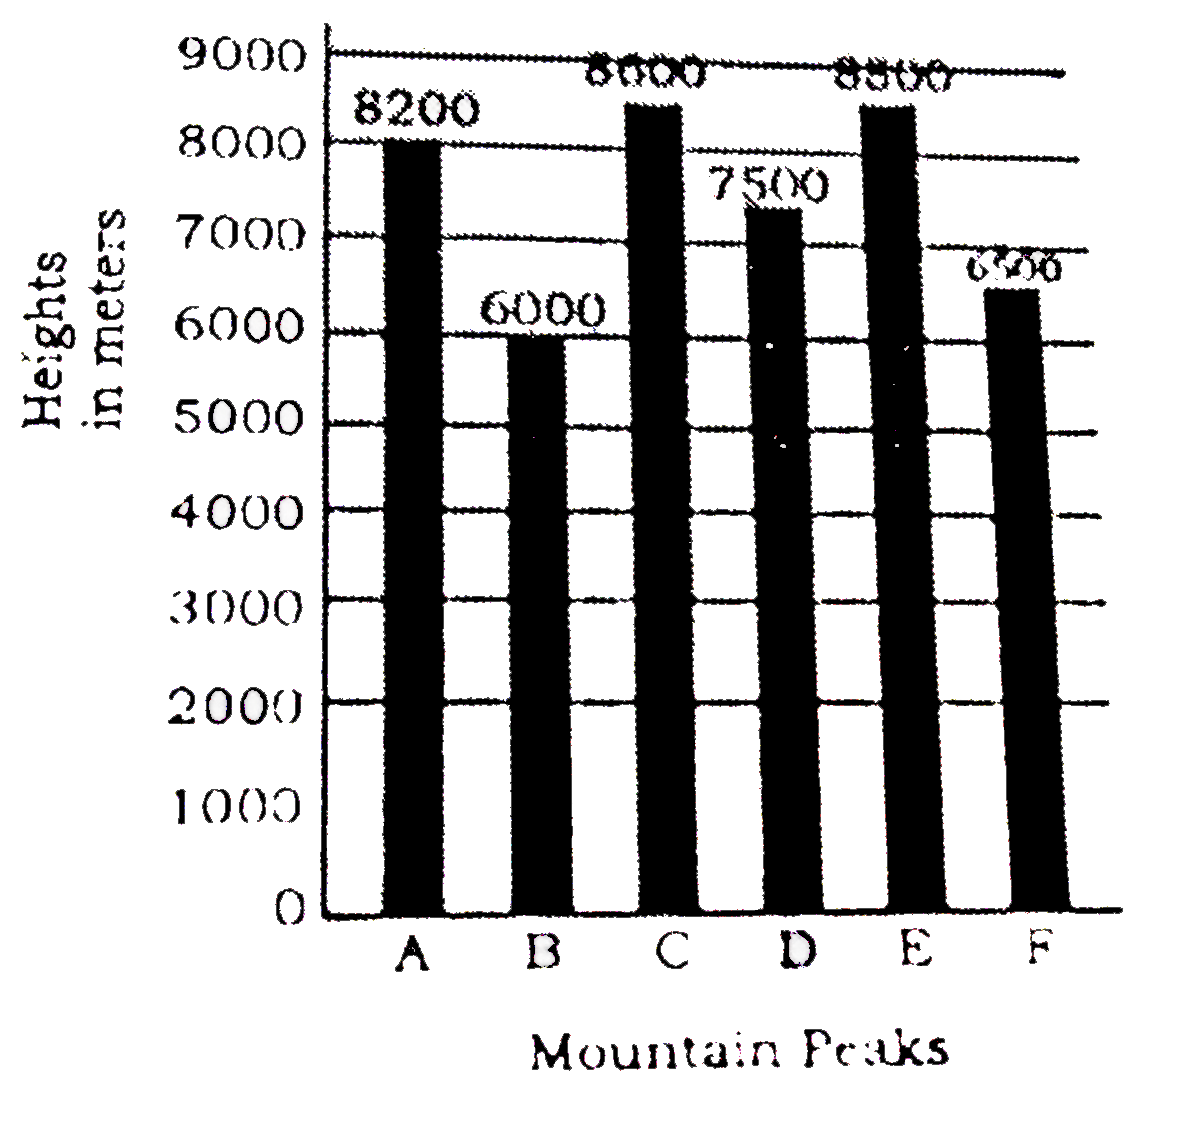
बार ग्राफ का अध्ययन कीजिए और निम्नलिखित प्रश्नों के उत्तर दीजिए। ग्राफ में 6 पर्वत शिखरों की उँचाई दर्शायी गयी है।

दूसरा सबसे उंचा शिखरों कौन-सा हैं ?
B
C
A
E
Iind highest peak=C(8600m)
Similar Questions
The area of the shaded part in the figure given below is ______.
 02:03View Solution
The inequation represented by the graph given below is :
02:10View SolutionThe inequation that best describes the graph given below is _________
02:17View SolutionThe inequation that best describes the following graph is _________
02:10View SolutionWhich inequations represent the shaded region in the given figure
04:23View SolutionIn Fig, find the value of x.
ltimg src="https://d10lpgp6xz60nq.cloudfront.net/physics_images/PS_MATH_IX_C12_S01_032_Q01.png" width="80%"gt01:13View SolutionMatch the followings (column I with column II)
ltimg src="https://d10lpgp6xz60nq.cloudfront.net/physics_images/NCERT_BIO_XI_C03_E01_011_Q01.png" width="80%"gt03:12View SolutionMatch column I with column II:
ltimg src="https://d10lpgp6xz60nq.cloudfront.net/physics_images/NCERT_BIO_XI_C18_E01_003_Q01.png" width="80%"gt05:46View Solution

