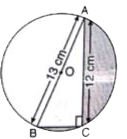
संलगन आकृति में O केंद्र वाले का व्यास AB=13 cm है तथा AC = 12 cm है| BC को मिलाया गया है| छायांकित क्षेत्र का क्षेत्रफल ज्ञात कीजिए| (π=3.14) लीजिए|

Step by step video & image solution for संलगन आकृति में O केंद्र वाले का व्यास AB=13 cm है तथा AC = 12 cm है| BC को मिलाया गया है| छायांकित क्षेत्र का क्षेत्रफल ज्ञात कीजिए| (pi = 3.14) लीजिए| by Maths experts to help you in doubts & scoring excellent marks in Class 10 exams.
Updated on:21/07/2023Topper's Solved these Questions
- वृत्त से सम्बंधित क्षेत्रफल BOOK - SHIVLAAL PUBLICATIONCHAPTER - वृत्त से सम्बंधित क्षेत्रफल EXERCISE - अति लघु उत्तरीय प्रशन
8 Videos
- वृत्त BOOK - SHIVLAAL PUBLICATIONCHAPTER - वृत्त EXERCISE - दीर्घ उत्तरीय प्रश्न
1 Videos
- समान्तर श्रेणियाँ BOOK - SHIVLAAL PUBLICATIONCHAPTER - समान्तर श्रेणियाँ EXERCISE - दीर्घ उत्तरीय प्रशन
2 Videos
Similar Questions
दो वृतों की त्रिज्याएँ क्रमश: 19 cm और 9 cm है| उस वृत्त की त्रिज्या ज्ञात कीजिये जिसकी परिधि इन दोनों वृतों की परिधियों के योग के बराबर हो|
View Solution4 cm त्रिज्या वाले एक वृत्त के परिगत एक त्रिभुज ABC इस प्रकार खीचा गया है। बिन्दु रेखाखण्ड BD और DC जिनमें स्पर्श बिन्दु D द्वारा BC विभाजित है। की लम्बाइयाँ क्रमश: 8 cm और 6 cm है। भुजाऍ AB और AC ज्ञात कीजिए।
View Solutionकिसी AP के चौथे और 8वें पदों का योग 24 है तथा छठे और 10वें पदों का योग 44 है| इस AP के प्रथम तीन पद ज्ञात कीजिए|
View SolutionHow many lines of symmetry does the above figure have ?
View SolutionWhich of the following are correct chain isomers of butane ? (i)
View SolutionDetermine the point of symmetry of a regular hexagon.
View SolutionDtermine the images of the following figure about the given line :
View SolutionIn the figure above (not to scale), ¯¯¯¯¯¯AB⊥¯¯¯¯¯¯CDandAD is the bisector of ∠BAE.AB=3cm and AC=5cm. Find CD.
View SolutionMatch the following Column A to Column B

View SolutionMatch the following Column A to Column B

View SolutionMatch the following Column A to Column B

View SolutionThe inequation represented by the graph given below is :
View SolutionThe inequation that best describes the graph given below is _________
View SolutionThe inequation that best describes the following graph is _________
View SolutionWhich inequations represent the shaded region in the given figure
View SolutionIn the figure (not to scale) AB = AC and BD = CD. Find ∠ADB
ltimg src="https://d10lpgp6xz60nq.cloudfront.net/physics_images/PS_MATH_IX_C15_E05_003_Q01.png" width="80%"gt
View Solution
