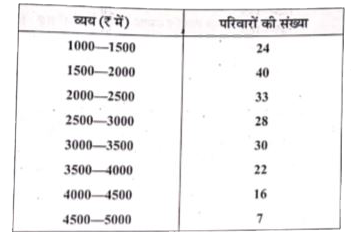
निम्नलिखित आकड़े 225 बिजली उपकरणों के प्रेक्षित जीवनकाल (घण्टों में) की सूचना देते है:

उपकरणों का बहुलक जीवनकाल ज्ञात कीजिए ।
The correct Answer is:65.63
Step by step video & image solution for निम्नलिखित आकड़े 225 बिजली उपकरणों के प्रेक्षित जीवनकाल (घण्टों में) की सूचना देते है: उपकरणों का बहुलक जीवनकाल ज्ञात कीजिए । by Maths experts to help you in doubts & scoring excellent marks in Class 10 exams.
Updated on:21/07/2023Topper's Solved these Questions
- सांख्यिकी BOOK - SHIVLAAL PUBLICATIONCHAPTER - सांख्यिकी EXERCISE - दीर्घ उतरीय प्रश्न
3 Videos
- सांख्यिकी BOOK - SHIVLAAL PUBLICATIONCHAPTER - सांख्यिकी EXERCISE - अति लघु उतरीय प्रश्न
1 Videos
- समान्तर श्रेणियाँ BOOK - SHIVLAAL PUBLICATIONCHAPTER - समान्तर श्रेणियाँ EXERCISE - दीर्घ उत्तरीय प्रशन
2 Videos
Similar Questions
निम्नलिखित आकड़े किसी गाँव के 200 परिवारों के कुल मासिक घरेलु व्यय के बटन को दर्शाते है। इन परिवारों का बहुलक मासिक व्यय ज्ञात कीजिए ।

View Solutionकिसी गेंदबाज द्वारा 10 क्रिकेट मैचों में लिए गए विकिटो की संख्याएँ निम्नलिखित है-
2,6,4,5,0,2,1,3,2,3
इन आकड़ो का बहुलक ज्ञात कीजिए ।
View Solutionकिसी AP के चौथे और 8वें पदों का योग 24 है तथा छठे और 10वें पदों का योग 44 है| इस AP के प्रथम तीन पद ज्ञात कीजिए|
View SolutionHow many lines of symmetry does the above figure have ?
View SolutionWhich of the following are correct chain isomers of butane ? (i)
View SolutionDetermine the point of symmetry of a regular hexagon.
View SolutionDtermine the images of the following figure about the given line :
View SolutionMatch the following Column A to Column B

View SolutionMatch the following Column A to Column B

View SolutionMatch the following Column A to Column B

View SolutionFind the area of the figure given below.

View SolutionThe area of the shaded part in the figure given below is ______.

View SolutionThe inequation represented by the graph given below is :
View SolutionThe inequation that best describes the graph given below is _________
View SolutionThe inequation that best describes the following graph is _________
View SolutionWhich inequations represent the shaded region in the given figure
View Solution
