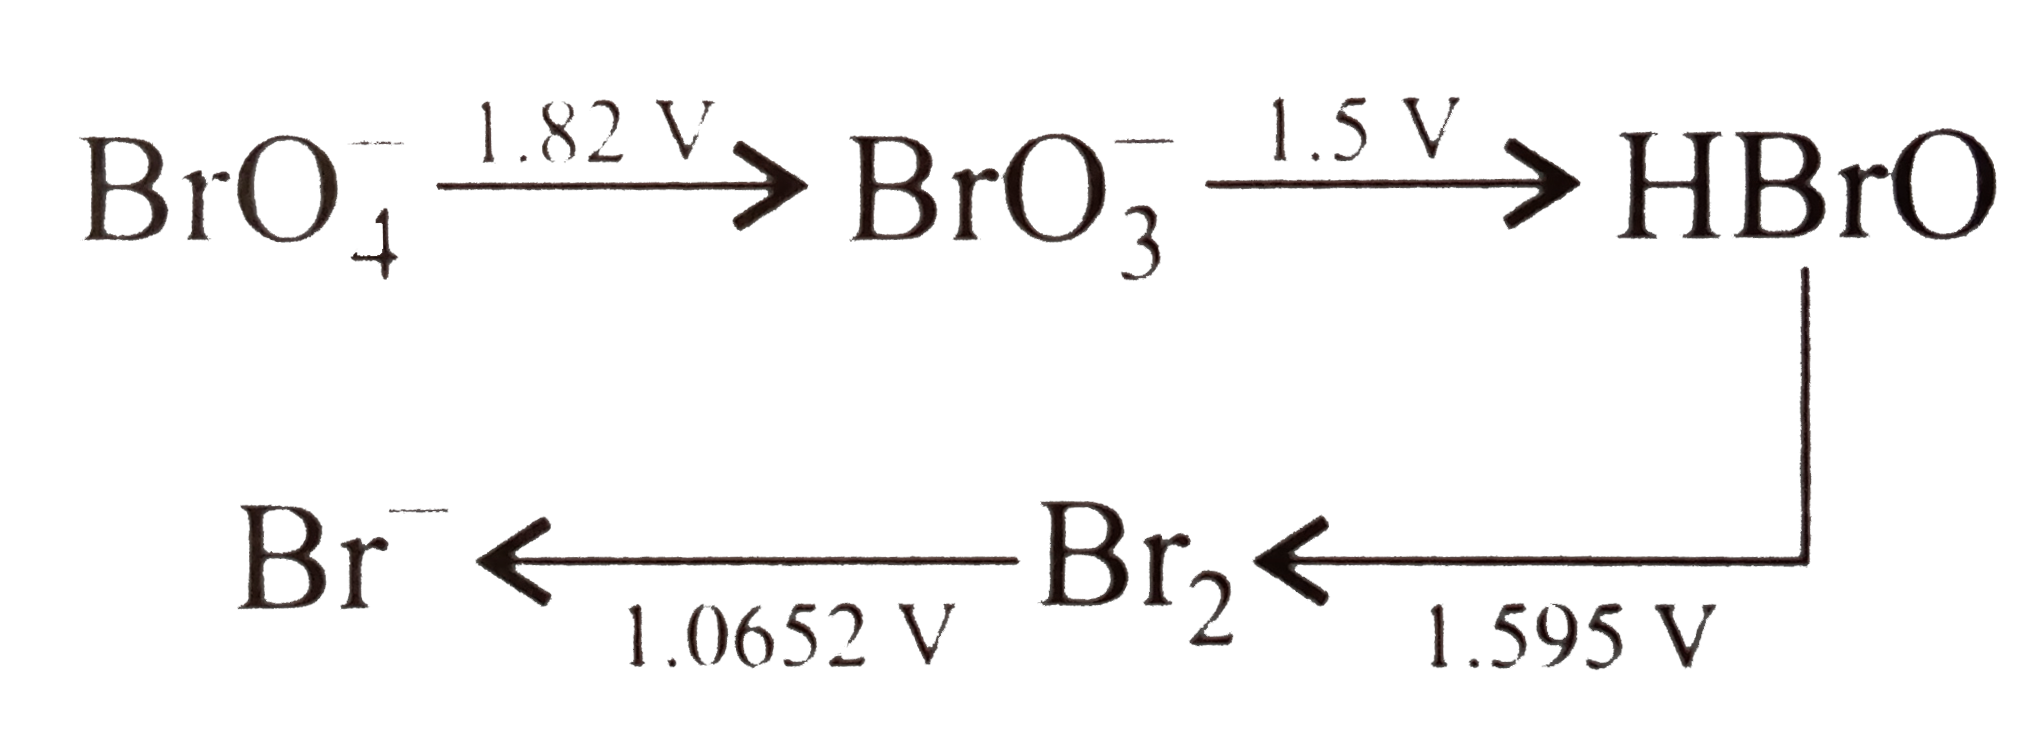
Consider the change in oxidation state of bromide corresponding to different emf values as shown in the diagram below-
BrO−41.82V−−→BrO−31.5V−−→HBrO1.595V−−−→Br21.0652V−−−−→Br−
Then the species undergoing disproportionation is -
Br2
BrO−4
BrO−3
HBrO
The correct Answer is:D
Topper's Solved these Questions
- PREVIOUS YEARS QUESTION PAPER 2018BOOK - CHHAYA PUBLICATIONCHAPTER - PREVIOUS YEARS QUESTION PAPER 2018EXERCISE - JEE MAIN 2018
10 Videos
- PREVIOUS YEARS QUESTION PAPER 2017BOOK - CHHAYA PUBLICATIONCHAPTER - PREVIOUS YEARS QUESTION PAPER 2017EXERCISE - NEET 2017
23 Videos
- PREVIOUS YEARS QUESTION PAPER 2019BOOK - CHHAYA PUBLICATIONCHAPTER - PREVIOUS YEARS QUESTION PAPER 2019EXERCISE - WBCHSE 2019 PART-B
19 Videos
Similar Questions
Consider the change in oxidation state of Bromine corredponding to different emf values as shown in the diagram below :
 .
.
The species undergoing disproportionation is .
View SolutionConsider the change in oxidation state of Bromine corredponding to different emf values as shown in the diagram below :
 .
.
The the species undergoing dispropprtionation is .
View Solution
Knowledge Check
Using the following Latimer diagram for bromine,
pH=0,BrO−41.82V−−→BrO−31.50V−−→HBrO1.595V−−−→Br21.06552V−−−−→Br−
the species undergoing disproportionation isABrO−4BBrO−3CHBrODBr2Using the following Latimer diagram for bromine,
pH=0,BrO−41.82V−−→BrO−31.50V−−→HBrO1.595V−−−→Br21.06552V−−−−→Br−
the species undergoing disproportionation isABrO−4BBrO−3CHBrODBr2Consider the change in oxidation state of Bromine corresponding to different emf values as shown in the diagram. Below

Then, the species undergoing disproportionation isABrO−3BBrO−4CHBrODBr2
Consider the change in oxidation state of Bromine corredponding to different emf values as shown in the diagram below :
 .
.
The the species undergoing dispropprtionation is .
View SolutionIf an element can exist in several oxidation states, it is convernient to display the reduction potentials correspondingg to the various half reactions in diagrammatic form, know as latimer diagram the latimer diagram for chlorine in acid solutio is
CIO−4+1.20V−−−−→CiO−3+1.18V−−−−→HClO2+1.60V−−−−→HClO1.67V−−→Cl21.36V−−→Cl− in basic solution.
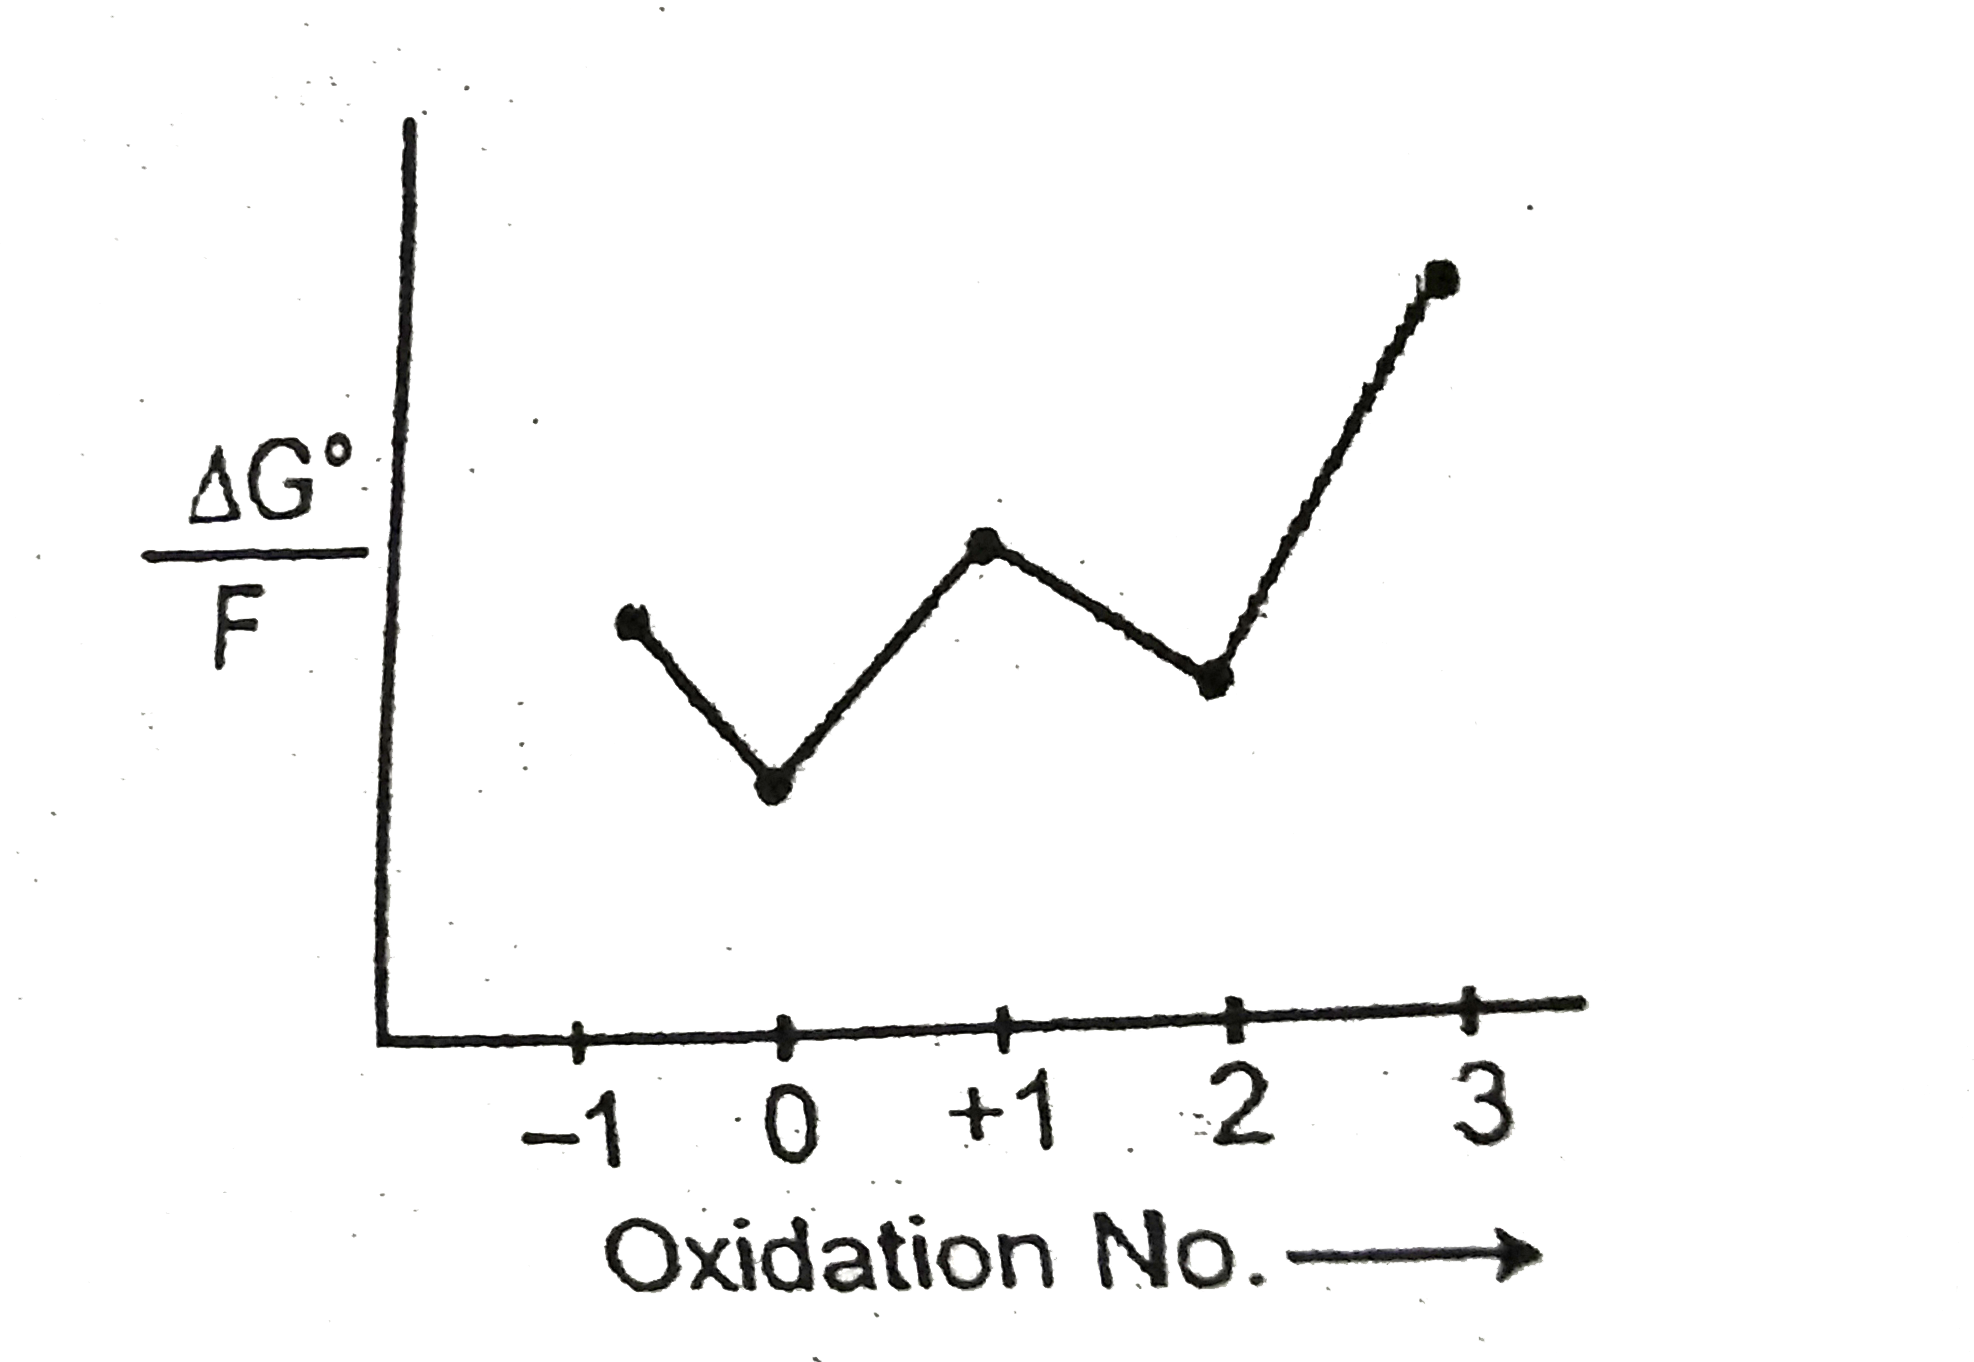
ClO−40.37V−−→ClO−30.30V−−→ClO−20.68V−−→ClO−0.42V−−→Cl21.36V−−→Cl− The standard potentials for two nonadjacent species can also be calculateed by using the concept that △G∘ as an additive property but potential is not an additive property and △G∘=−nFx0. if a given oxidation stateis a stronger oxidising agent than the next higher oxidation state, disproportionation can occur. The reverse of disproportionation is called comproportionation. The relative stabilities of the oxidation state can also be understood by drawing a graph of △G∘/F against oxidation state, known as frost diagram, choosing the stability of zero oxidation state arbitrarily as zero. The most stable oxidation state of a species lies lowest in the diagram, disproportionation is spontaneous if the species lies above a straight line joining its two product species.
Q.
For a hypothetical element, the frost diagram is shown in figure.? which of the following oxidation state is least stable?
View SolutionConsider the change in oxidation state of Bromine corredponding to different emf values as shown in the diagram below :
 .
.
The the species undergoing dispropprtionation is .
View SolutionConsider the change in oxidation state of Bromine corresponding to different emf values as shown in the diagram below :
 .
.
The the species undergoing dispropprtionation is .
View SolutionIf an element can exist in several oxidation states, it is convernient to display the reduction potentials correspondingg to the various half reactions in diagrammatic form, know as latimer diagram the latimer diagram for chlorine in acid solutio is
CIO−4+1.20V−−−−→CiO−3+1.18V−−−−→HClO2+1.60V−−−−→HClO1.67V−−→Cl21.36V−−→Cl− in basic solution.
ClO−40.37V−−→ClO−30.30V−−→ClO−20.68V−−→ClO−0.42V−−→Cl21.36V−−→Cl− The standard potentials for two nonadjacent species can also be calculateed by using the concept that △G∘ as an additive property but potential is not an additive property and △G∘=−nFx0. if a given oxidation stateis a stronger oxidising agent than the next higher oxidation state, disproportionation can occur. The reverse of disproportionation is called comproportionation. The relative stabilities of the oxidation state can also be understood by drawing a graph of △G∘/F against oxidation state, known as frost diagram, choosing the stability of zero oxidation state arbitrarily as zero. The most stable oxidation state of a species lies lowest in the diagram, disproportionation is spontaneous if the species lies above a straight line joining its two product species.
Q.
For a hypothetical element, the frost diagram is shown in figure.? which of the following oxidation state is least stable?
View Solution
