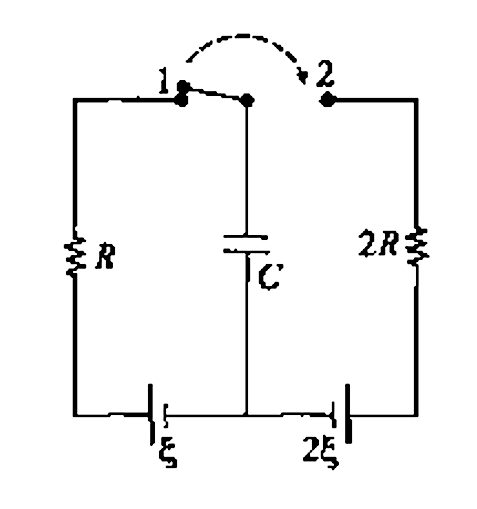
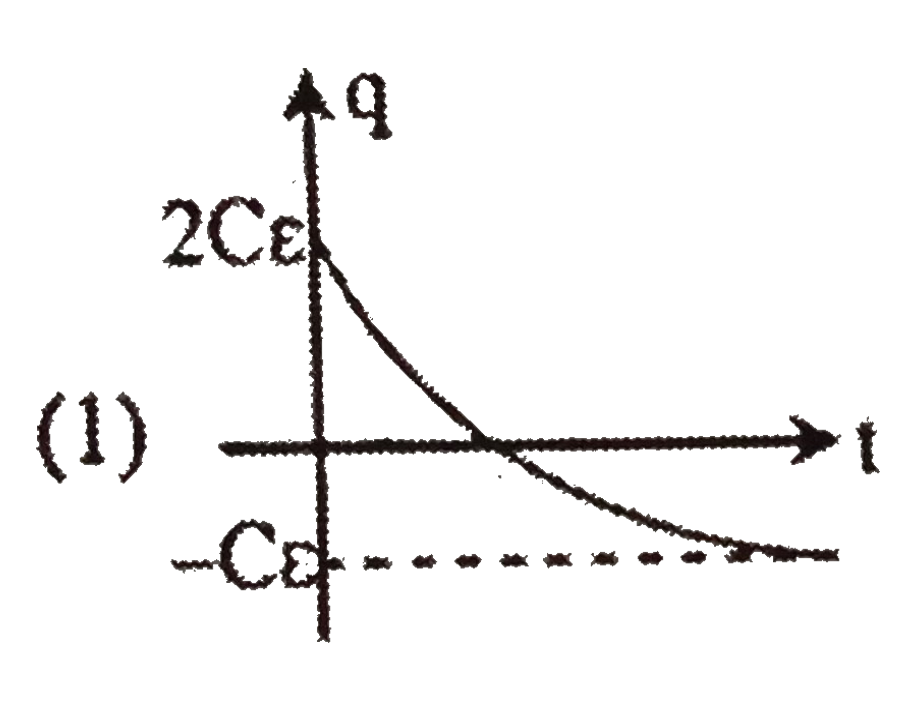
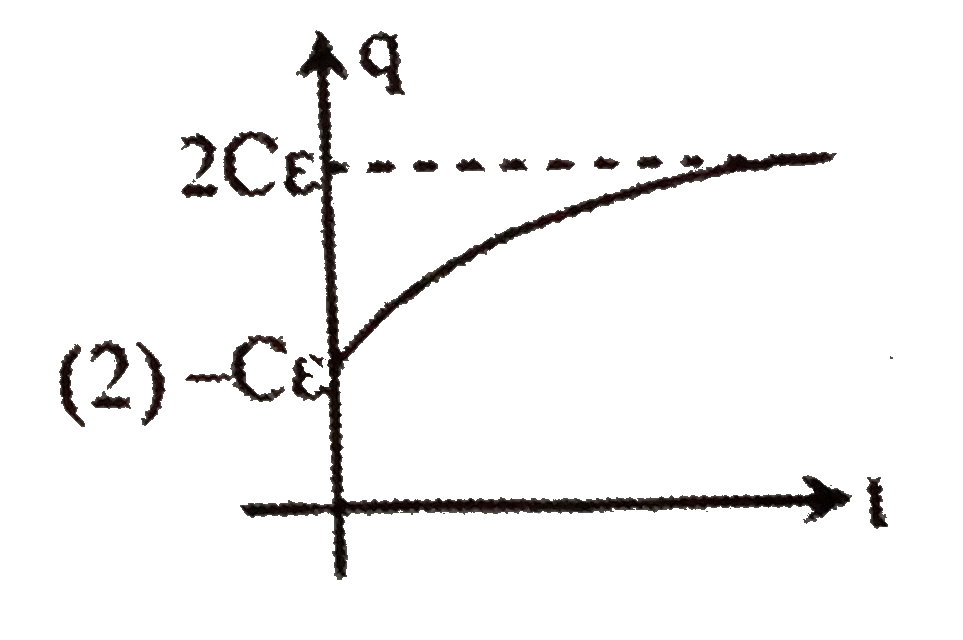
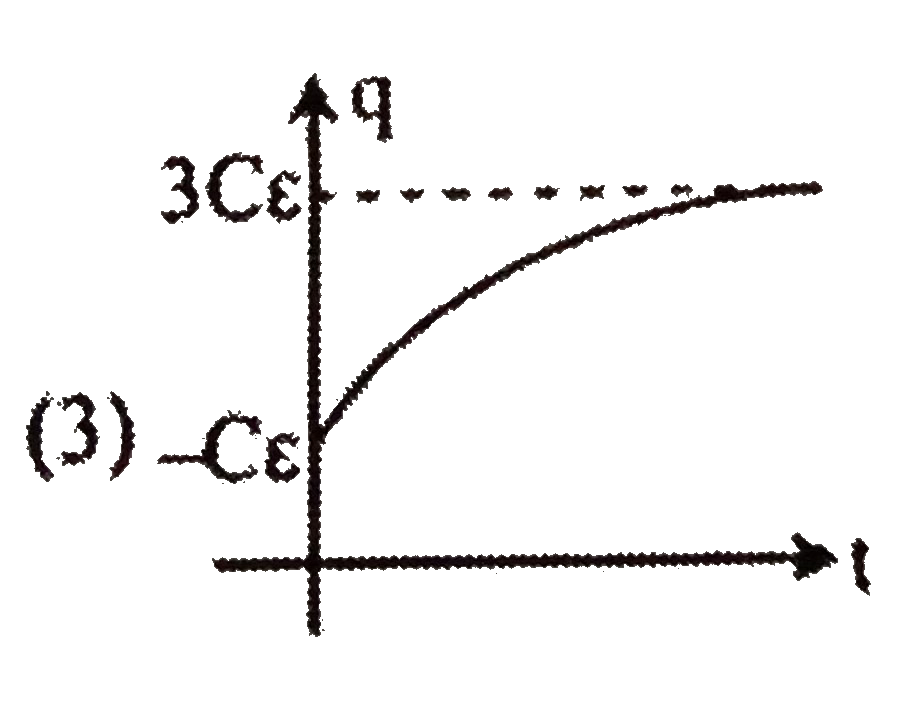
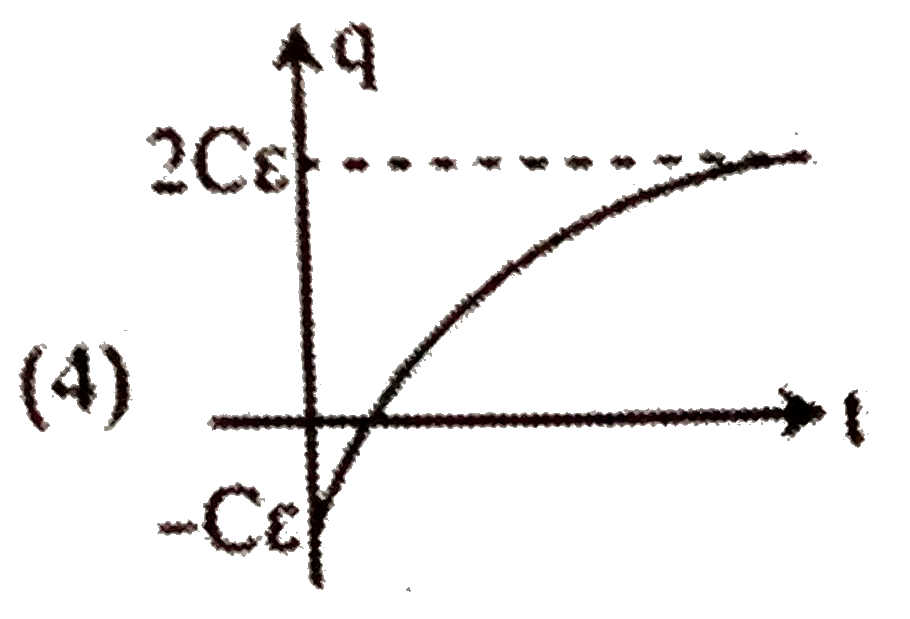
In the circuit shown in figure-3.311, the switch is shifted from position I to 2 at time t = 0. The switch was initially in position I for a long time. The graph between charge on capacitor C and time tis best represented as
The correct Answer is:D
______−Cε
______+Cε
q=2Cε−[2Cε−(−Cε)]et2RC
=2Cε−3Cεet2RC
initial charge=−Cε
final charge =2Ceπs
Topper's Solved these Questions
Similar Questions
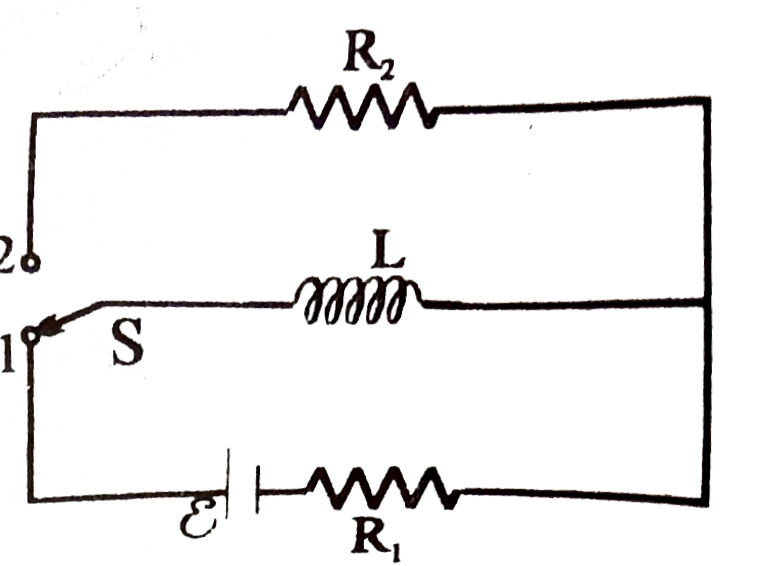
In the circuit shown, initially the switch is in position 1 for a long time. Then the switch is shifted to position 2 for a long time. Find the total heat produced in R2
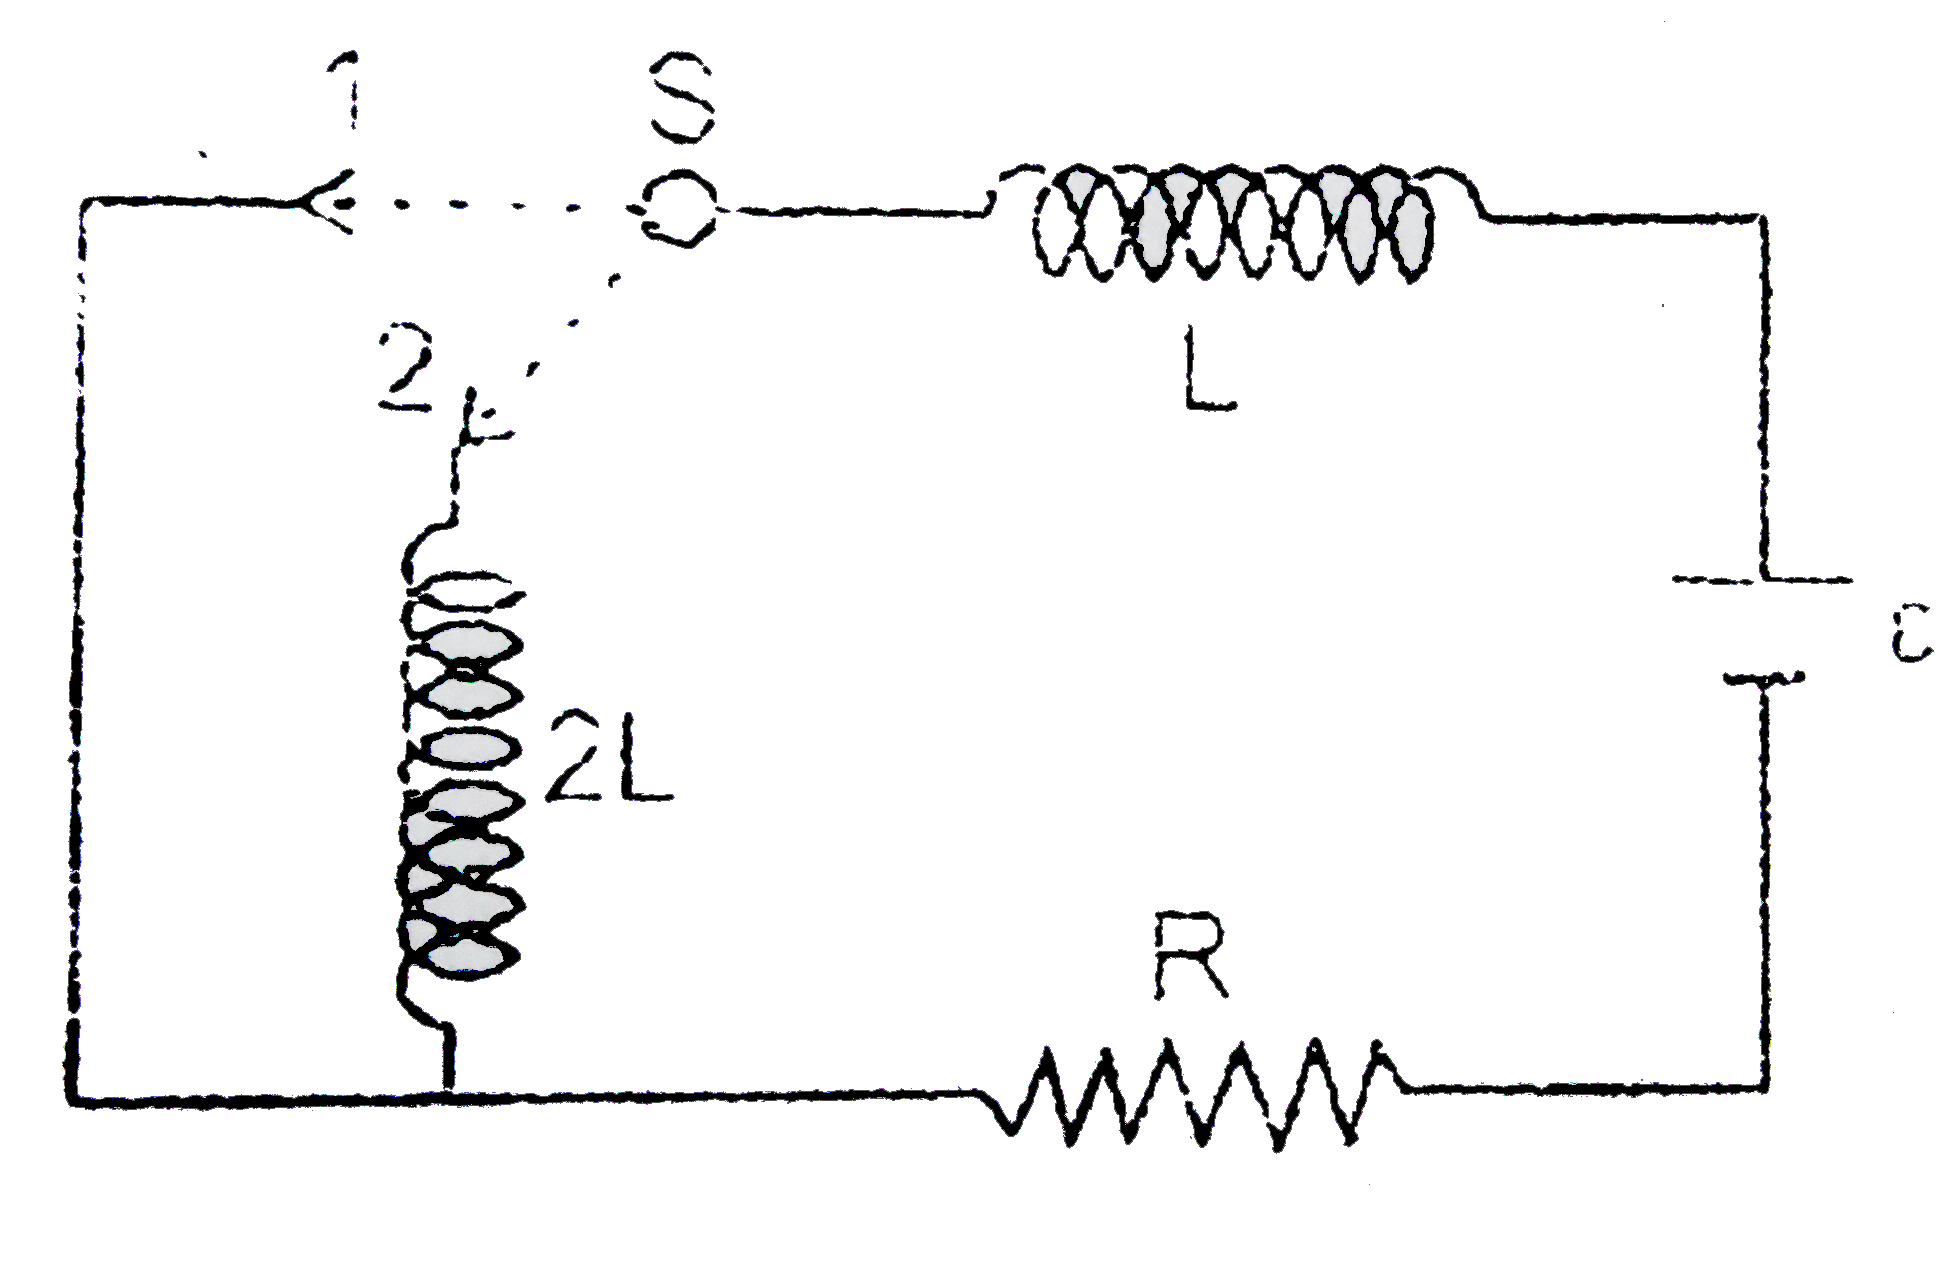
View SolutionIn the circuit shown, the switch S is shifted to position 2 from position 1 at t=0, having been in position 1 for a long time.Find the current in the circuit as a function of time.
View Solution
Knowledge Check
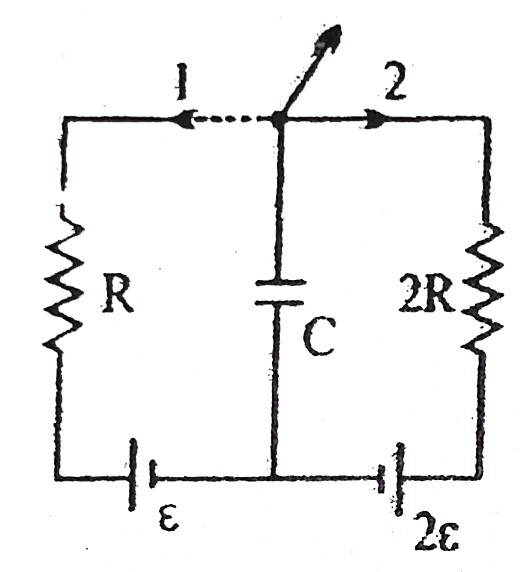
In the circuit shown, the switch is shifted from position 1rightarrow 2 at t=0. The switch was initially in position I since a long time. The graph between charge on capacitor C and time 't' is
 A
A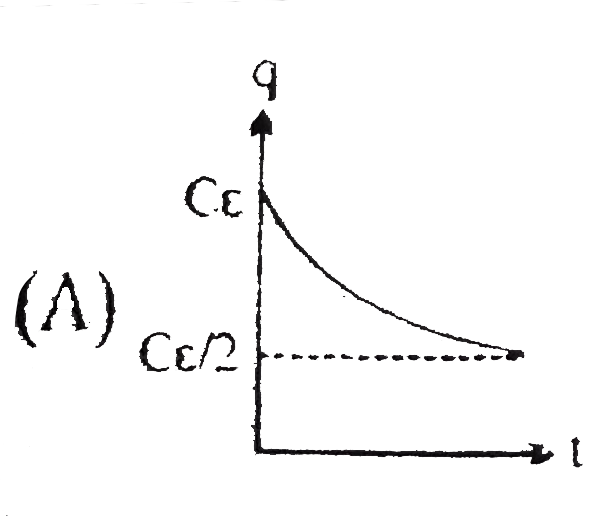 B
B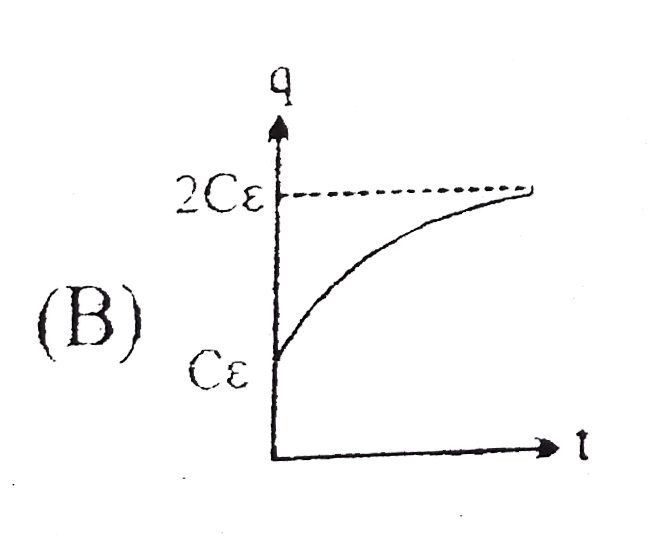 C
C D
D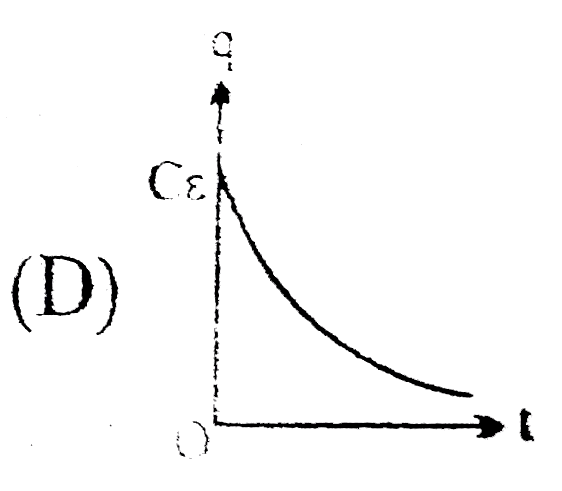
In the given circuit diagram figure, switch Sw is shifted from position 1 to position 2. Then
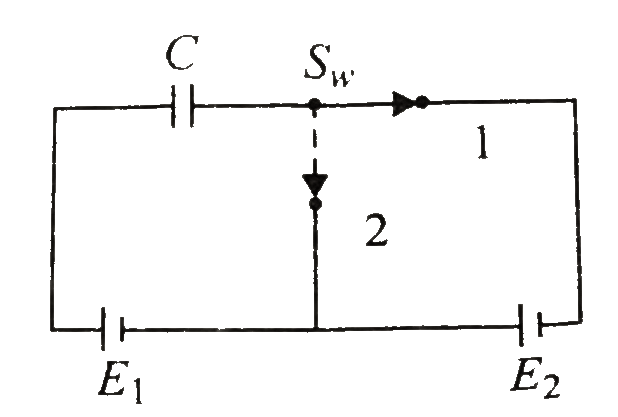 Aa charge of amount CE2 will be supplied to battery E1.Bheat generated in the circuit is CE22/2Ca charge of amount CE2 will be supplied by battery E1.Dheat generated in the circuit is CE1E2/2
In the circuit as shown in figure the switch is closed at t=0.
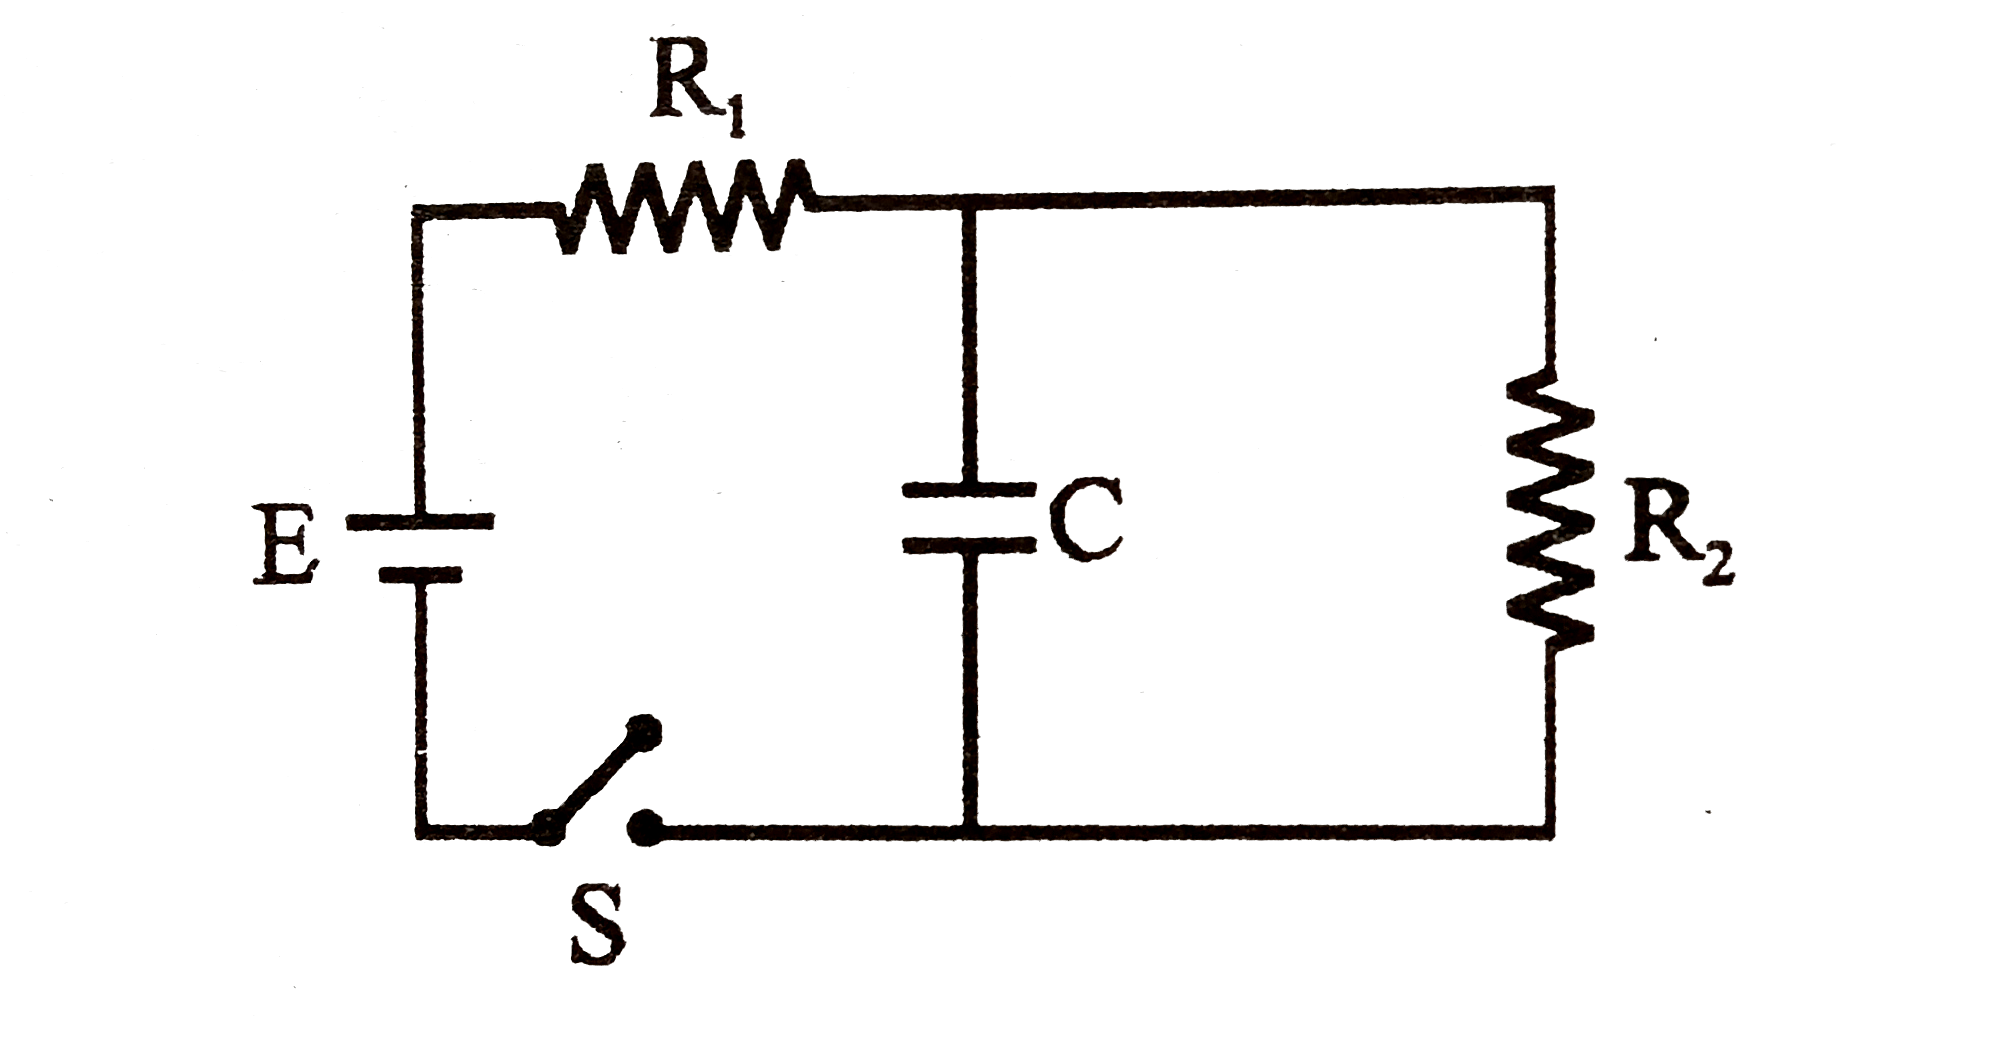
A long time after closing the switchAvoltage drop across the capacitor is EBcurent through the battery is E/R1+R2Cenegru stores in the capacitor is
12C(R2ER1+R2)2Dcurrent through the capacitor becomes zero
In the circnit shown, capacitor is initially uncharged till the switch is turned on at time t=0. Then
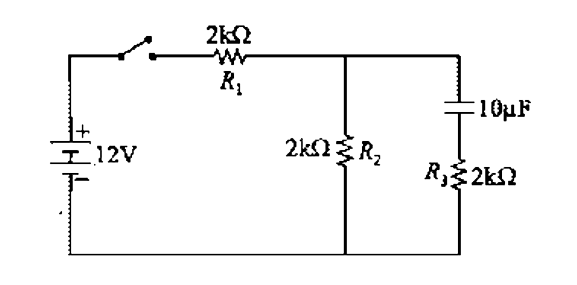
View SolutionIn the circuit shown. Initially the capacitor is uncharged. The switch S is closed at time t=0. Then
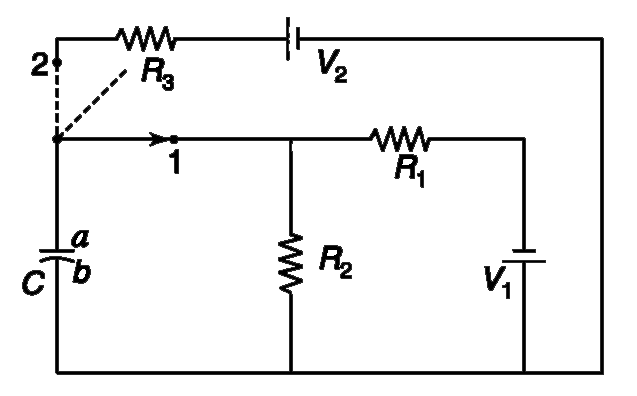
View SolutionIn the circuit shown in fig. the switch is kept closed in position 1 for a long time. At time t=0 the switch is moved to position 2. Write the dependence of voltage (VC) across the capacitor as a function of time (t). Take VC to be positive when plate a is positive.
Given: R1=20Ω,R2=60Ω,R3=400kΩ,V1=40V,V2=90VandC=0.5μF.
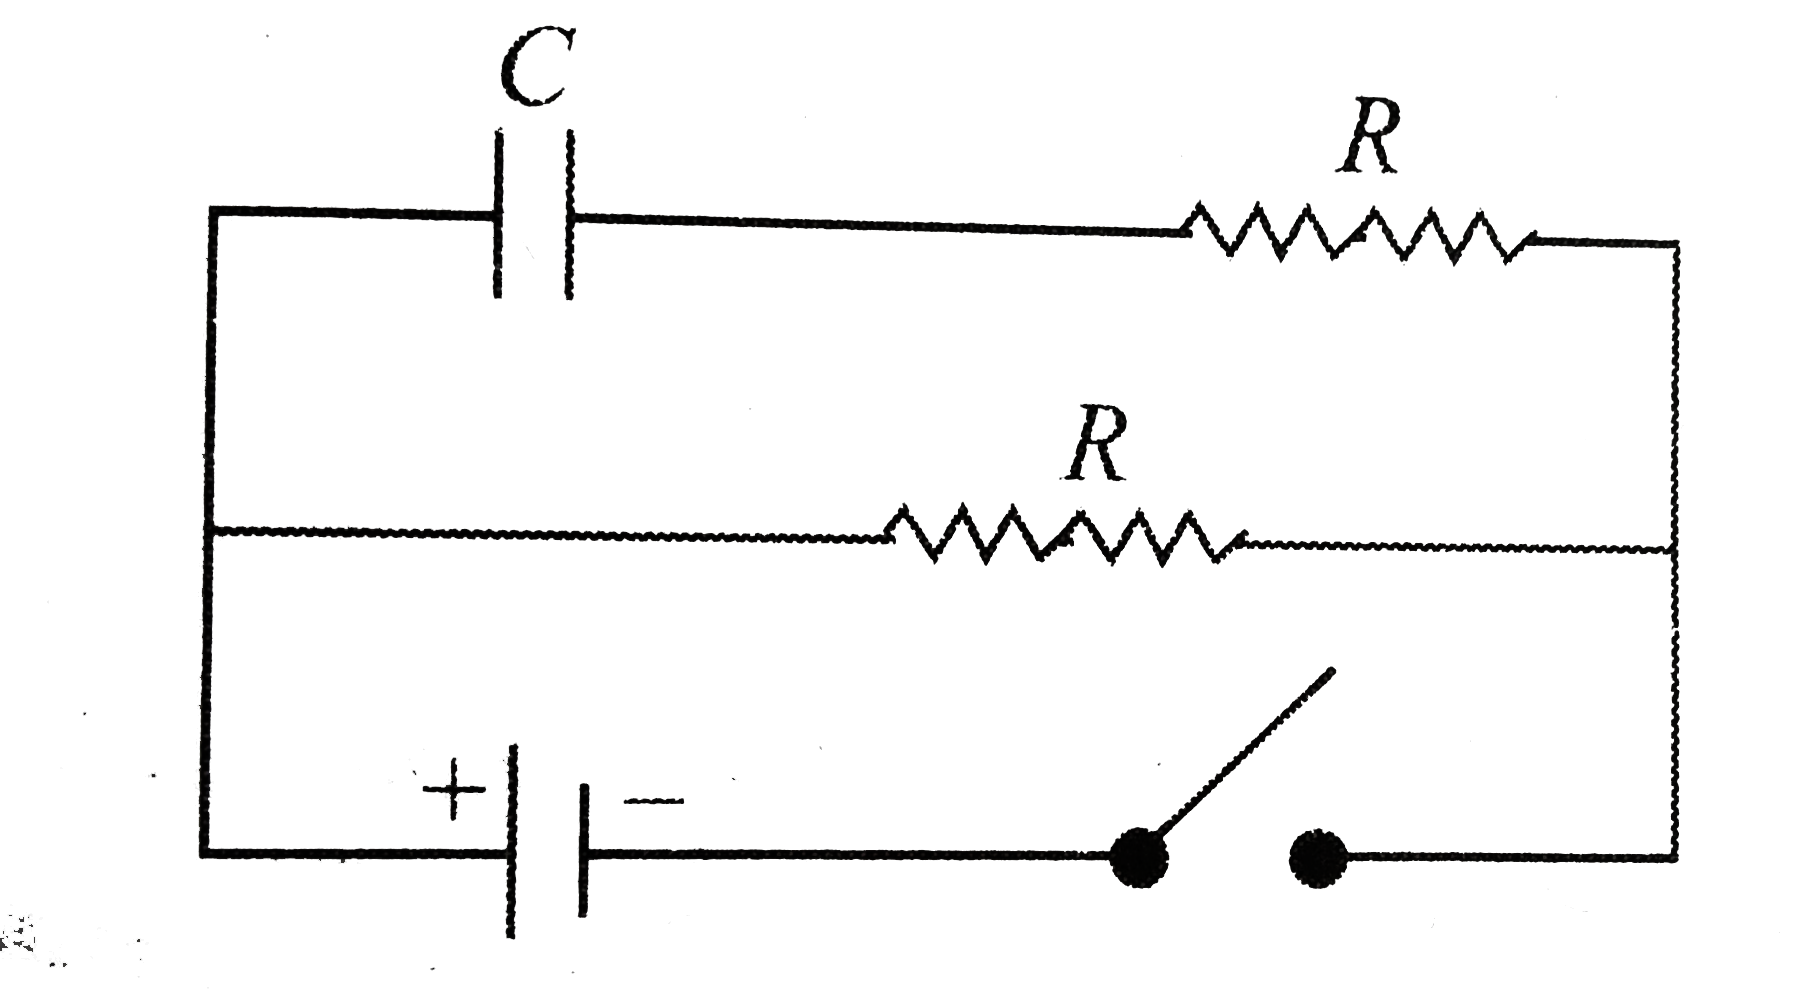
View SolutionIn the circuit shown in fig. when the switch is closed, the capacitor charges with a time constant
View SolutionIn the circuit shown in figure switch S is closed at time t=0
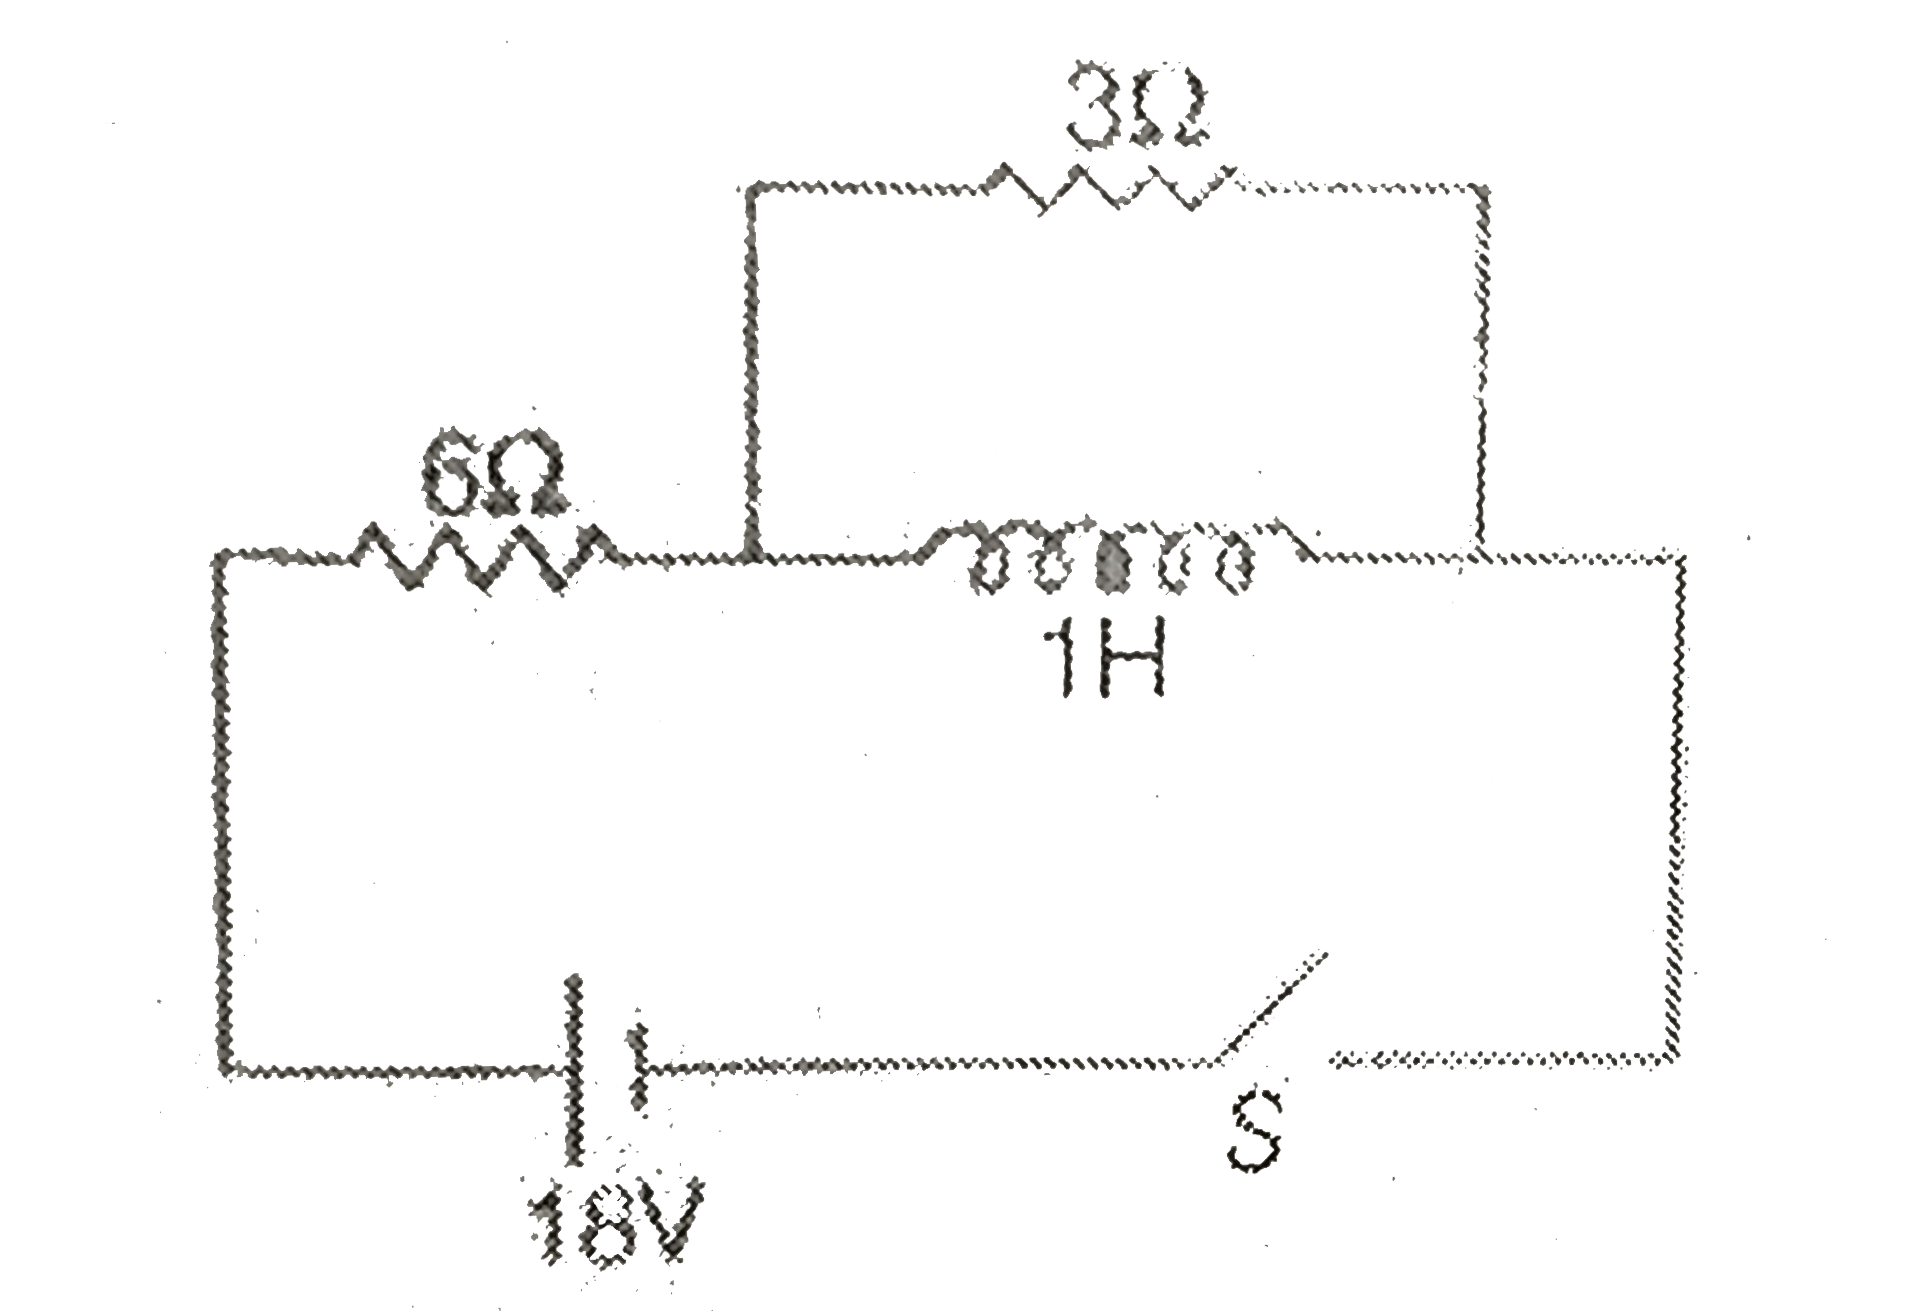
Current I from the battery at time t is given by
View Solution
