According to Moseley, a straight line graph is obtained on plotting:
Where, v is frequency and Z is atomic number.
v us Z
v2 us Z
√v us Z
1v us Z
The correct Answer is:C
Step by step video, text & image solution for According to Moseley, a straight line graph is obtained on plotting: Where, v is frequency and Z is atomic number. by Chemistry experts to help you in doubts & scoring excellent marks in Class 11 exams.
Topper's Solved these Questions
- BOOK - GRB PUBLICATIONCHAPTER - PERIODIC TABLEEXERCISE - B.Atomic and Ionic Radius71videos
PERIODIC TABLE
- BOOK - GRB PUBLICATIONCHAPTER - PERIODIC TABLEEXERCISE - C.Ionisation Energy93videos
PERIODIC TABLE
- BOOK - GRB PUBLICATIONCHAPTER - NOMENCLATURE AND CLASSIFICATIONEXERCISE - Subjective Type24videos
NOMENCLATURE AND CLASSIFICATION
- BOOK - GRB PUBLICATIONCHAPTER - PRACTICAL ORGANIC CHEMISTRYEXERCISE - Exercise 4 (Matrix match type )1videos
PRACTICAL ORGANIC CHEMISTRY
Similar Questions
Knowledge Check
- Question 1 - Select One
For a lst order reaction , a straight line is obtained if you plot
Alog conc. vs timeBconc. vs timeC1/conc. vs timeDlog conc. vs 1/time - Question 2 - Select One
If the straight line is at an angle 45∘ with b=1 calculate frequency when atomic number Z is 50.
A2000B2010C2401DNone - Question 3 - Select One
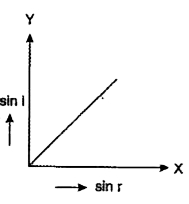
When a ray of light undergoes refraction, a straight line graph is obtained by plotting sine of angle of incidence versus sine of angle of refraction. The slope of this graph represents.
 Avelocity of lightBrefractive indexCwavelength of lightDnone of these
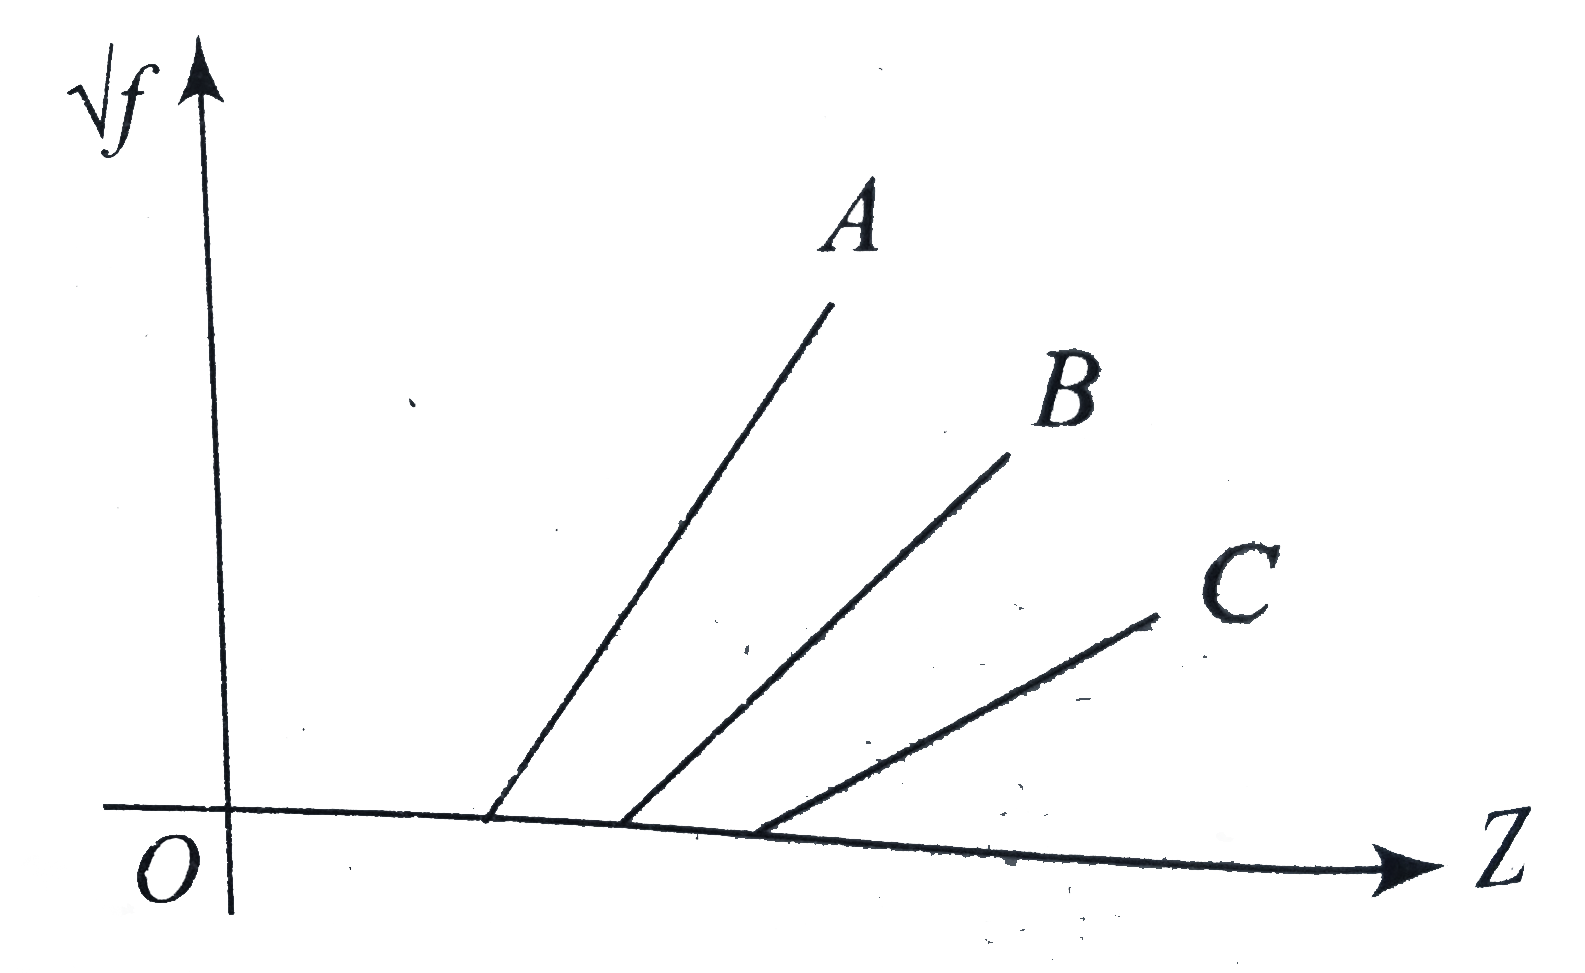
Figure shown Moseley's plot between √f and Z where fistheequencyandZisthea→micνmber.Threel∈esA,B,andC always in the graph may repersent
 View Solution
According to the Arrhenius equation a straight line is to be obtained by plotting the logarithm of the rate constant of a chemical reaction (logk) against
View SolutionSlope of the straight line obtained by plotting log10 k against 1/T represents what term ?
View Solution
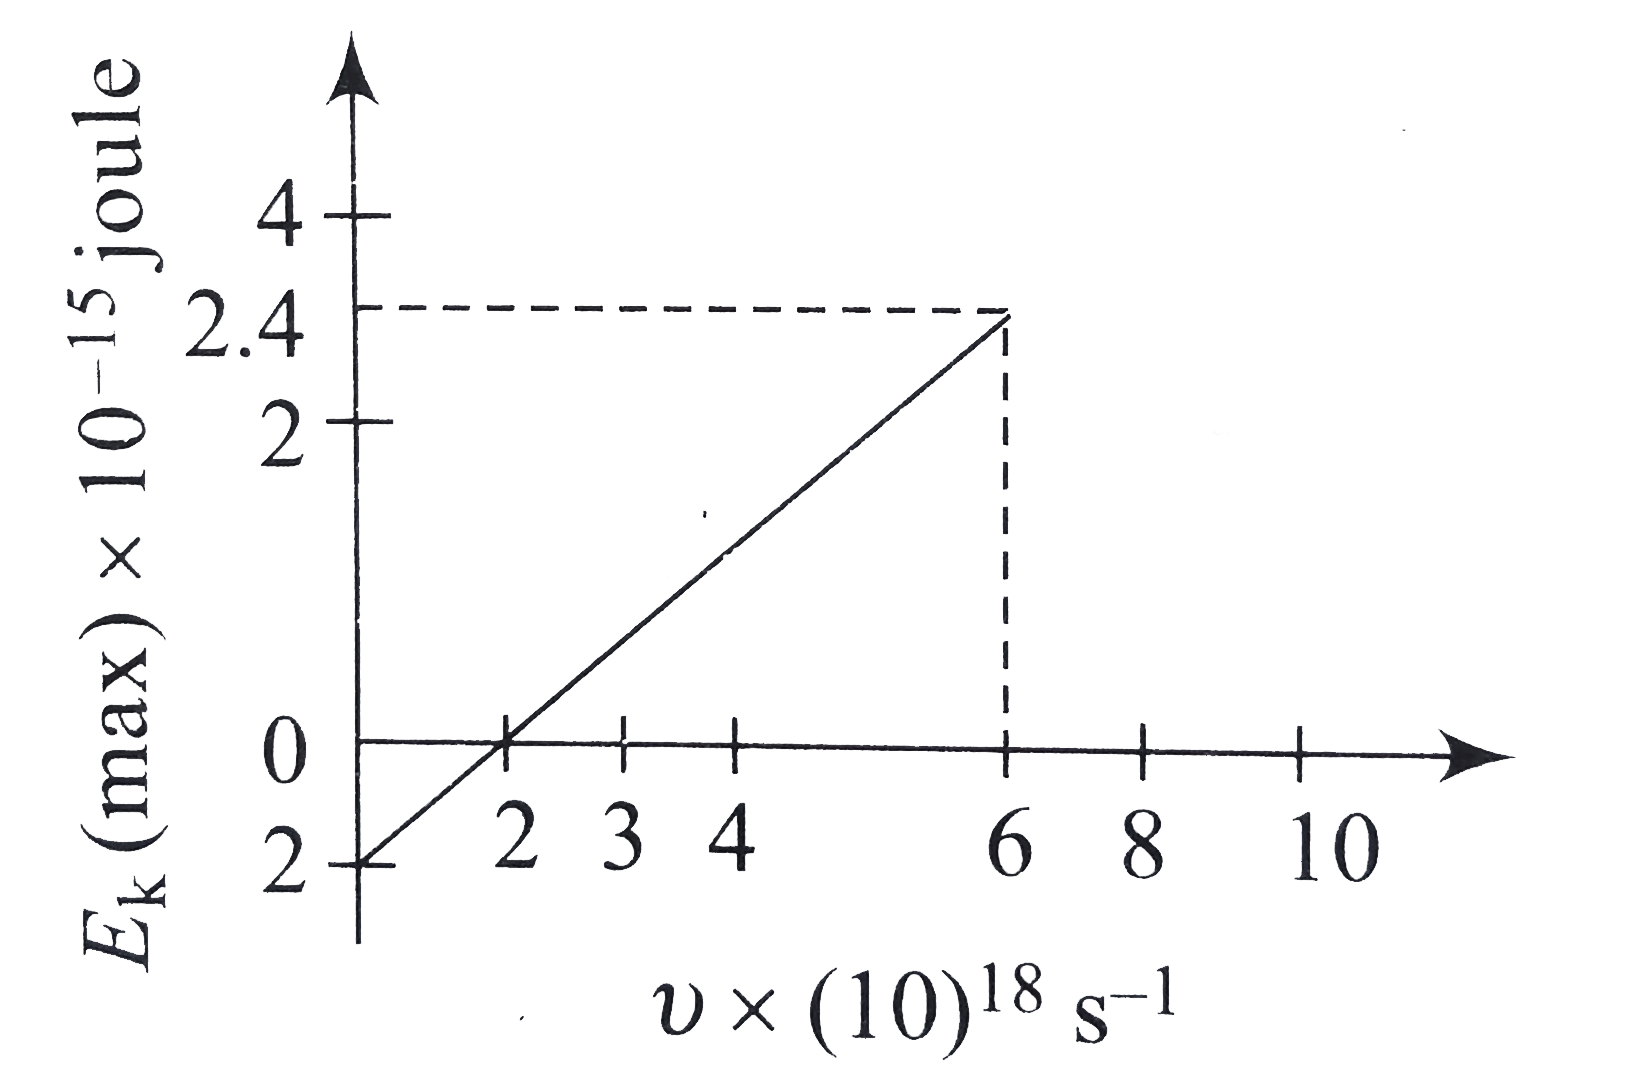
In the experiment on photoelectric effect, the graph between EK(max) and v is found to be a straight line as sshoen in fig. The threshold frequency and Planck's constant according to this graph areView SolutionSlope of the straight line obtained by plotting log10k against 1T represents what term?
View Solution

