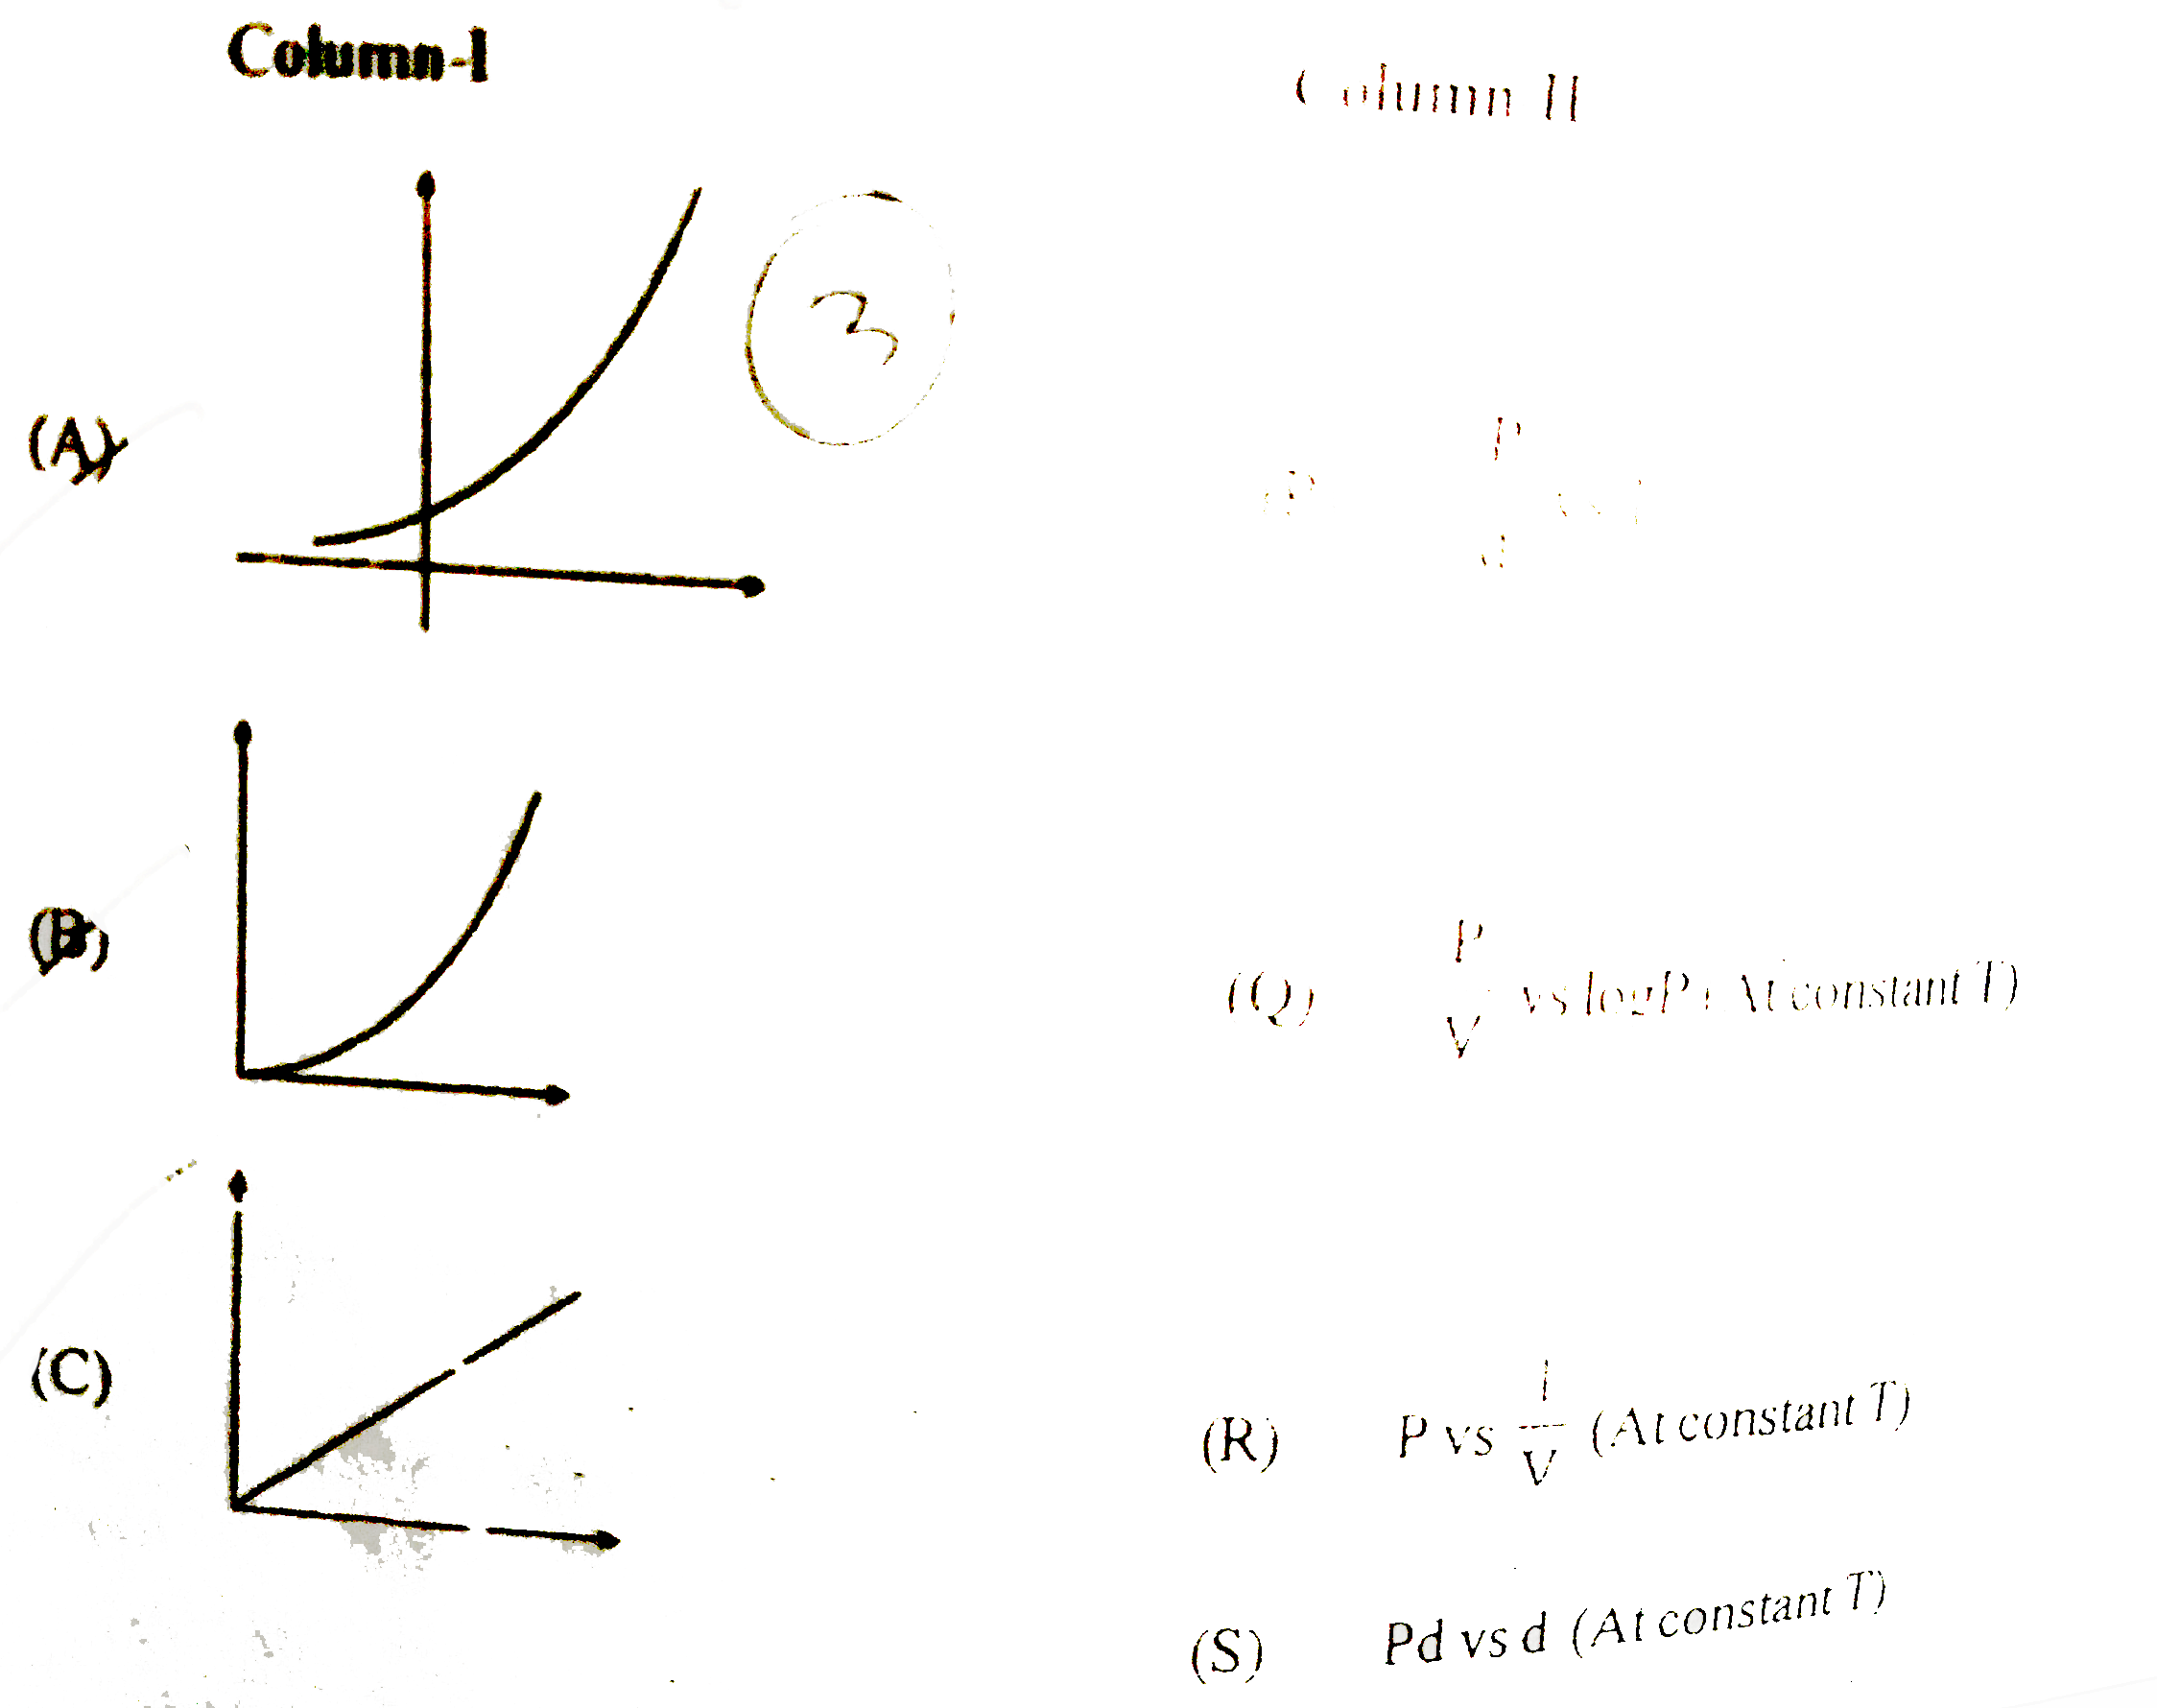
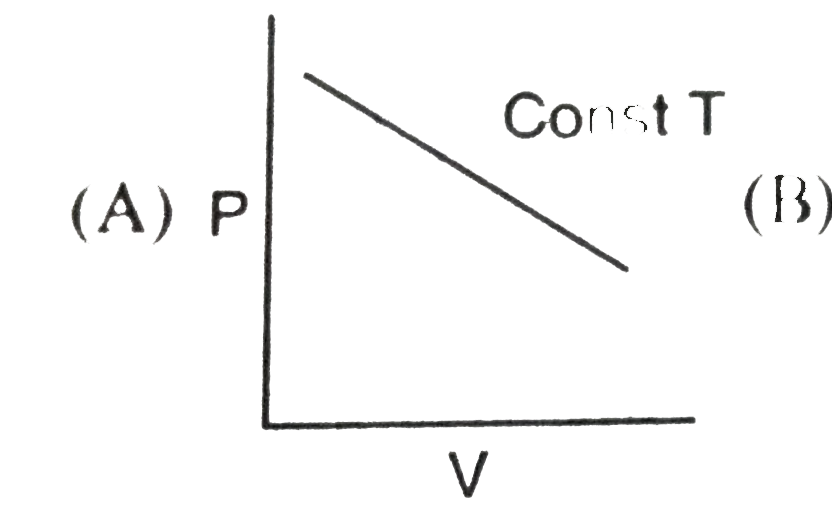
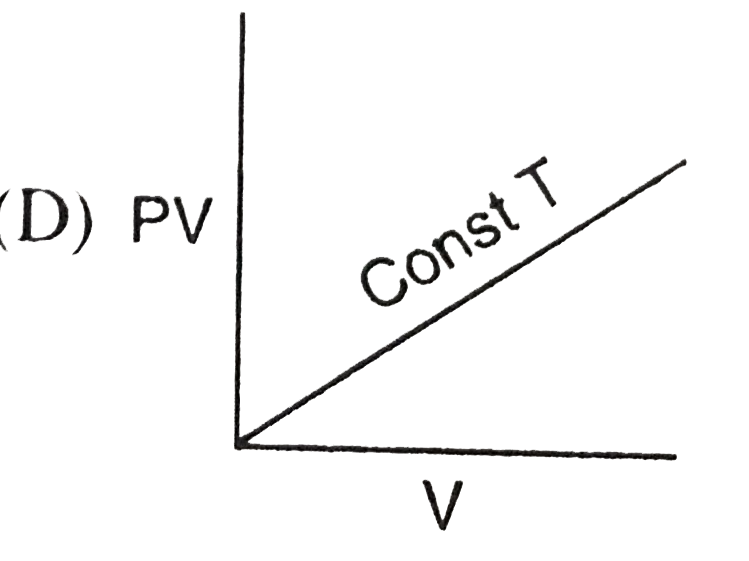
Which of the following diagrams correctly decribes the behavior of a fixed mass of an ideal gas ? (T is measured in K)
A
B
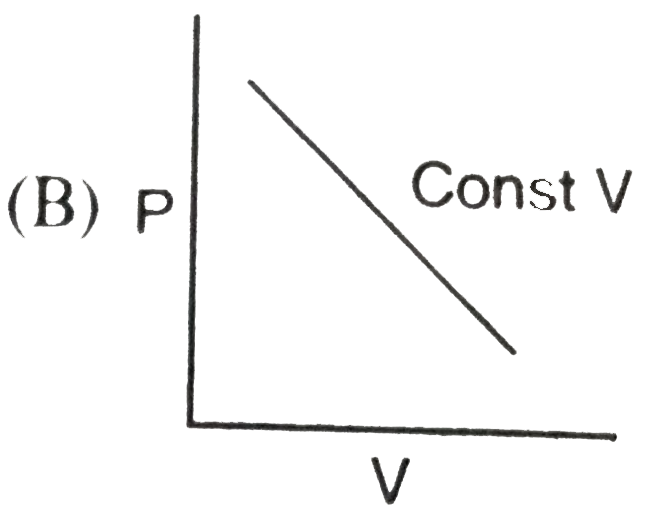
C
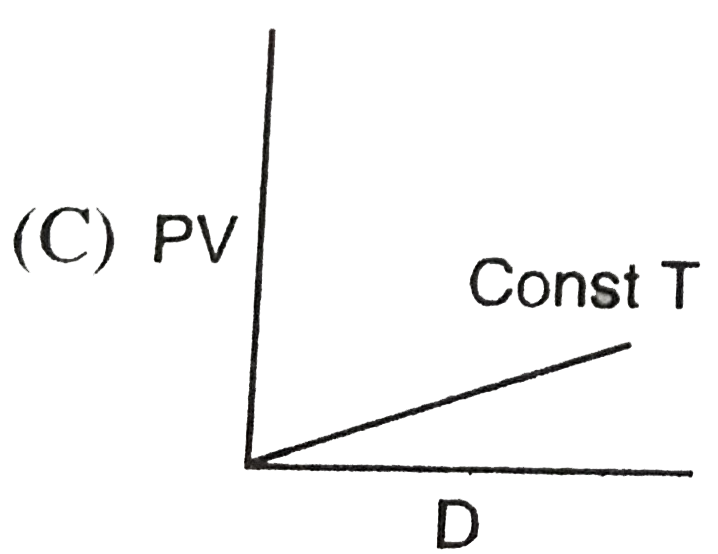
D
Video Solution
Text Solution
The correct Answer is:D
By Charle's law at constant pressure, V/T is constant i.e., V=kT. Hence the plot of V vs T is a straight line passing through the origin
|
Updated on:21/07/2023
Topper's Solved these Questions
- BOOK - DINESH PUBLICATIONCHAPTER - STATE OF MATTER (GASEOUS AND LIQUID STATE)EXERCISE - Selected straight objective types MCQs58videos
STATE OF MATTER (GASEOUS AND LIQUID STATE)
- BOOK - DINESH PUBLICATIONCHAPTER - STATE OF MATTER (GASEOUS AND LIQUID STATE)EXERCISE - Linked Comprhension type MCQs11videos
STATE OF MATTER (GASEOUS AND LIQUID STATE)
- BOOK - DINESH PUBLICATIONCHAPTER - STATE OF MATTER (GASEOUS AND LIQUID STATE)EXERCISE - Ulitmate Preparatory package20videos
STATE OF MATTER (GASEOUS AND LIQUID STATE)
- BOOK - DINESH PUBLICATIONCHAPTER - S-BLOCK ELEMENTS (ALKALI AND ALKALINE EARTH METALS )EXERCISE - Assertion reason12videos
S-BLOCK ELEMENTS (ALKALI AND ALKALINE EARTH METALS )
- BOOK - DINESH PUBLICATIONCHAPTER - STATES OF MATTER (SOLID STATE CHEMISTRY)EXERCISE - ULTIMATE PREPARATORY PACKAGE21videos
STATES OF MATTER (SOLID STATE CHEMISTRY)
Similar Questions
Knowledge Check
- Question 1 - Select One or More
Which of the following diagram correctly describes the behaviour of a fixed mass of an ideal gas ? (T is measured in K)
A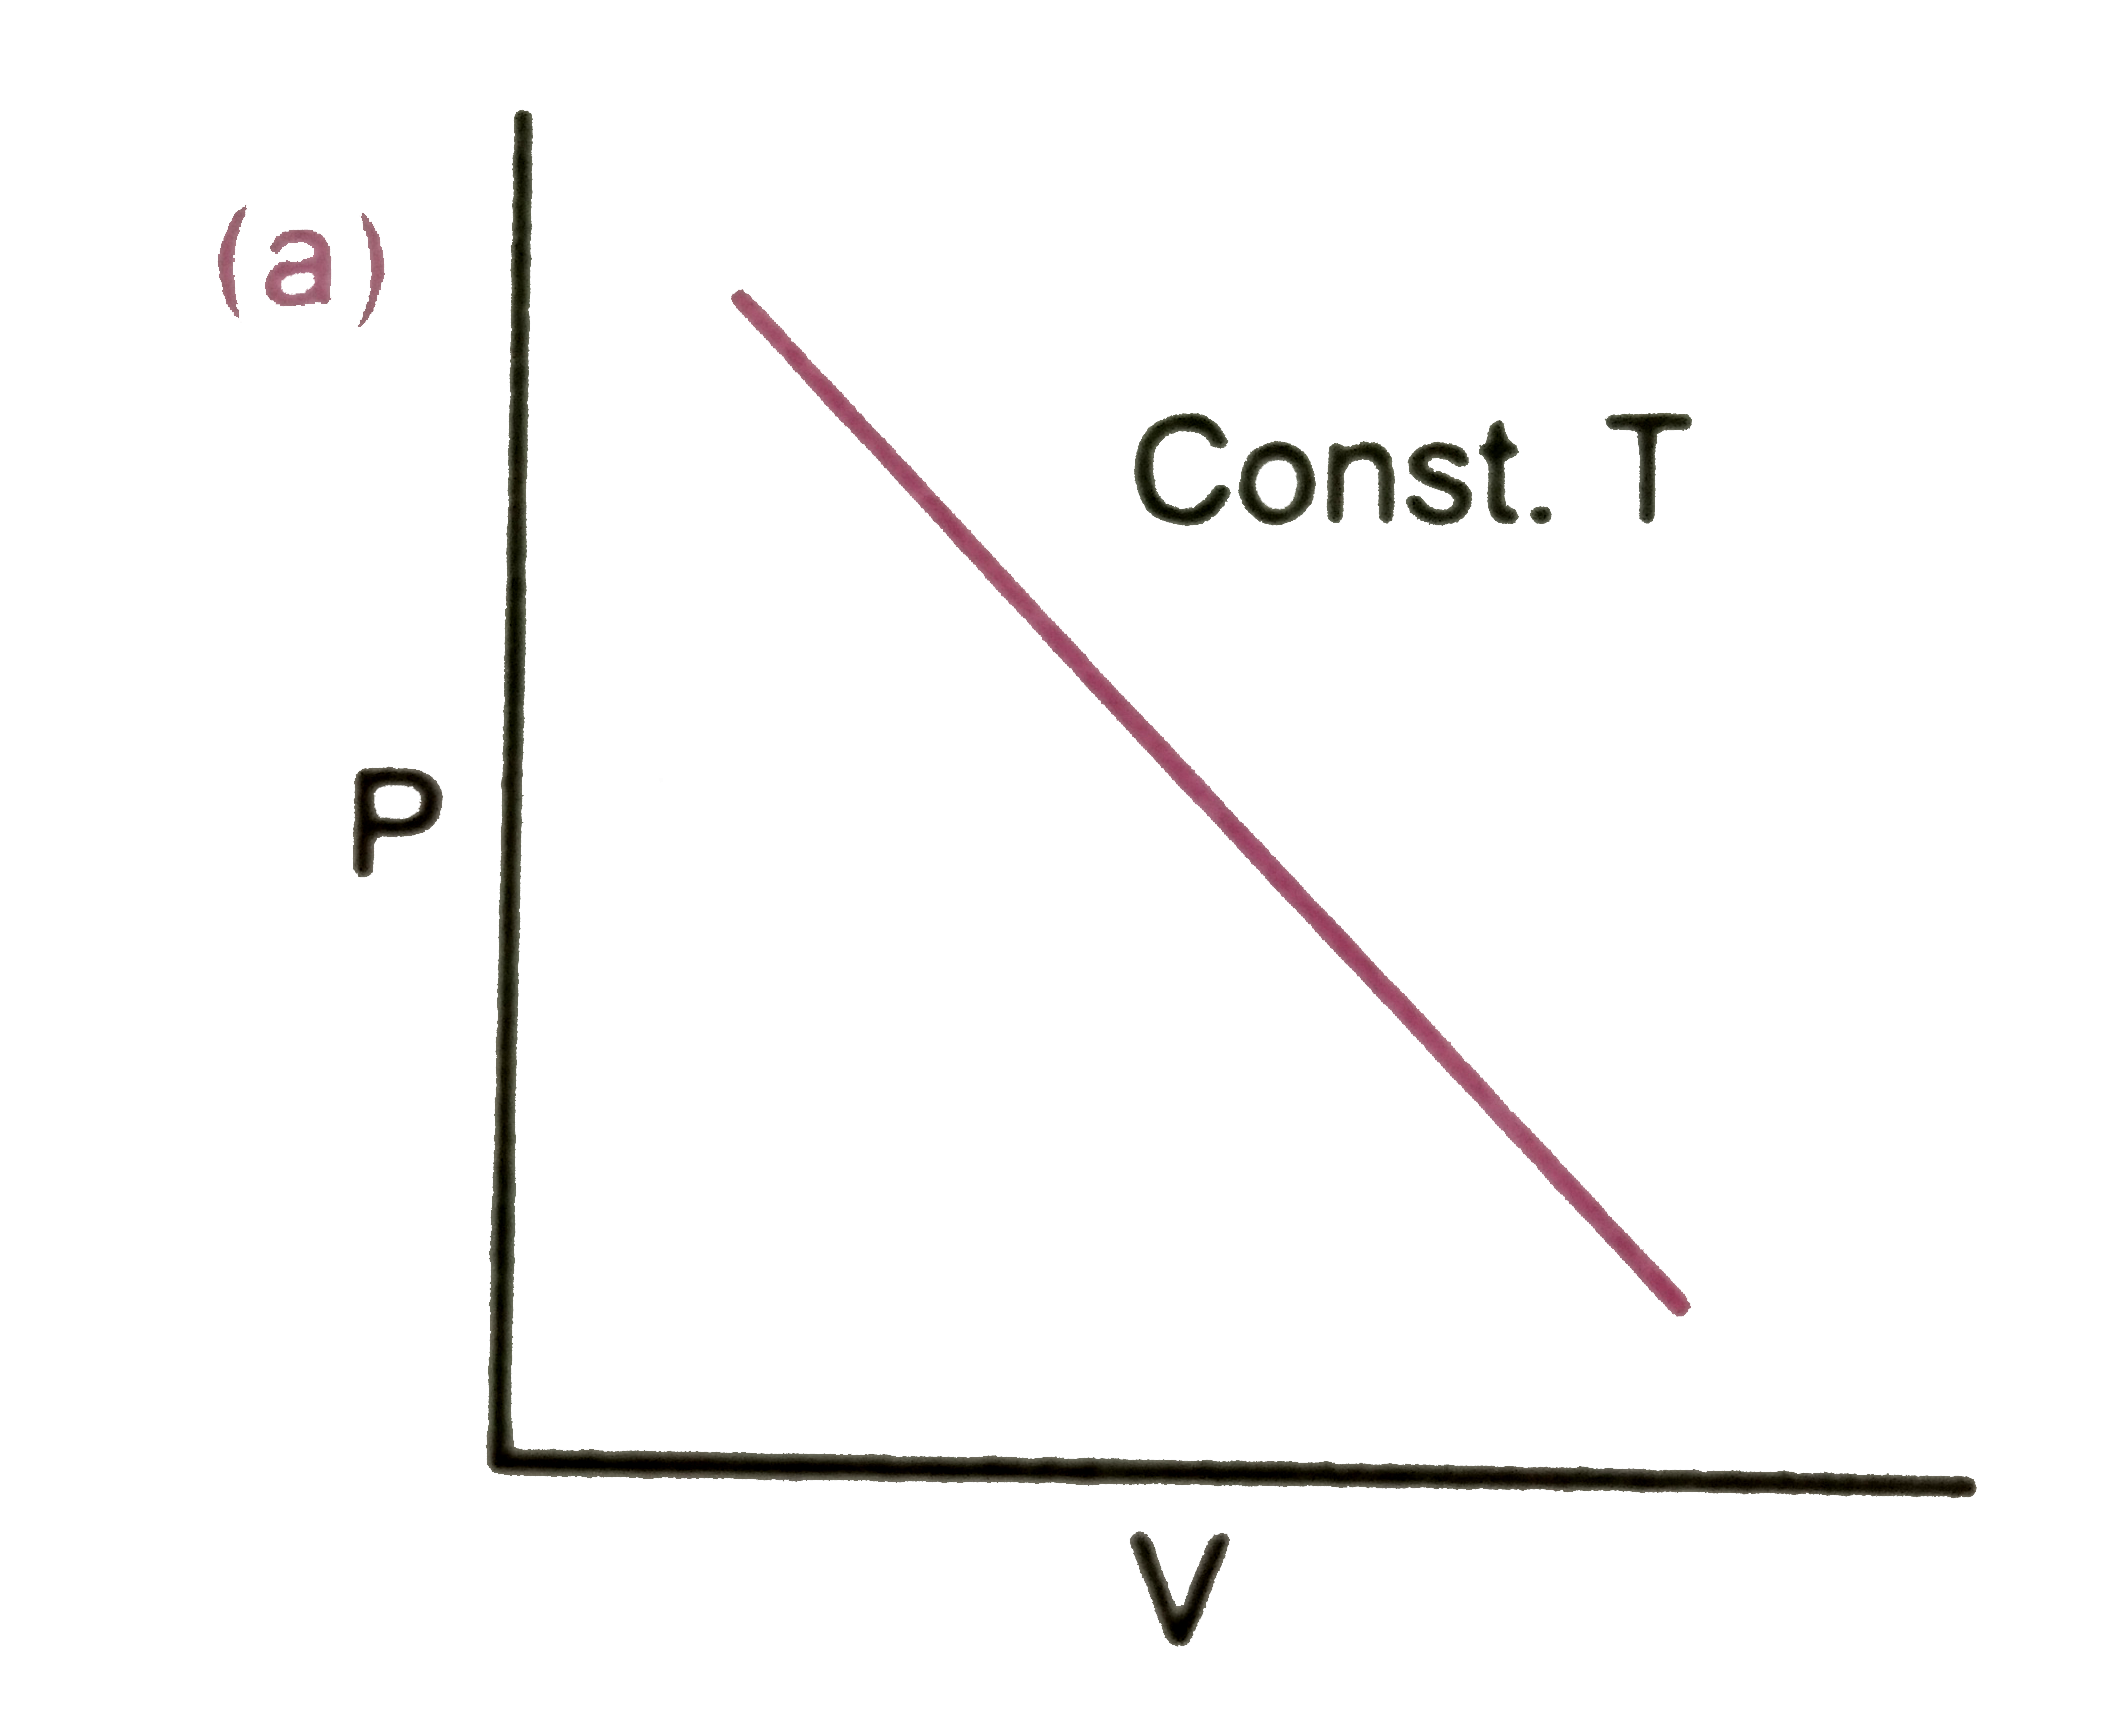 B
B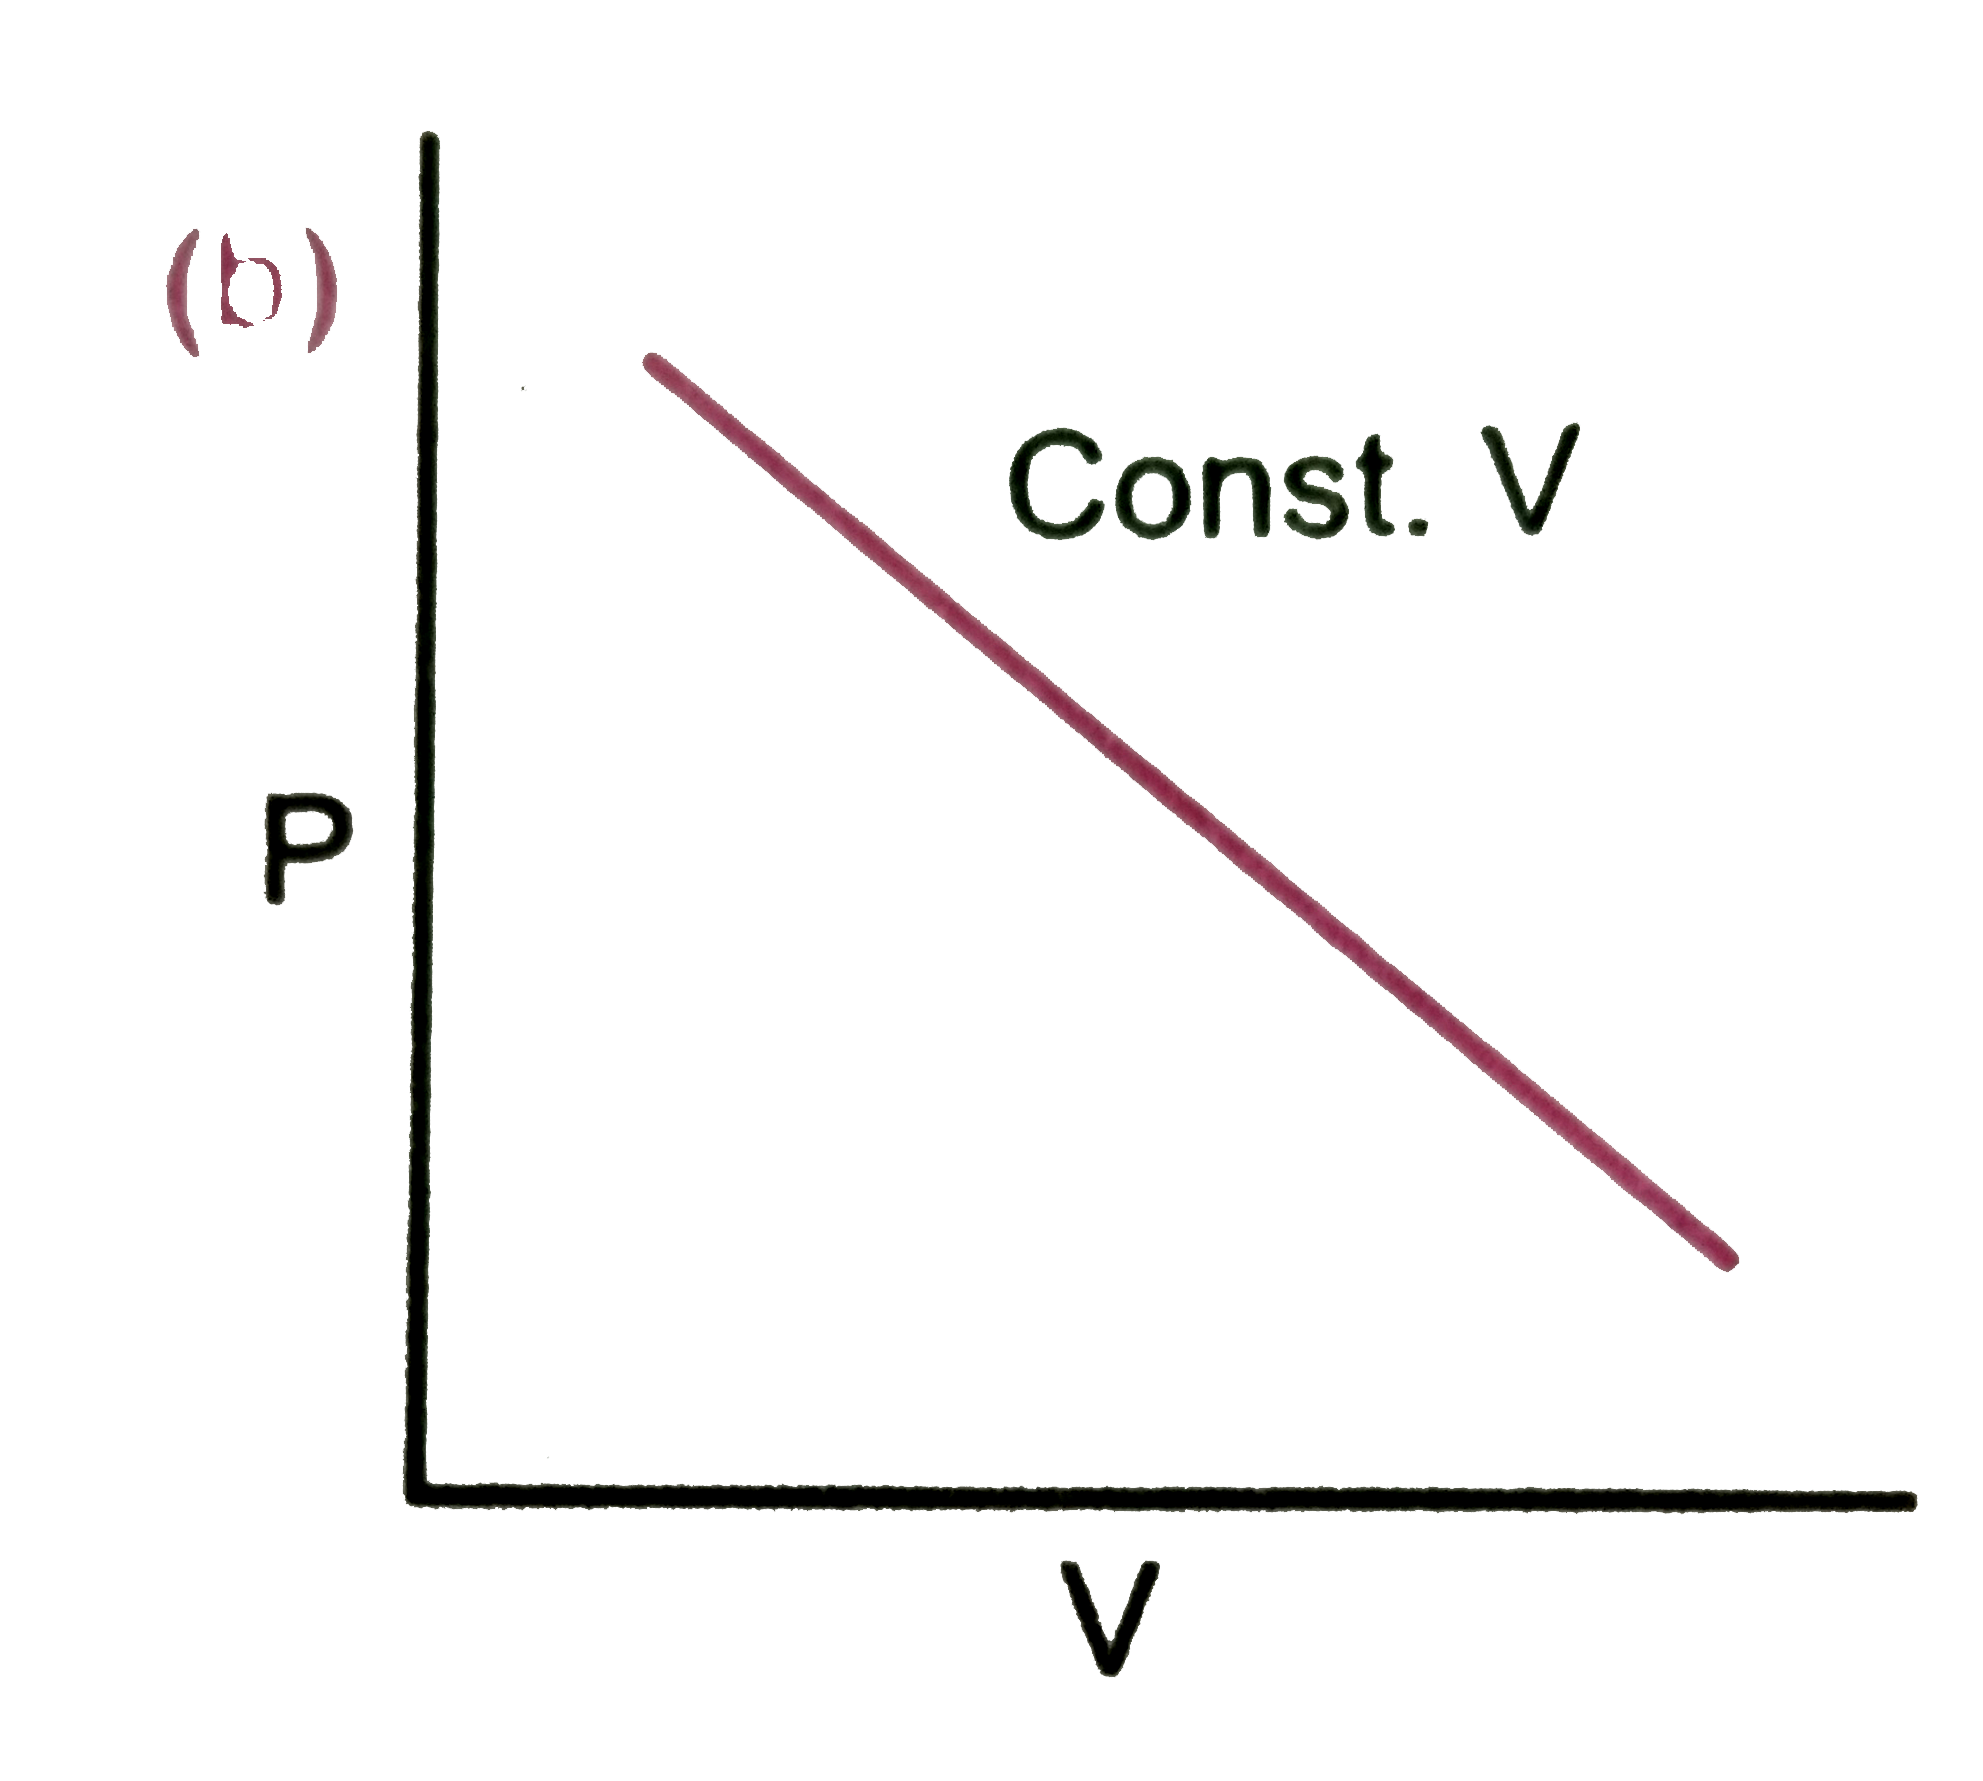 C
C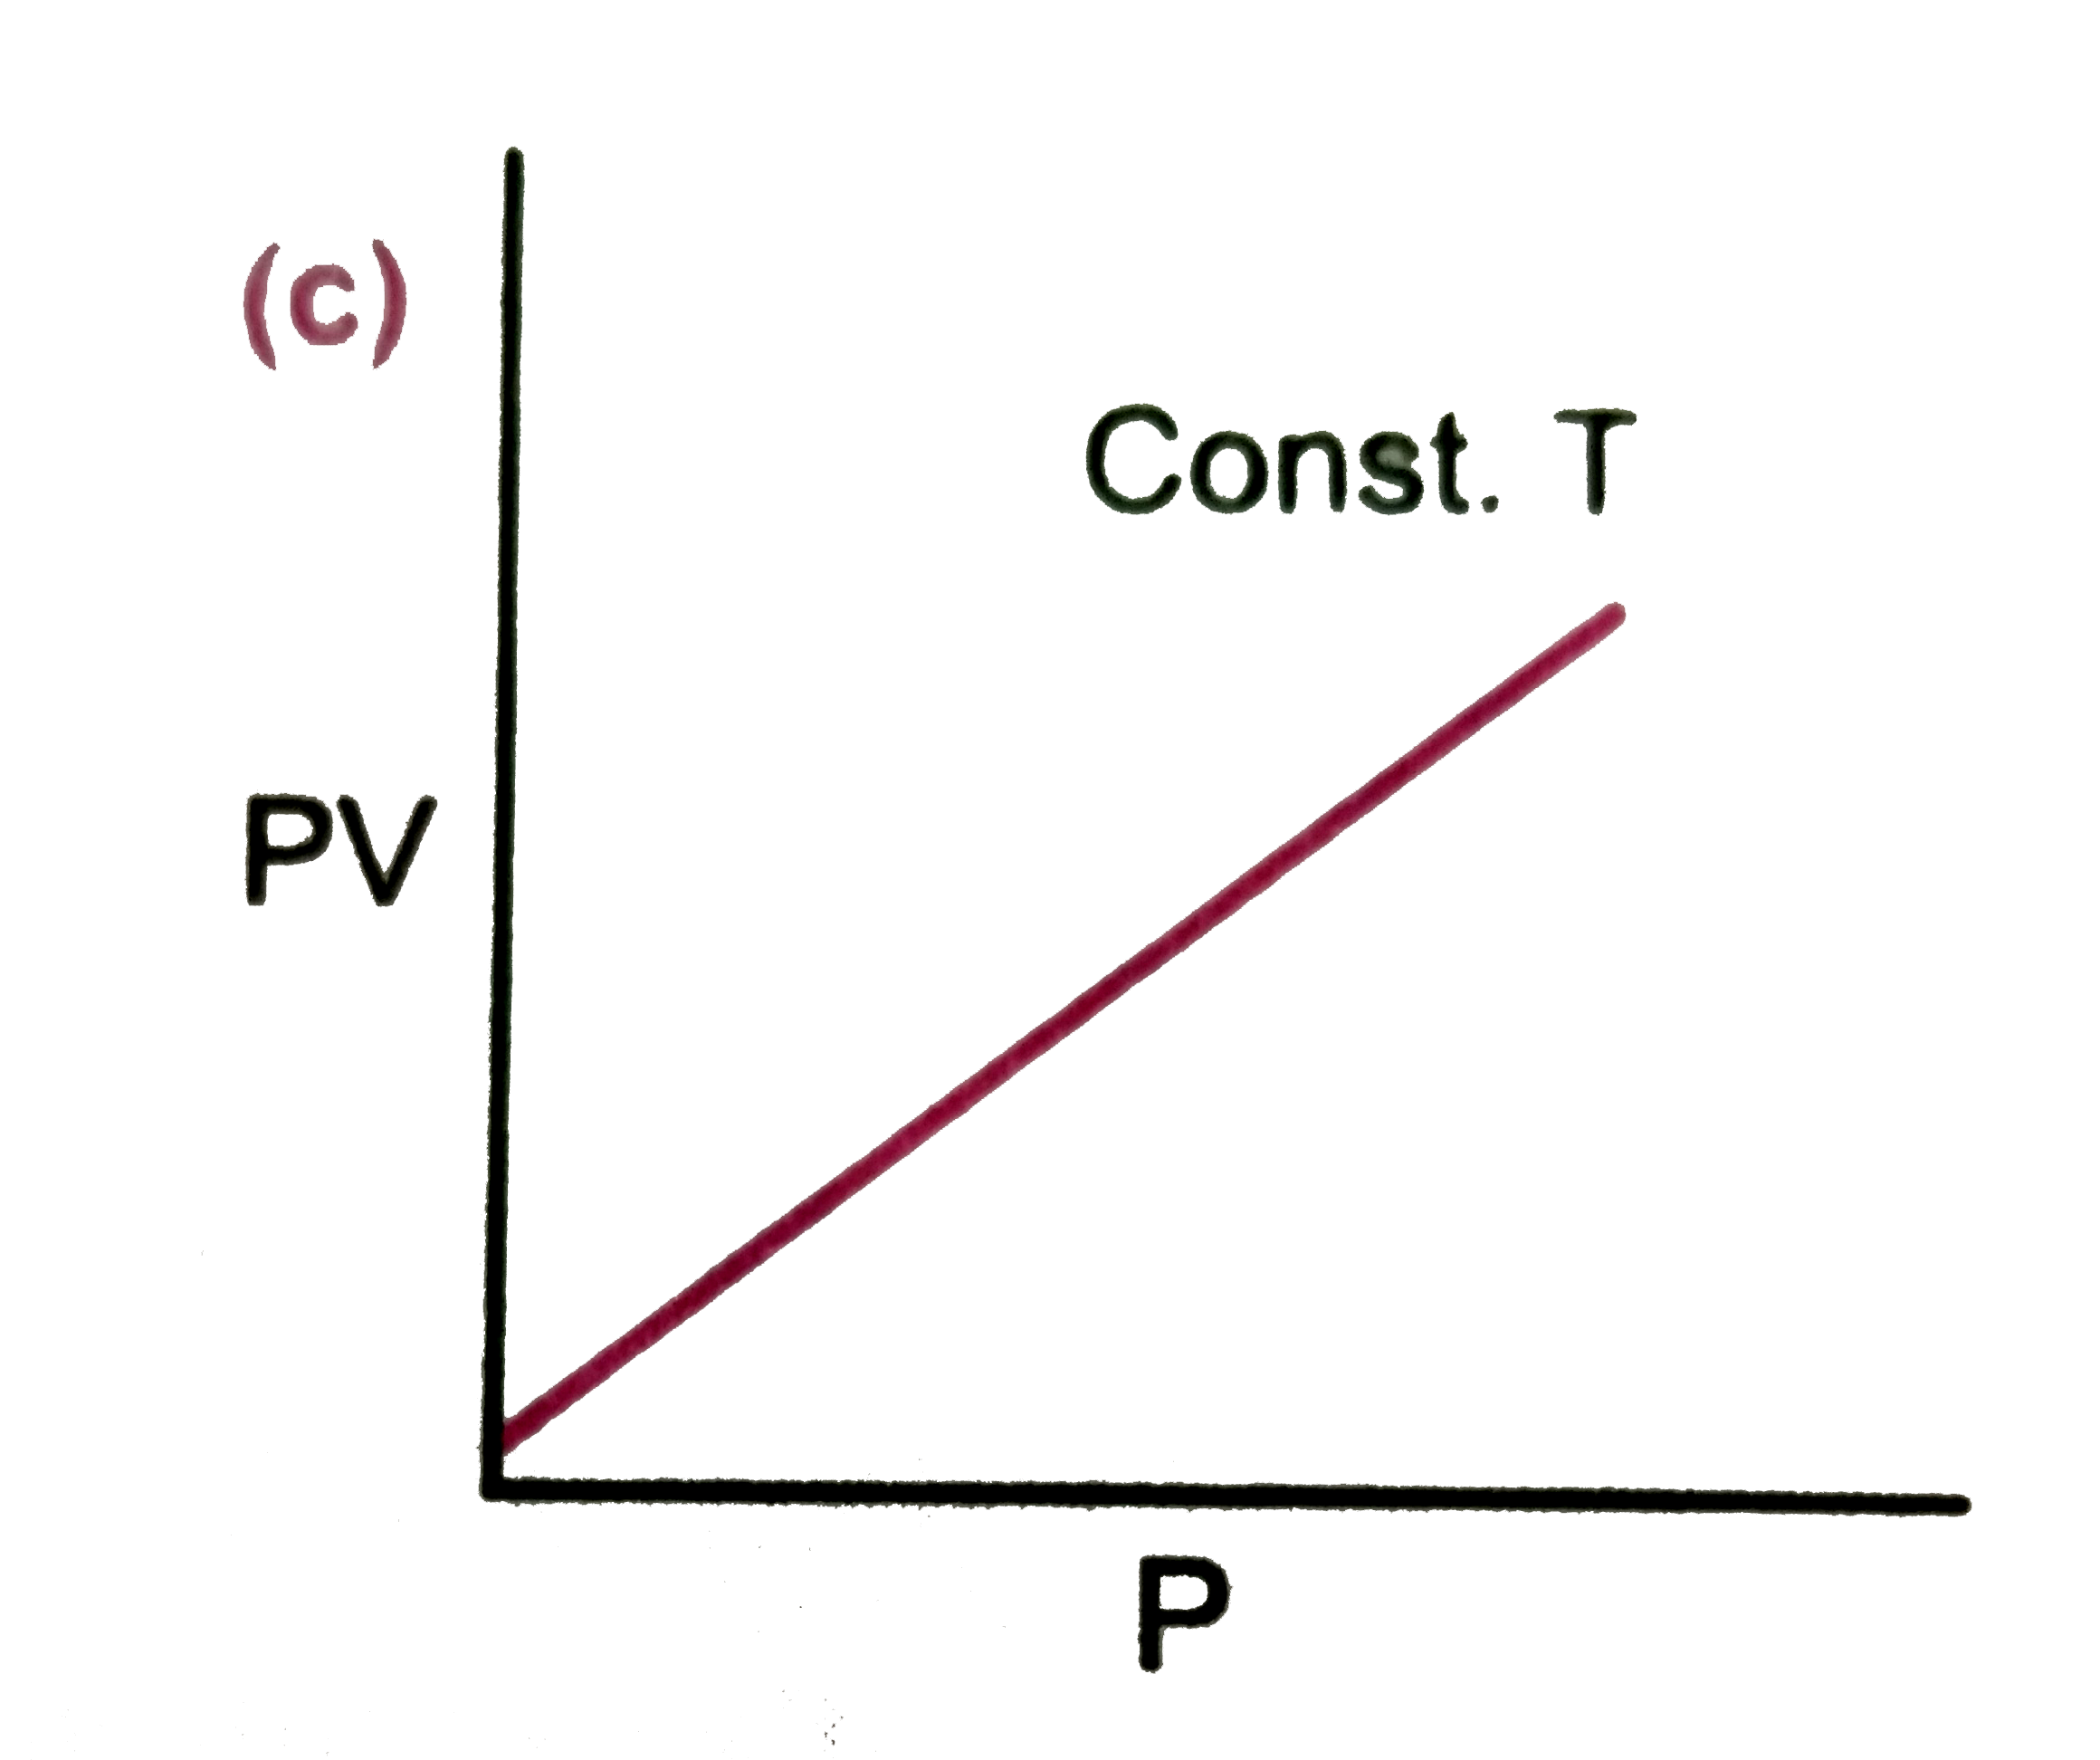 D
D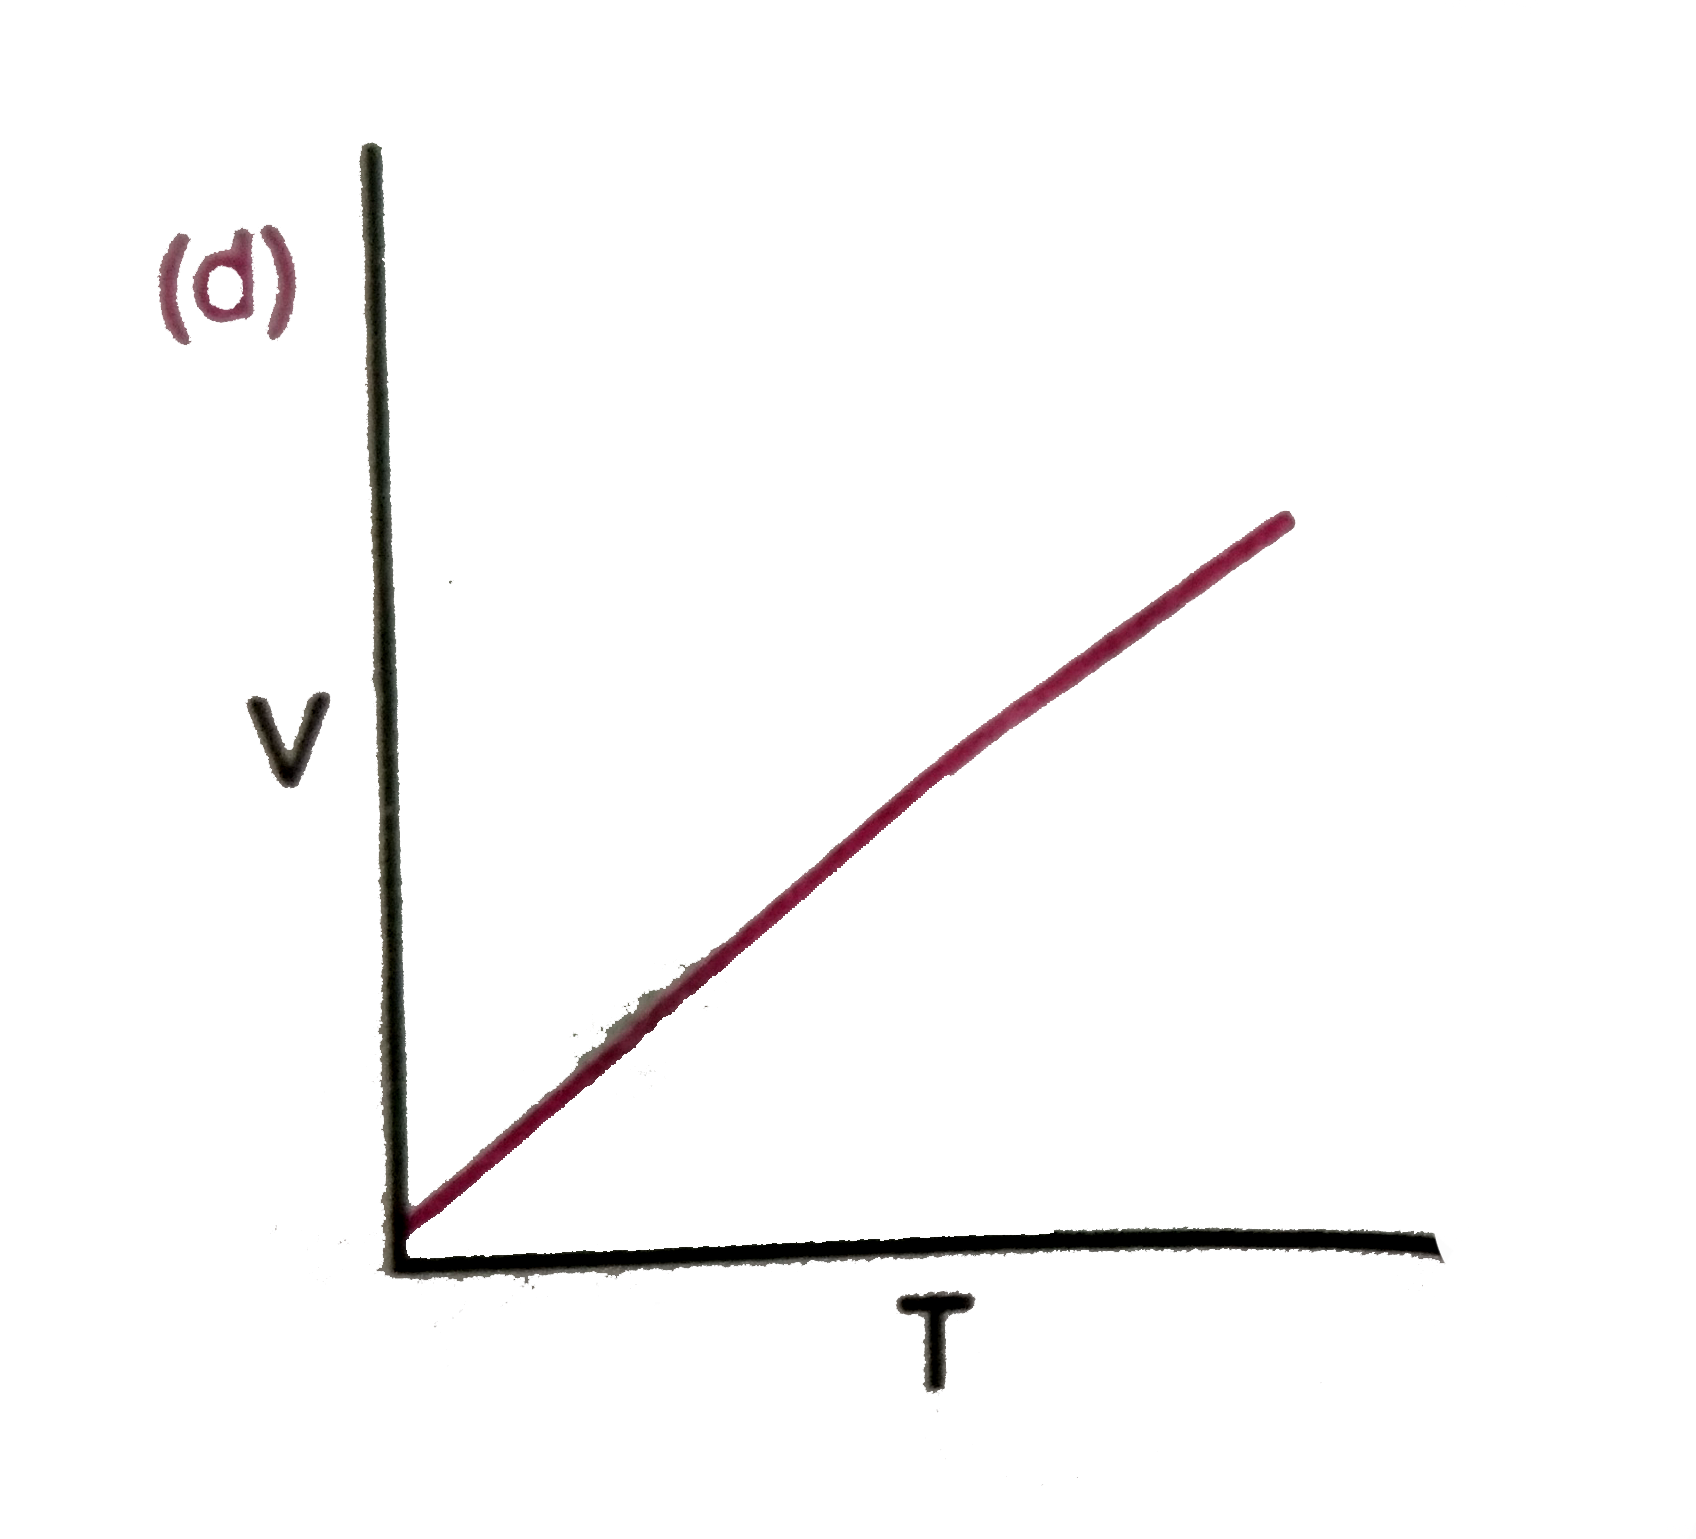
- Question 2 - Select One
Which of the following diagrams correctly represents the counter pattern ?
A B
B C
C D
D
- Question 3 - Select One
Which of the following diagram is correctly related to refining of gold?
A B
B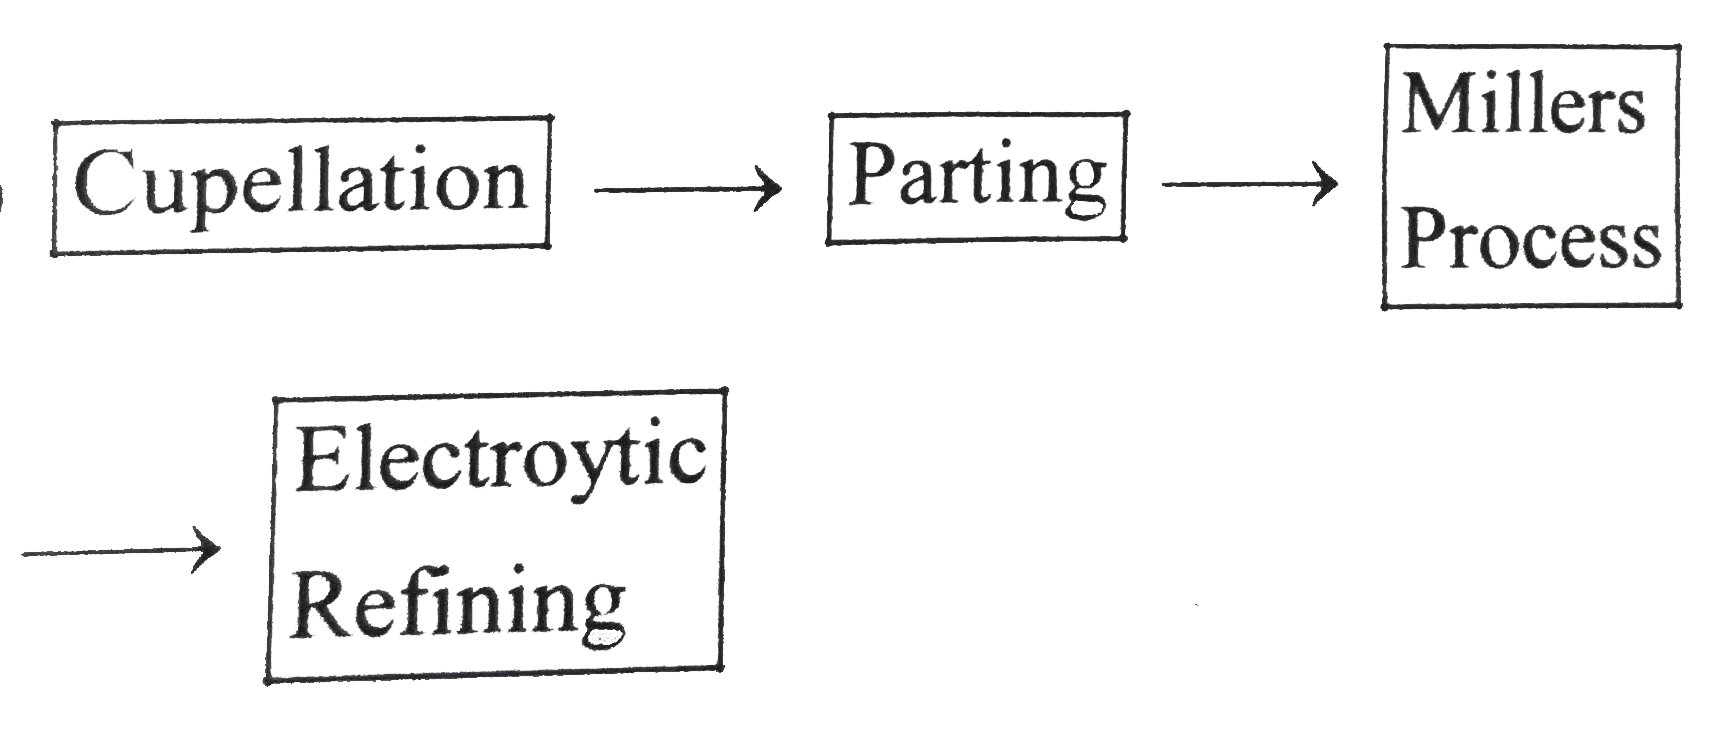 C
C D
D
Which of the following diagrams, Fig. depicts ideal gas behaviour ?
View SolutionWhich of the following diagrams (figure) depicts ideal gas behaviour?
View SolutionWhich of the following best decribes the alkali metals?
View SolutionWhich of the following measure the deviation from ideal behaviour of gas?
View SolutionWhich of the following options is correct w.r.t. ideal gas
View Solution


