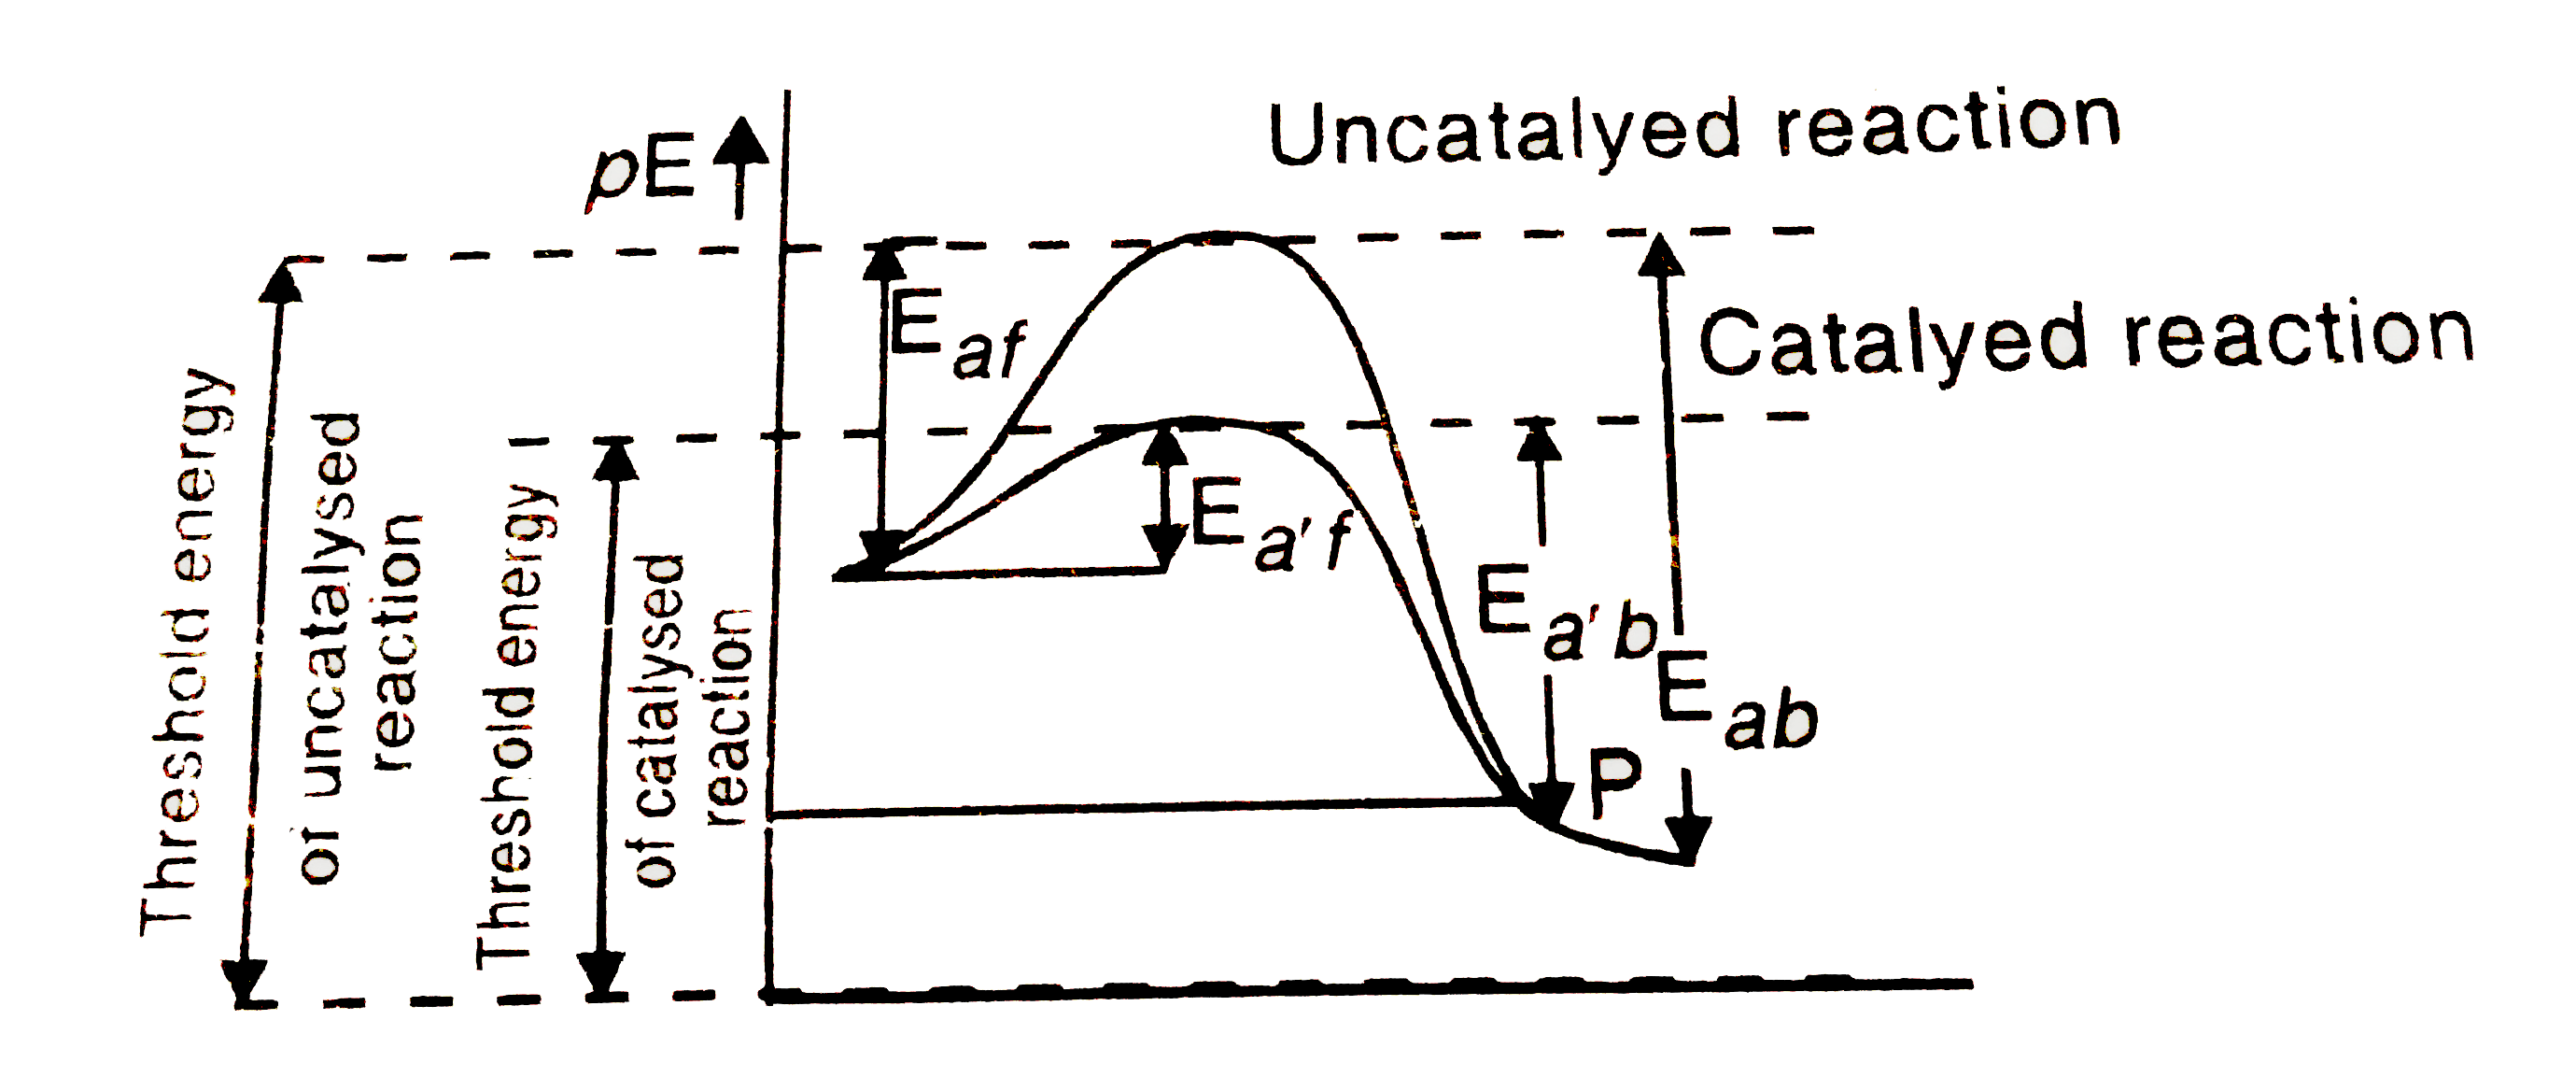
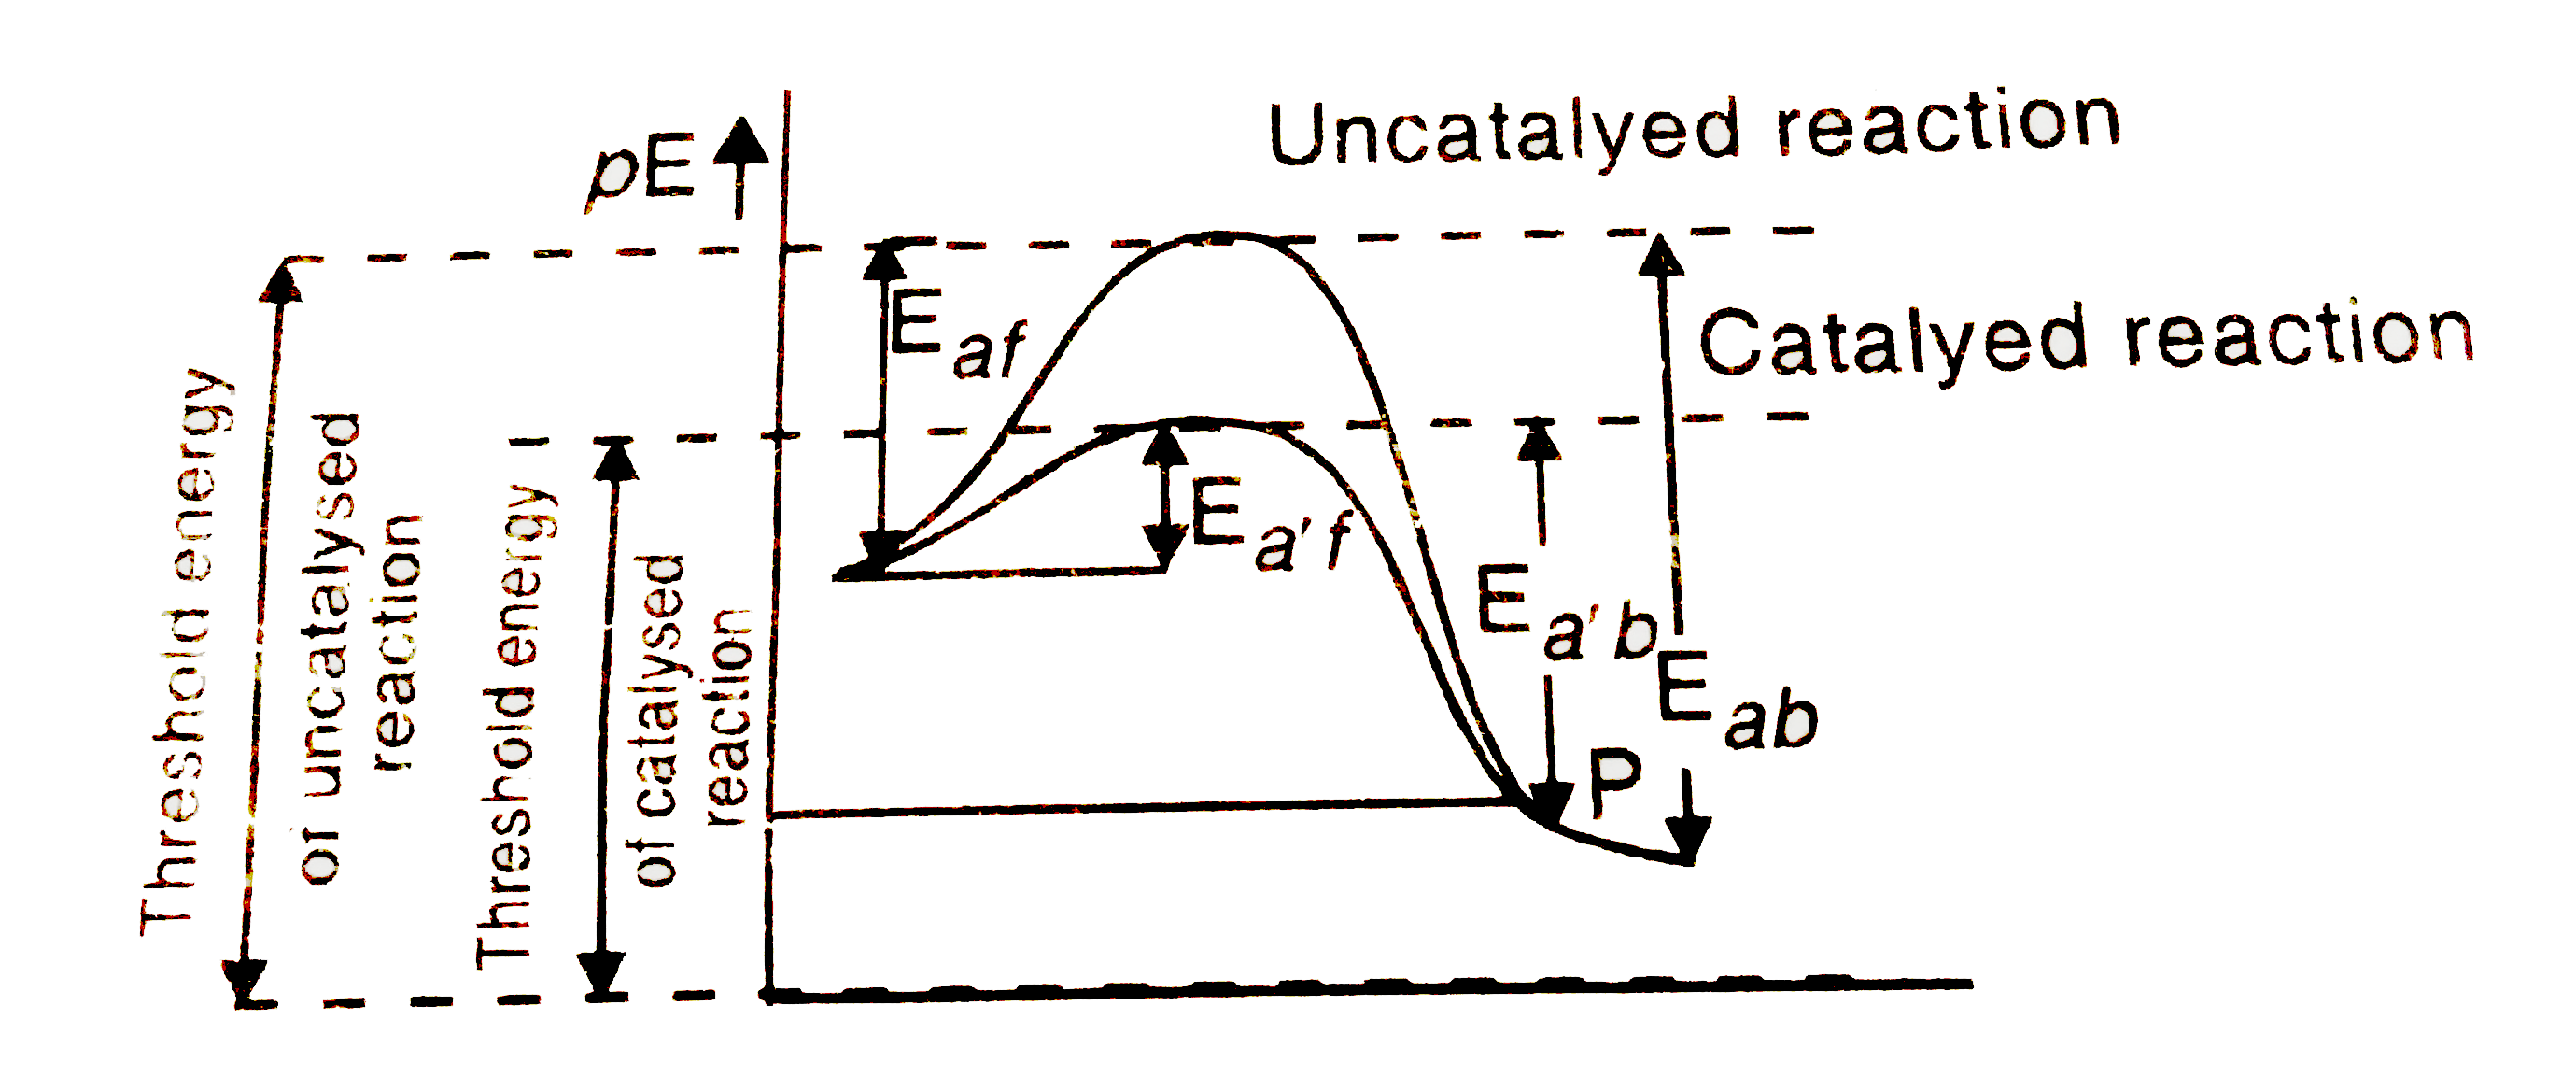
The energy profile diagrams are very important tool through which, we predict lot of things, like the amount of activation energy of the catalysed and uncatalysed reaction as well as for the backward reaction and forward reaction. Thershold energy of the catalysed and uncatalysed reaction. The graphs representing the energy profile diagram for catalysed and uncatalysed reactions are given below :
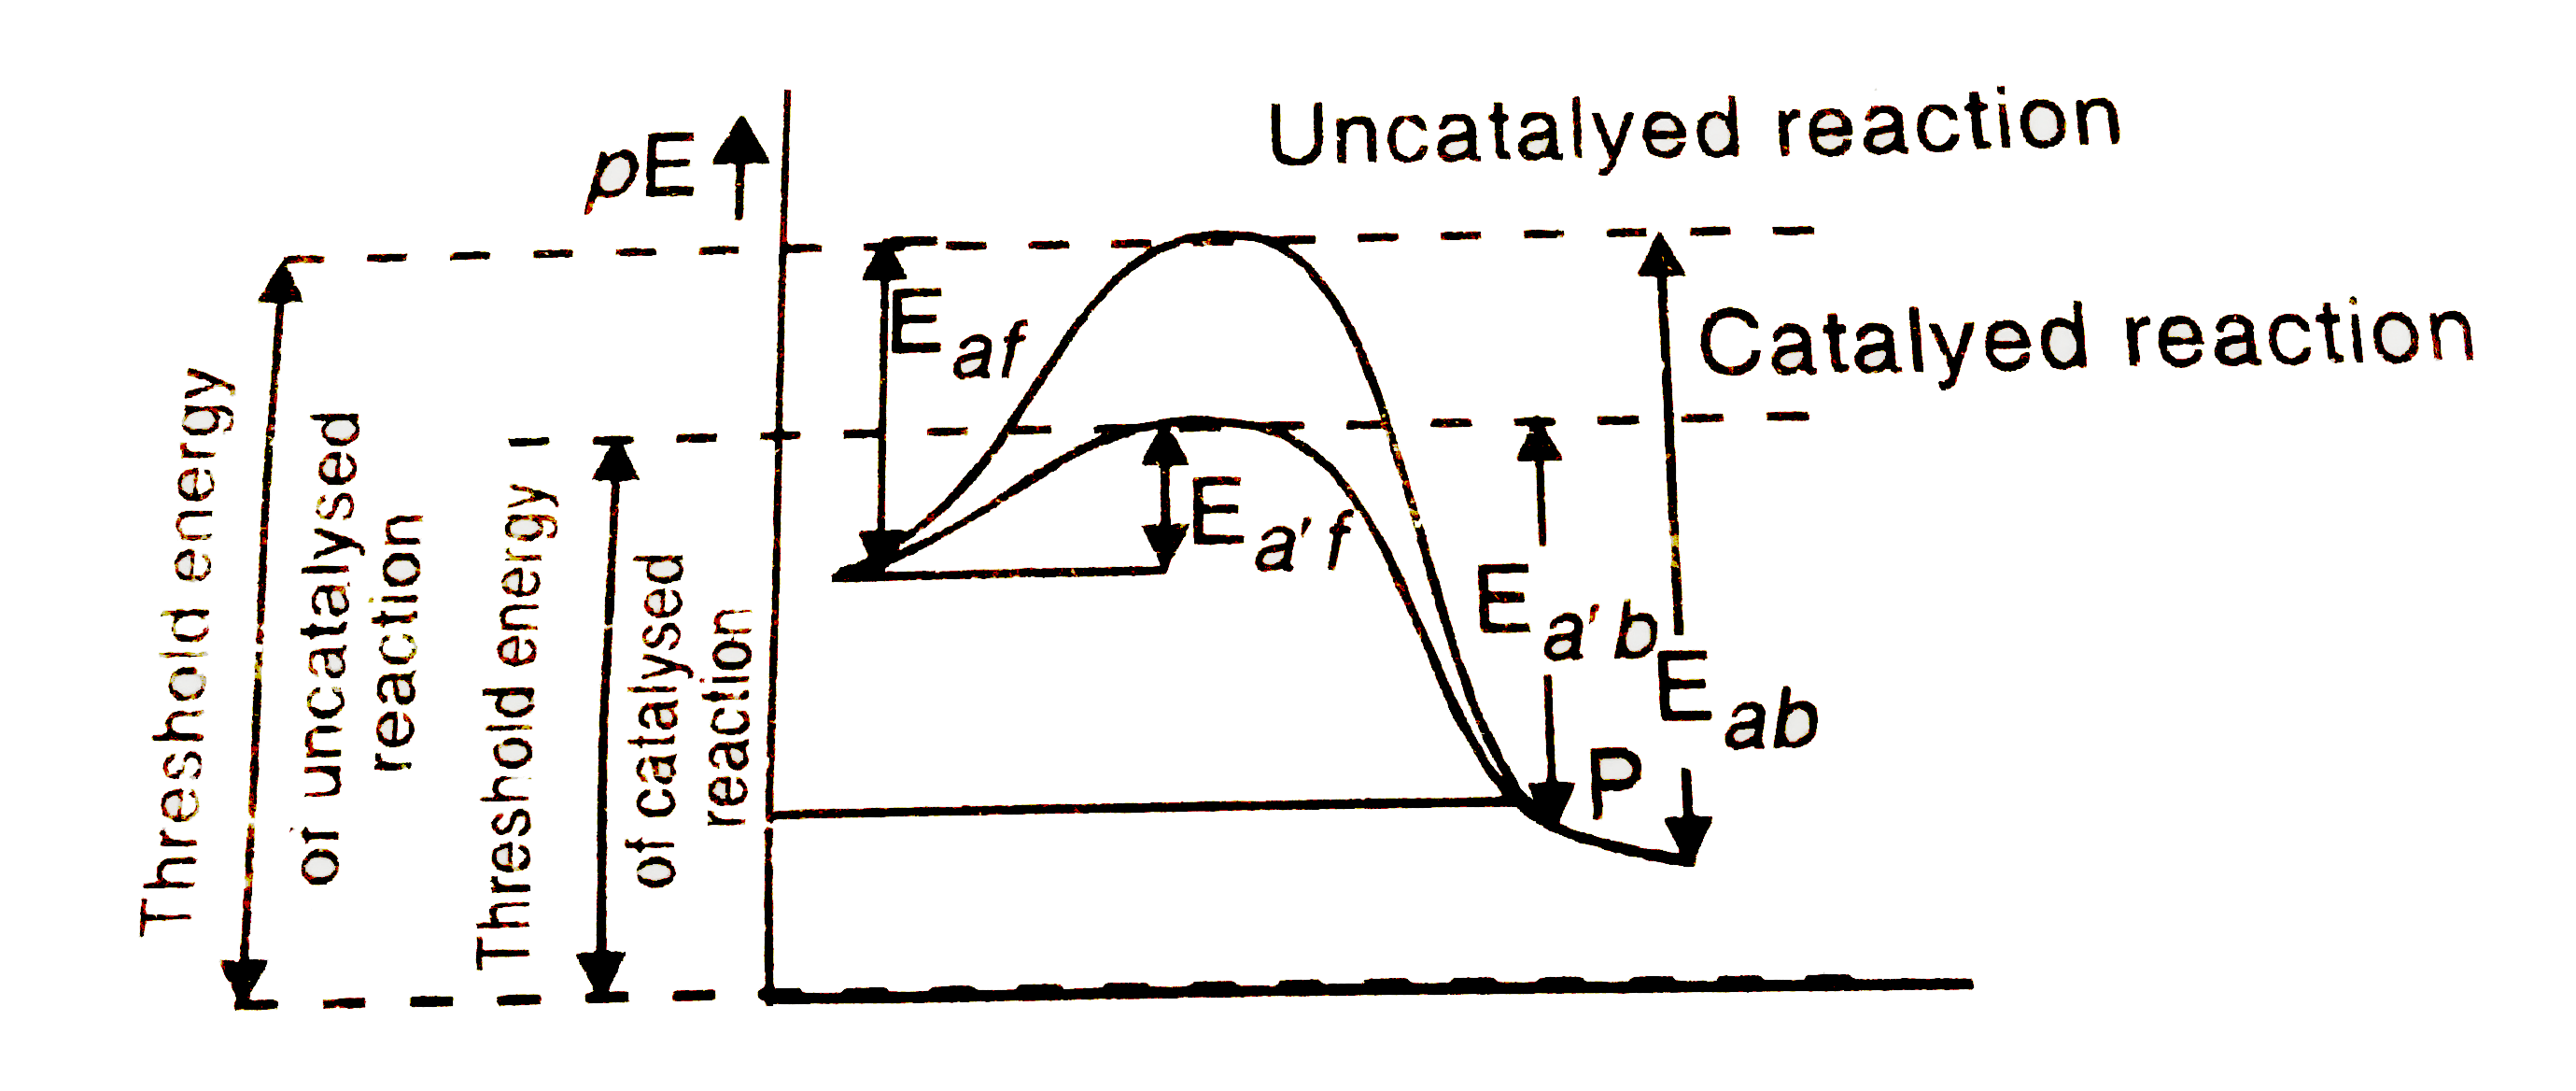
The graph of the lower energy barrier is the energy profile diagram for the catalysed reaction adn of the higher barrier is the energy profile diagram of uncatalysed reaction.
From the graph, it is clear that EafandEab are the activation energy of the respectively. EafandEab are the activation energy of the catalysed forward and backward reaction respectvely
The reaction which occurs by absorption of heat is known as endothermic reaction and by release of heat is known as exothermic reaction
For exothermic reaction, ΔH is negative and for endothermic reaction, ΔH is positive
From Arrhenius equation, we know that k=Ae−Ea/RT where k is rate constant which signifies effective number of collisions. A is known as Arrehnius constant, or maximum rate constant of frequency factor which signifies maximum number of collisions with proper orientation of reacting species per mole per second.
The catalysed reaction occurs at 500 K and the uncatalysed reaction occurs at 800 K in such way so that the rate of catalysed reaction and uncatalysed reaction becomes equal as well as the catalyst lower down the energy barrier by 60 J.
Answer the following questions on the basis of above paragraph
What percentage fraction of the molecule will cross over the energy barrier at 2000 K temperature for 36.848 kJ activation energy ? (Given R = 8 J mol−1K−1)
10%
20%
90%
80%
The correct Answer is:A
Percentage fraction of the molecule crossing over the energy barrier
=100e−Ea/RT=100e−36.848×10008×2000
=100e−2.303=100×110=10%.
Topper's Solved these Questions
- RATES OF REACTIONS AND CHEMICAL KINETICSBOOK - DINESH PUBLICATIONCHAPTER - RATES OF REACTIONS AND CHEMICAL KINETICSEXERCISE - Matrix Match
2 Videos
- RATES OF REACTIONS AND CHEMICAL KINETICSBOOK - DINESH PUBLICATIONCHAPTER - RATES OF REACTIONS AND CHEMICAL KINETICSEXERCISE - Integer
4 Videos
- RATES OF REACTIONS AND CHEMICAL KINETICSBOOK - DINESH PUBLICATIONCHAPTER - RATES OF REACTIONS AND CHEMICAL KINETICSEXERCISE - Selected Straight
49 Videos
- PHYSICAL AND CHEMICAL EQUILIBRIABOOK - DINESH PUBLICATIONCHAPTER - PHYSICAL AND CHEMICAL EQUILIBRIAEXERCISE - ULTIMATE PREPARATORY PACKAGE
13 Videos
- REDOX REACTIONSBOOK - DINESH PUBLICATIONCHAPTER - REDOX REACTIONSEXERCISE - Reasoning Type Questions
4 Videos
Similar Questions
When the activation energies of the forward and backward reactions are equal, then :
View SolutionThe energy profile diagrams are very important tool through which, we predict lot of things, like the amount of activation energy of the catalysed and uncatalysed reaction as well as for the backward reaction and forward reaction. Thershold energy of the catalysed and uncatalysed reaction. The graphs representing the energy profile diagram for catalysed and uncatalysed reactions are given below :
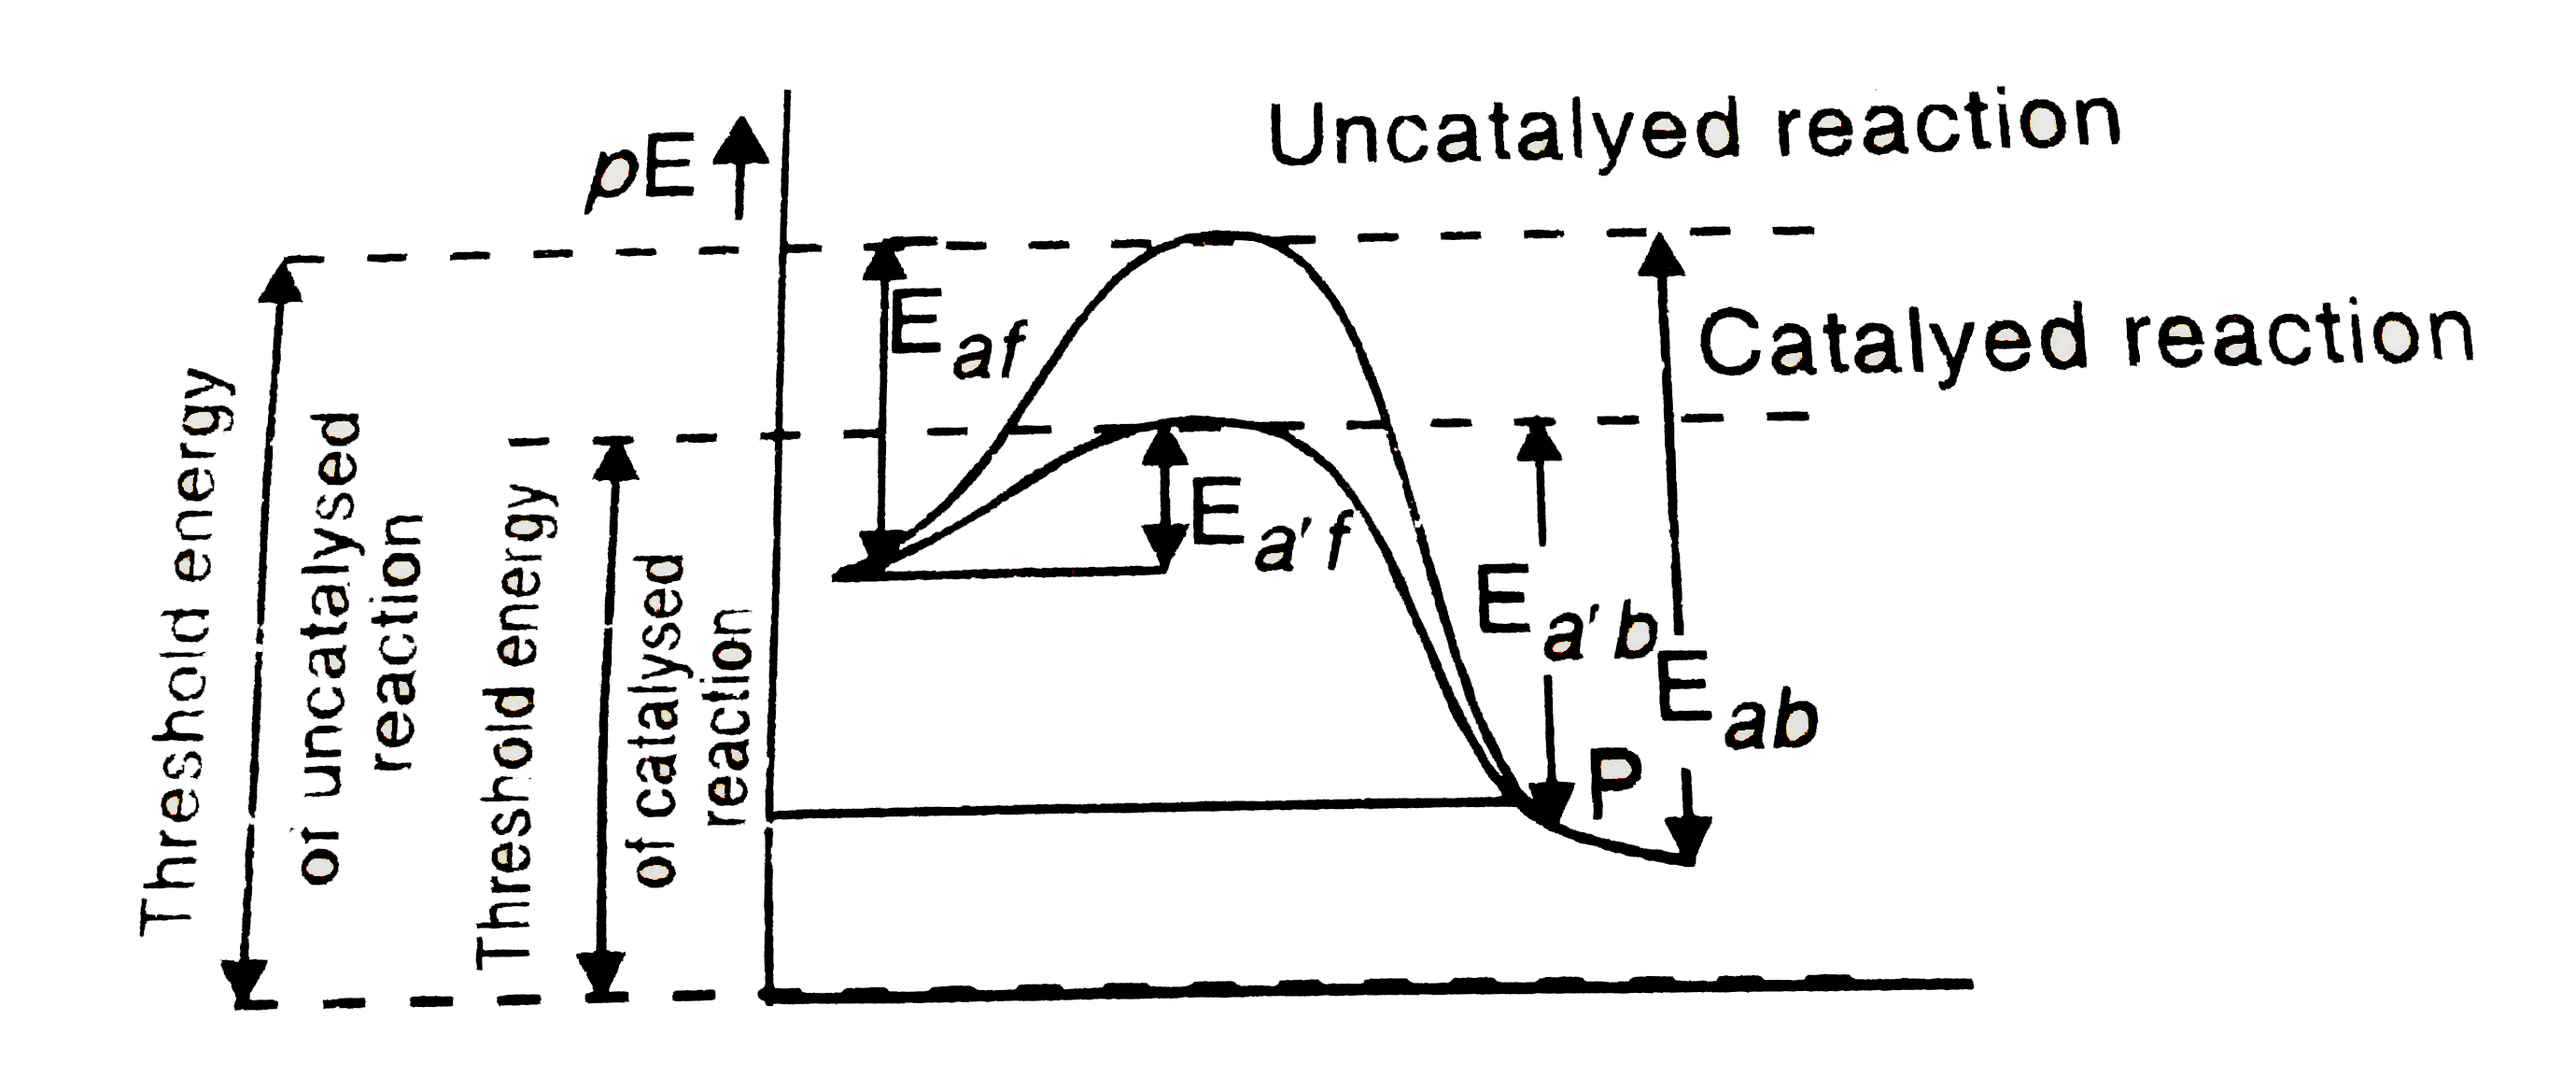
The graph of the lower energy barrier is the energy profile diagram for the catalysed reaction adn of the higher barrier is the energy profile diagram of uncatalysed reaction.
From the graph, it is clear that EafandEab are the activation energy of the respectively. EafandEab are the activation energy of the catalysed forward and backward reaction respectvely
The reaction which occurs by absorption of heat is known as endothermic reaction and by release of heat is known as exothermic reaction
For exothermic reaction, ΔH is negative and for endothermic reaction, ΔH is positive
From Arrhenius equation, we know that k=Ae−Ea/RT where k is rate constant which signifies effective number of collisions. A is known as Arrehnius constant, or maximum rate constant of frequency factor which signifies maximum number of collisions with proper orientation of reacting species per mole per second.
The catalysed reaction occurs at 500 K and the uncatalysed reaction occurs at 800 K in such way so that the rate of catalysed reaction and uncatalysed reaction becomes equal as well as the catalyst lower down the energy barrier by 60 J.
Answer the following questions on the basis of above paragraph
From the given above information, what will be threshold energy for the catalysed reaction. If the normal energy of the reactant is 40 J
View Solution
Knowledge Check
The energy profile diagrams are very important tool through which, we predict lot of things, like the amount of activation energy of the catalysed and uncatalysed reaction as well as for the backward reaction and forward reaction. Thershold energy of the catalysed and uncatalysed reaction. The graphs representing the energy profile diagram for catalysed and uncatalysed reactions are given below :
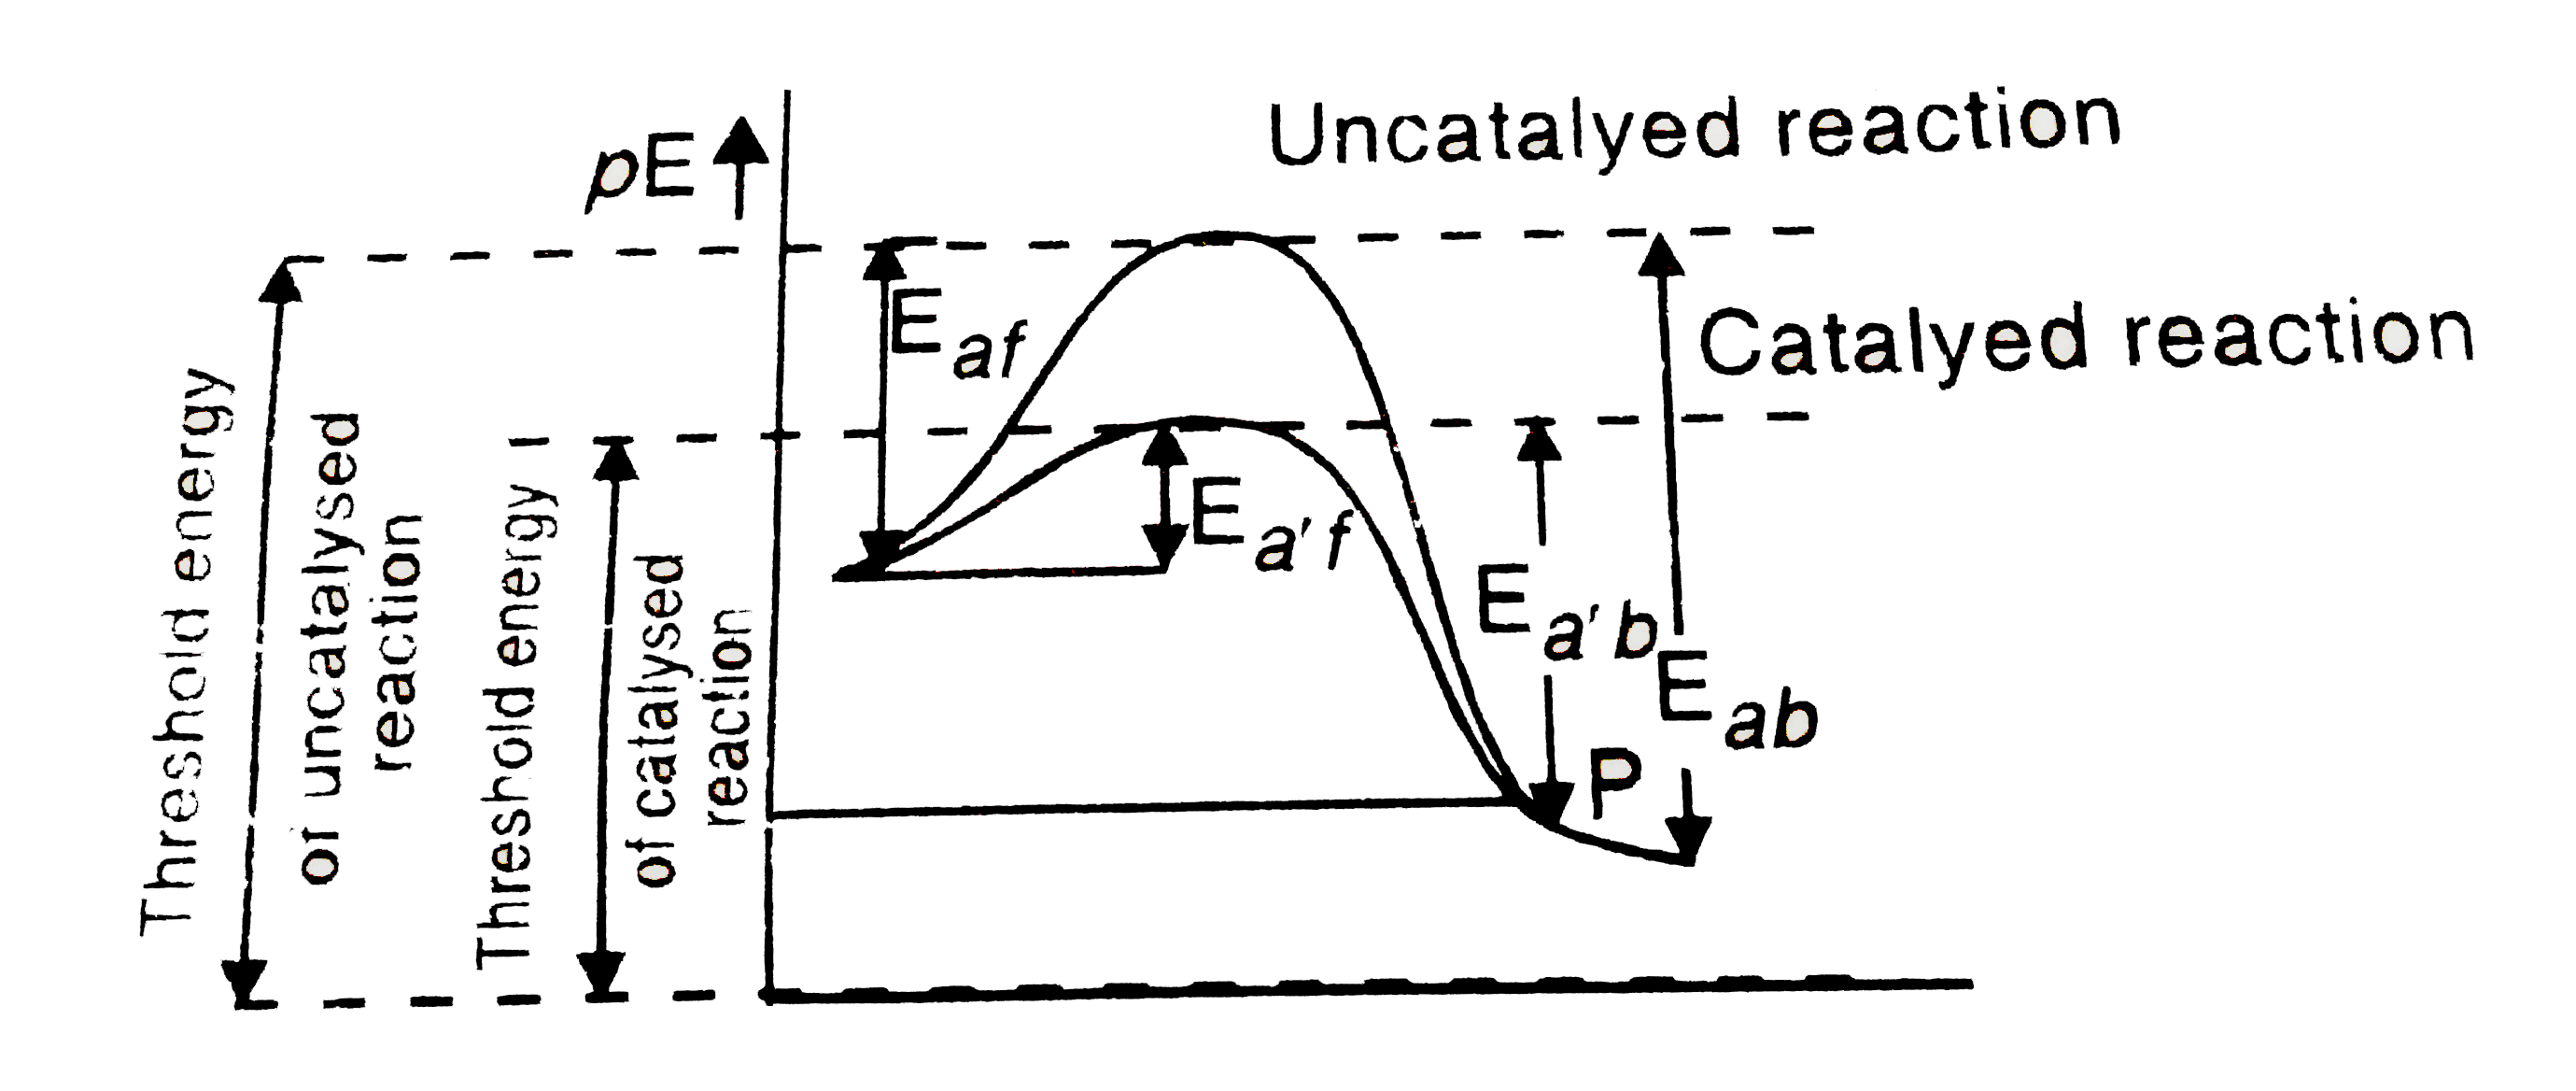
The graph of the lower energy barrier is the energy profile diagram for the catalysed reaction adn of the higher barrier is the energy profile diagram of uncatalysed reaction.
From the graph, it is clear that EafandEab are the activation energy of the respectively. EafandEab are the activation energy of the catalysed forward and backward reaction respectvely
The reaction which occurs by absorption of heat is known as endothermic reaction and by release of heat is known as exothermic reaction
For exothermic reaction, ΔH is negative and for endothermic reaction, ΔH is positive
From Arrhenius equation, we know that k=Ae−Ea/RT where k is rate constant which signifies effective number of collisions. A is known as Arrehnius constant, or maximum rate constant of frequency factor which signifies maximum number of collisions with proper orientation of reacting species per mole per second.
The catalysed reaction occurs at 500 K and the uncatalysed reaction occurs at 800 K in such way so that the rate of catalysed reaction and uncatalysed reaction becomes equal as well as the catalyst lower down the energy barrier by 60 J.
Answer the following questions on the basis of above paragraph
What will be the value of activation energy with respect to the uncatalysed reaction ?A120 JB100 JC130 JD160 JThe energy profile diagrams are very important tool through which, we predict lot of things, like the amount of activation energy of the catalysed and uncatalysed reaction as well as for the backward reaction and forward reaction. Thershold energy of the catalysed and uncatalysed reaction. The graphs representing the energy profile diagram for catalysed and uncatalysed reactions are given below :
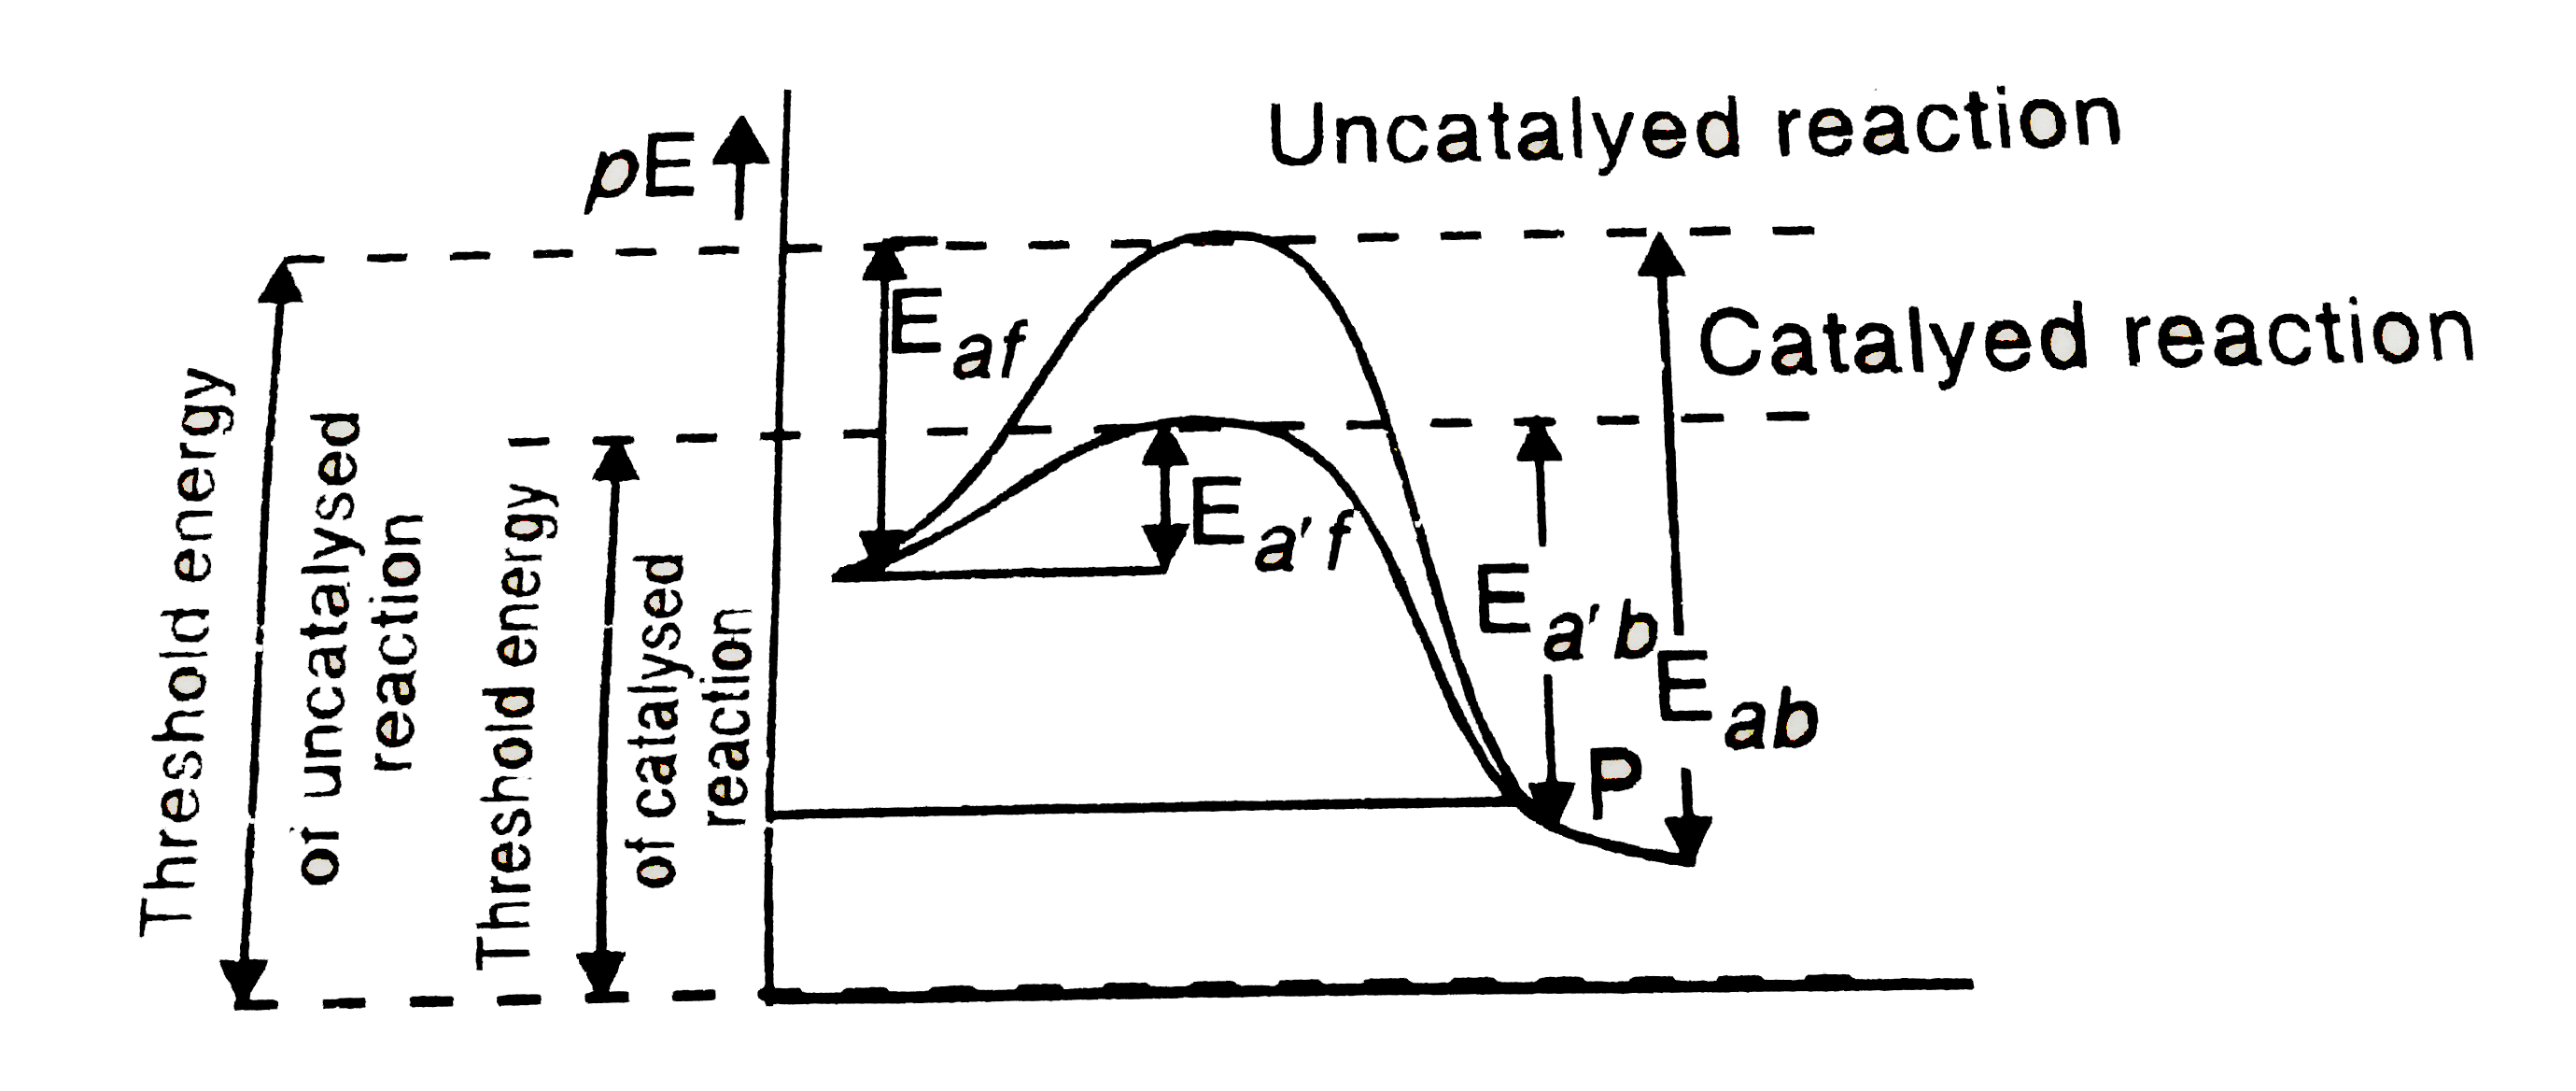
The graph of the lower energy barrier is the energy profile diagram for the catalysed reaction adn of the higher barrier is the energy profile diagram of uncatalysed reaction.
From the graph, it is clear that EafandEab are the activation energy of the respectively. EafandEab are the activation energy of the catalysed forward and backward reaction respectvely
The reaction which occurs by absorption of heat is known as endothermic reaction and by release of heat is known as exothermic reaction
For exothermic reaction, ΔH is negative and for endothermic reaction, ΔH is positive
From Arrhenius equation, we know that k=Ae−Ea/RT where k is rate constant which signifies effective number of collisions. A is known as Arrehnius constant, or maximum rate constant of frequency factor which signifies maximum number of collisions with proper orientation of reacting species per mole per second.
The catalysed reaction occurs at 500 K and the uncatalysed reaction occurs at 800 K in such way so that the rate of catalysed reaction and uncatalysed reaction becomes equal as well as the catalyst lower down the energy barrier by 60 J.
Answer the following questions on the basis of above paragraph
Which of the following statement(s) is/are correct for the catalysed and uncatalysed reactions ?AAt constant temperature, the ΔG∘ of the catalysed and uncatalysed reactions are sameBEven at constant temperature the ΔG2 of the catalysed and uncatalysed and uncatalysed reaction are differentCAt constant temperature ΔG∘ of the catalysed and uncatalysed reaction ΔS (entropy change) are sameDBoth (A) and (B)The energy profile diagrams are very important tool through which, we predict lot of things, like the amount of activation energy of the catalysed and uncatalysed reaction as well as for the backward reaction and forward reaction. Thershold energy of the catalysed and uncatalysed reaction. The graphs representing the energy profile diagram for catalysed and uncatalysed reactions are given below :
The graph of the lower energy barrier is the energy profile diagram for the catalysed reaction adn of the higher barrier is the energy profile diagram of uncatalysed reaction.
From the graph, it is clear that EafandEab are the activation energy of the respectively. EafandEab are the activation energy of the catalysed forward and backward reaction respectvely
The reaction which occurs by absorption of heat is known as endothermic reaction and by release of heat is known as exothermic reaction
For exothermic reaction, ΔH is negative and for endothermic reaction, ΔH is positive
From Arrhenius equation, we know that k=Ae−Ea/RT where k is rate constant which signifies effective number of collisions. A is known as Arrehnius constant, or maximum rate constant of frequency factor which signifies maximum number of collisions with proper orientation of reacting species per mole per second.
The catalysed reaction occurs at 500 K and the uncatalysed reaction occurs at 800 K in such way so that the rate of catalysed reaction and uncatalysed reaction becomes equal as well as the catalyst lower down the energy barrier by 60 J.
Answer the following questions on the basis of above paragraph
Which of the following statement(s) is/are correct about the catalysed and uncatalysed reaction ?AFor catalysed and uncatalysed reaction, ΔH of the reaction becomes sameBAt constant temperature, equilibrium for catalysed reaction and uncatalysed remains sameCEven at constant temperatures the equilibrium constant of the catalysed and uncatalysed reactions are not sameDBoth (A) and (B)
The energy profile diagrams are very important tool through which, we predict lot of things, like the amount of activation energy of the catalysed and uncatalysed reaction as well as for the backward reaction and forward reaction. Thershold energy of the catalysed and uncatalysed reaction. The graphs representing the energy profile diagram for catalysed and uncatalysed reactions are given below :
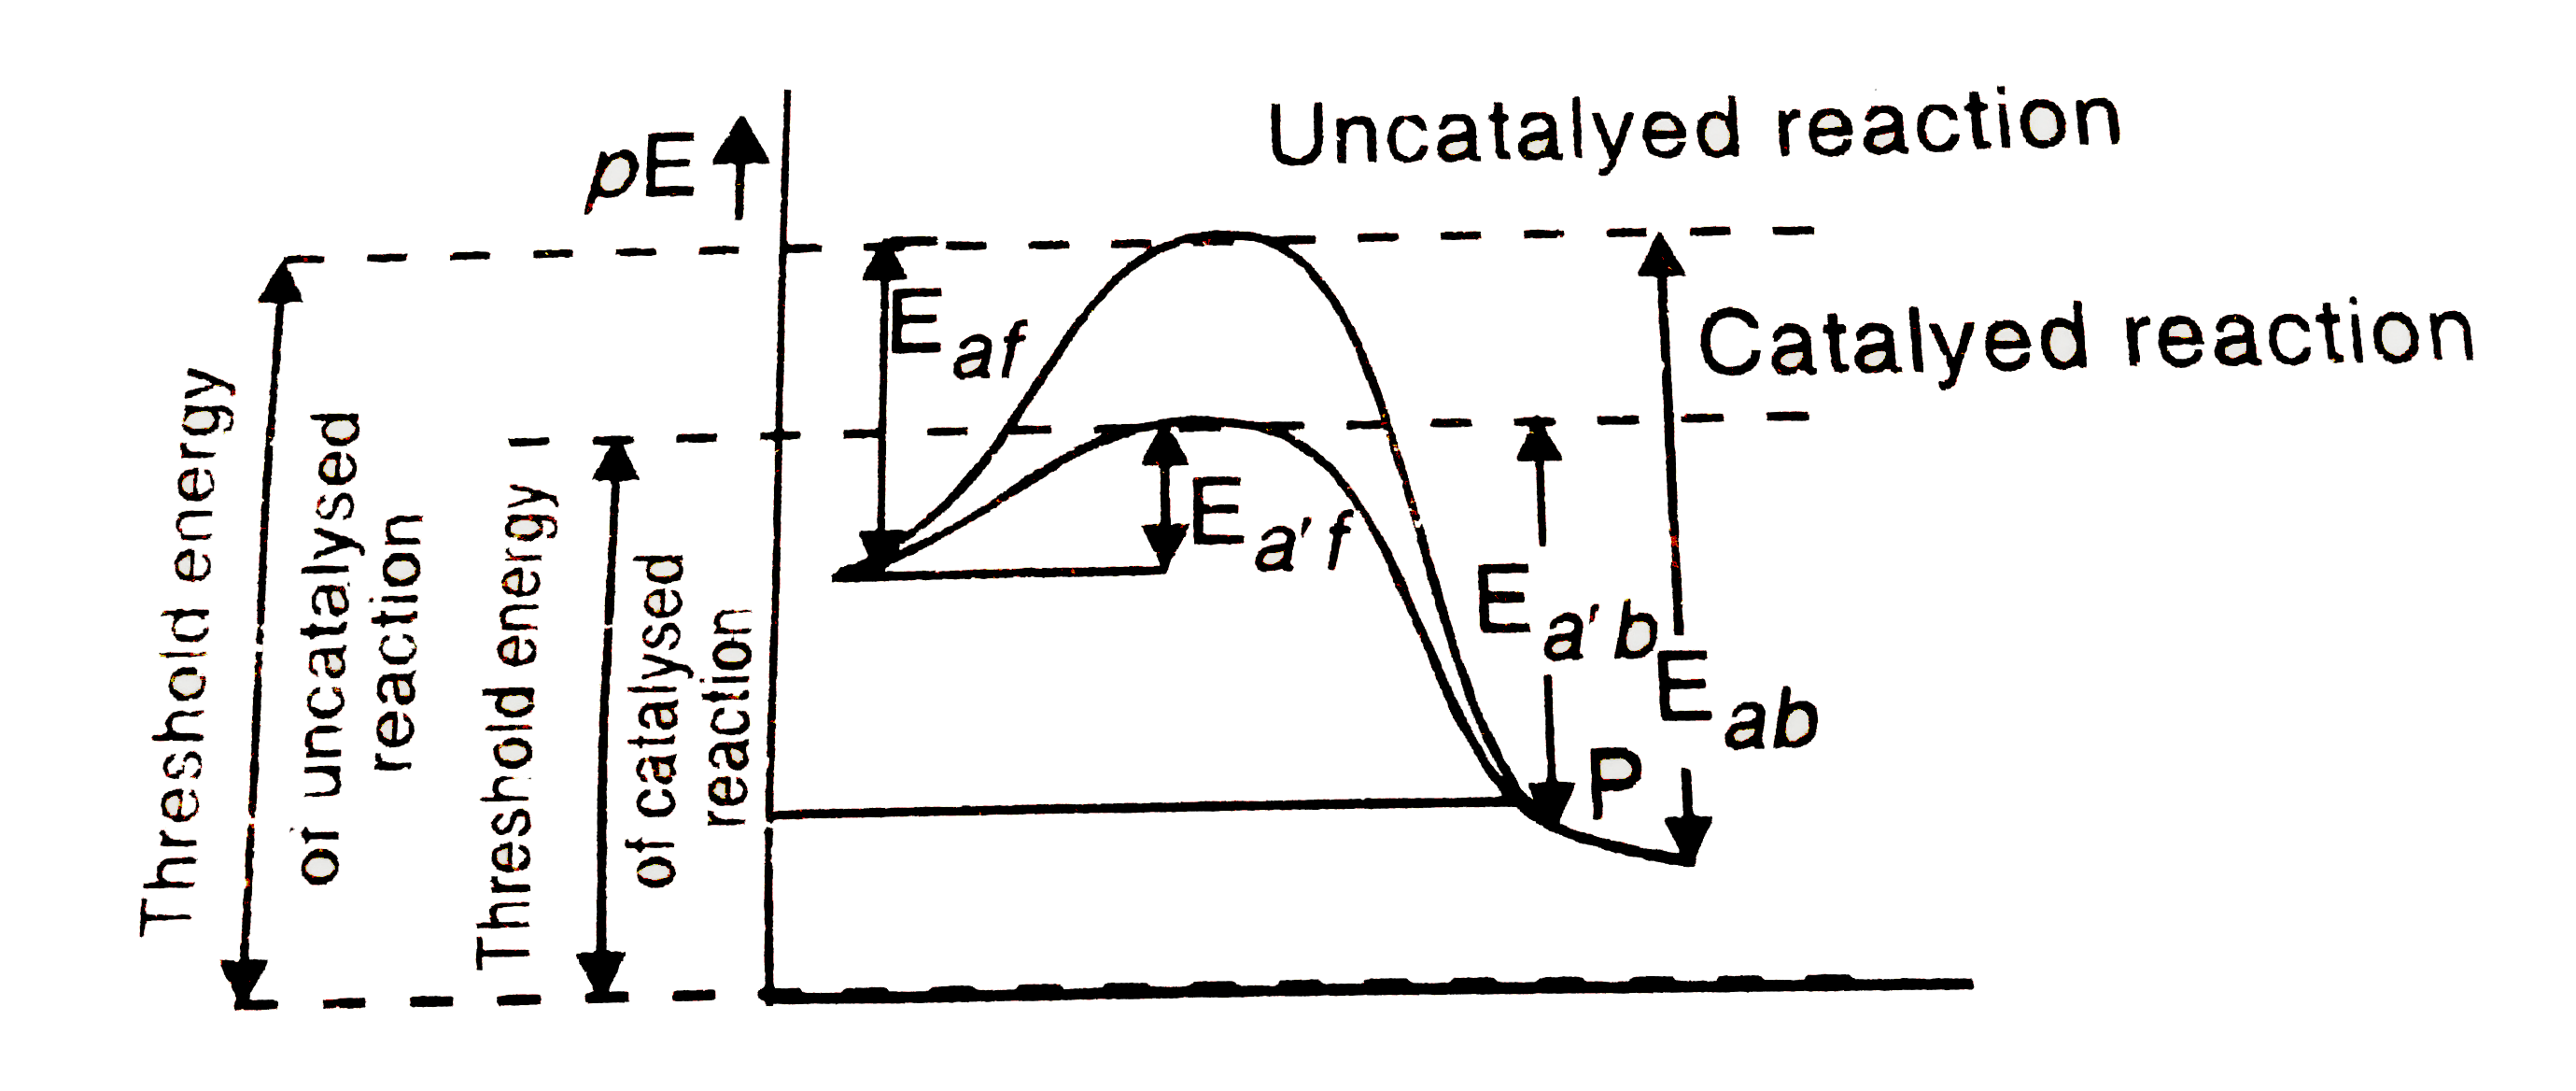
The graph of the lower energy barrier is the energy profile diagram for the catalysed reaction adn of the higher barrier is the energy profile diagram of uncatalysed reaction.
From the graph, it is clear that EafandEab are the activation energy of the respectively. EafandEab are the activation energy of the catalysed forward and backward reaction respectvely
The reaction which occurs by absorption of heat is known as endothermic reaction and by release of heat is known as exothermic reaction
For exothermic reaction, ΔH is negative and for endothermic reaction, ΔH is positive
From Arrhenius equation, we know that k=Ae−Ea/RT where k is rate constant which signifies effective number of collisions. A is known as Arrehnius constant, or maximum rate constant of frequency factor which signifies maximum number of collisions with proper orientation of reacting species per mole per second.
The catalysed reaction occurs at 500 K and the uncatalysed reaction occurs at 800 K in such way so that the rate of catalysed reaction and uncatalysed reaction becomes equal as well as the catalyst lower down the energy barrier by 60 J.
Answer the following questions on the basis of above paragraph
On the basis of question no. 4, what will be the value of threshold energy of the uncatalysed reaction ?
View SolutionThe energy profile diagrams are very important tool through which, we predict lot of things, like the amount of activation energy of the catalysed and uncatalysed reaction as well as for the backward reaction and forward reaction. Thershold energy of the catalysed and uncatalysed reaction. The graphs representing the energy profile diagram for catalysed and uncatalysed reactions are given below :
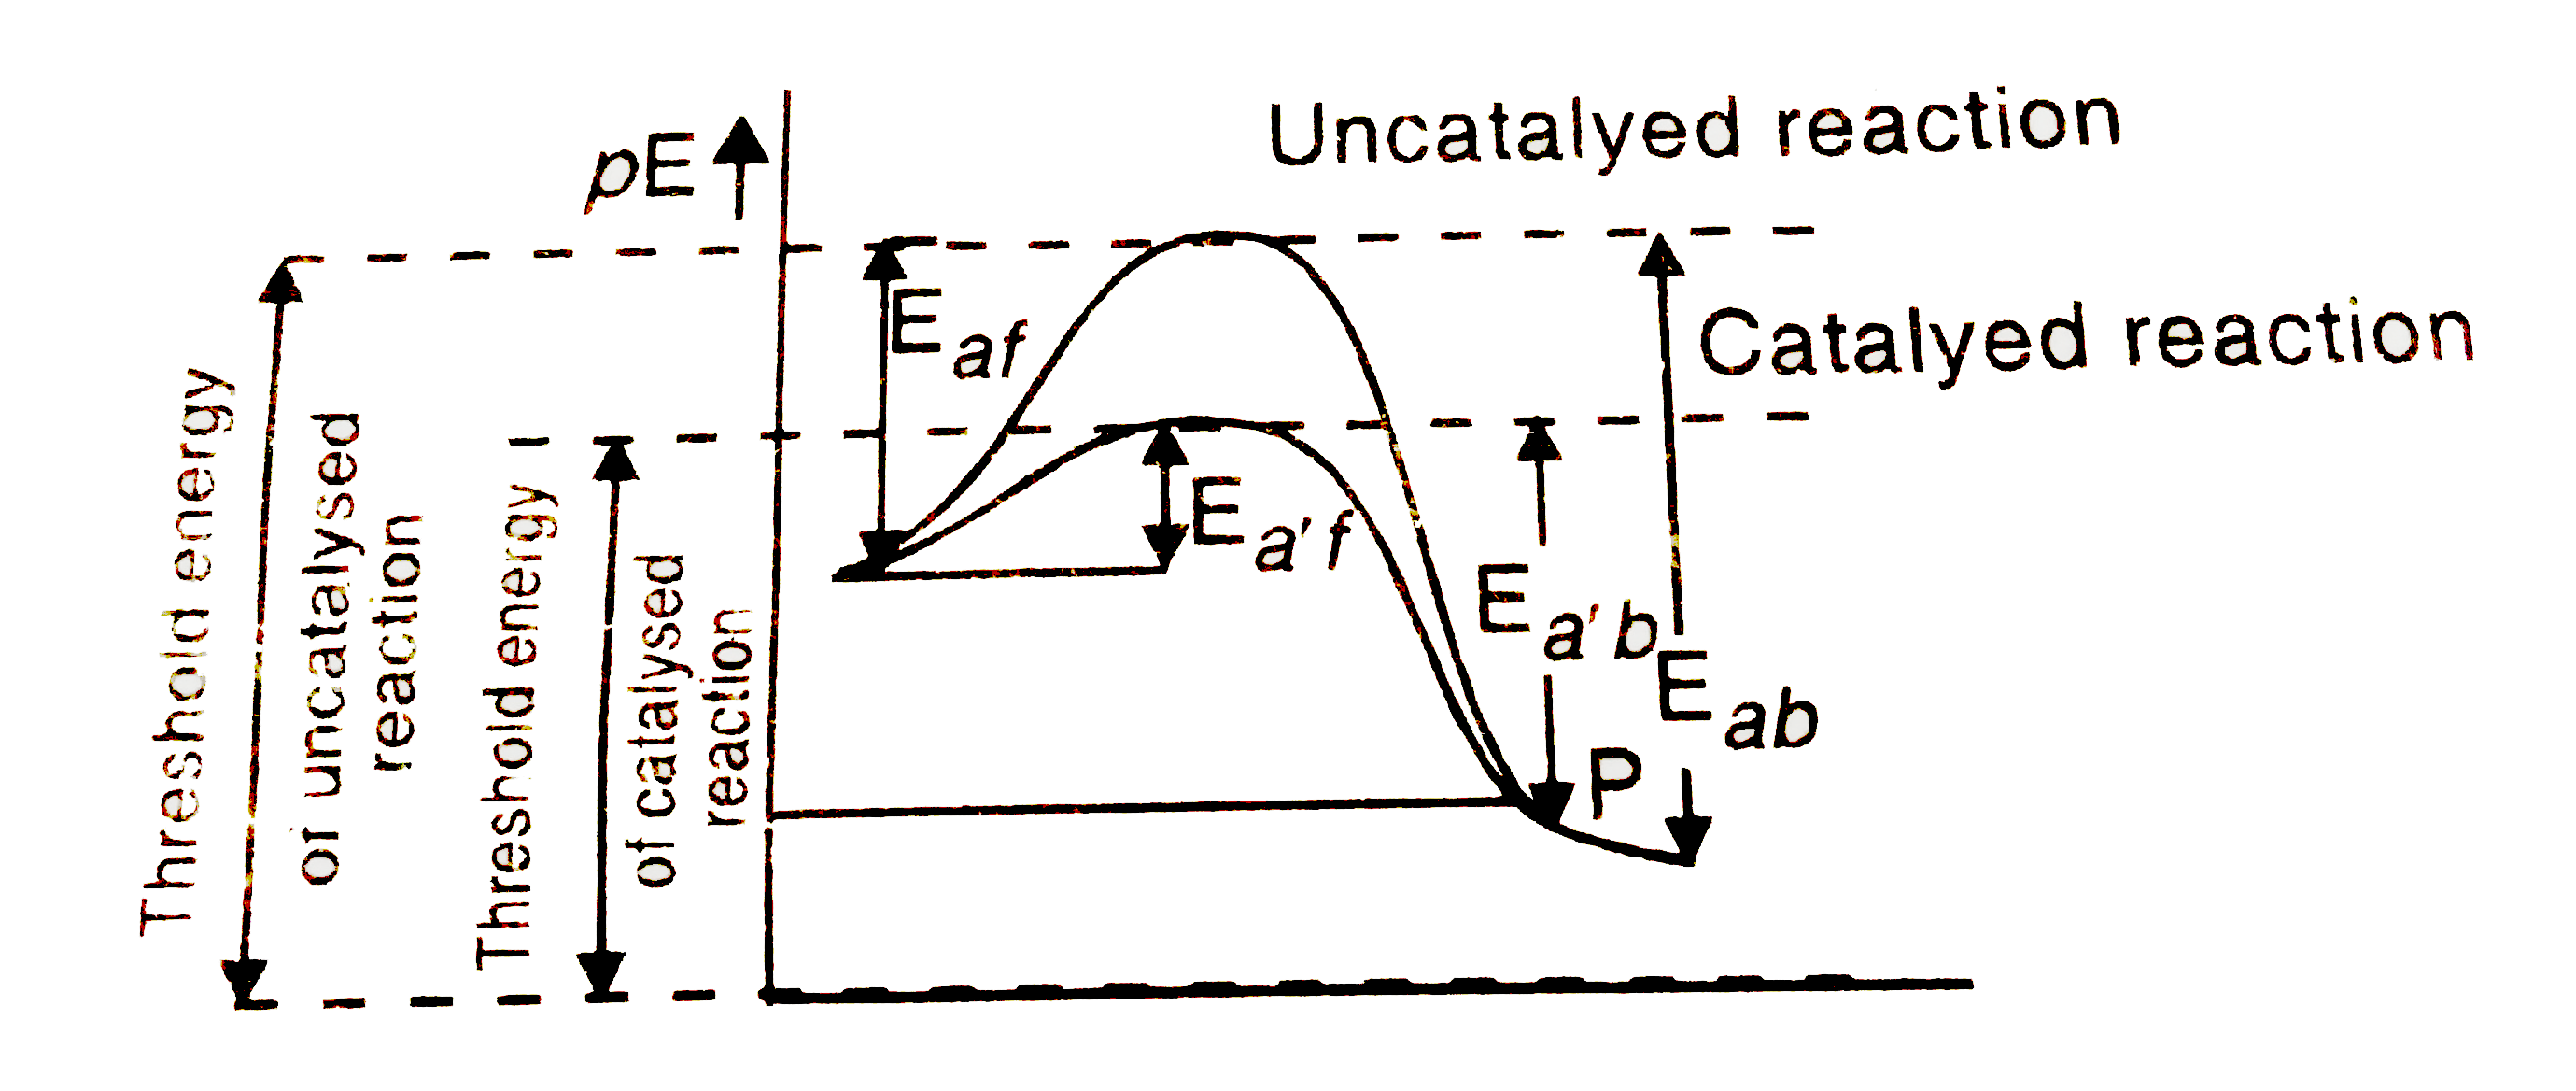
The graph of the lower energy barrier is the energy profile diagram for the catalysed reaction adn of the higher barrier is the energy profile diagram of uncatalysed reaction.
From the graph, it is clear that EafandEab are the activation energy of the respectively. EafandEab are the activation energy of the catalysed forward and backward reaction respectvely
The reaction which occurs by absorption of heat is known as endothermic reaction and by release of heat is known as exothermic reaction
For exothermic reaction, ΔH is negative and for endothermic reaction, ΔH is positive
From Arrhenius equation, we know that k=Ae−Ea/RT where k is rate constant which signifies effective number of collisions. A is known as Arrehnius constant, or maximum rate constant of frequency factor which signifies maximum number of collisions with proper orientation of reacting species per mole per second.
The catalysed reaction occurs at 500 K and the uncatalysed reaction occurs at 800 K in such way so that the rate of catalysed reaction and uncatalysed reaction becomes equal as well as the catalyst lower down the energy barrier by 60 J.
Answer the following questions on the basis of above paragraph
On the basis of question no. 4 what will be the value of threshold energy of the catalysed reactions ?
View SolutionThe energy profile diagrams are very important tool through which, we predict lot of things, like the amount of activation energy of the catalysed and uncatalysed reaction as well as for the backward reaction and forward reaction. Thershold energy of the catalysed and uncatalysed reaction. The graphs representing the energy profile diagram for catalysed and uncatalysed reactions are given below :
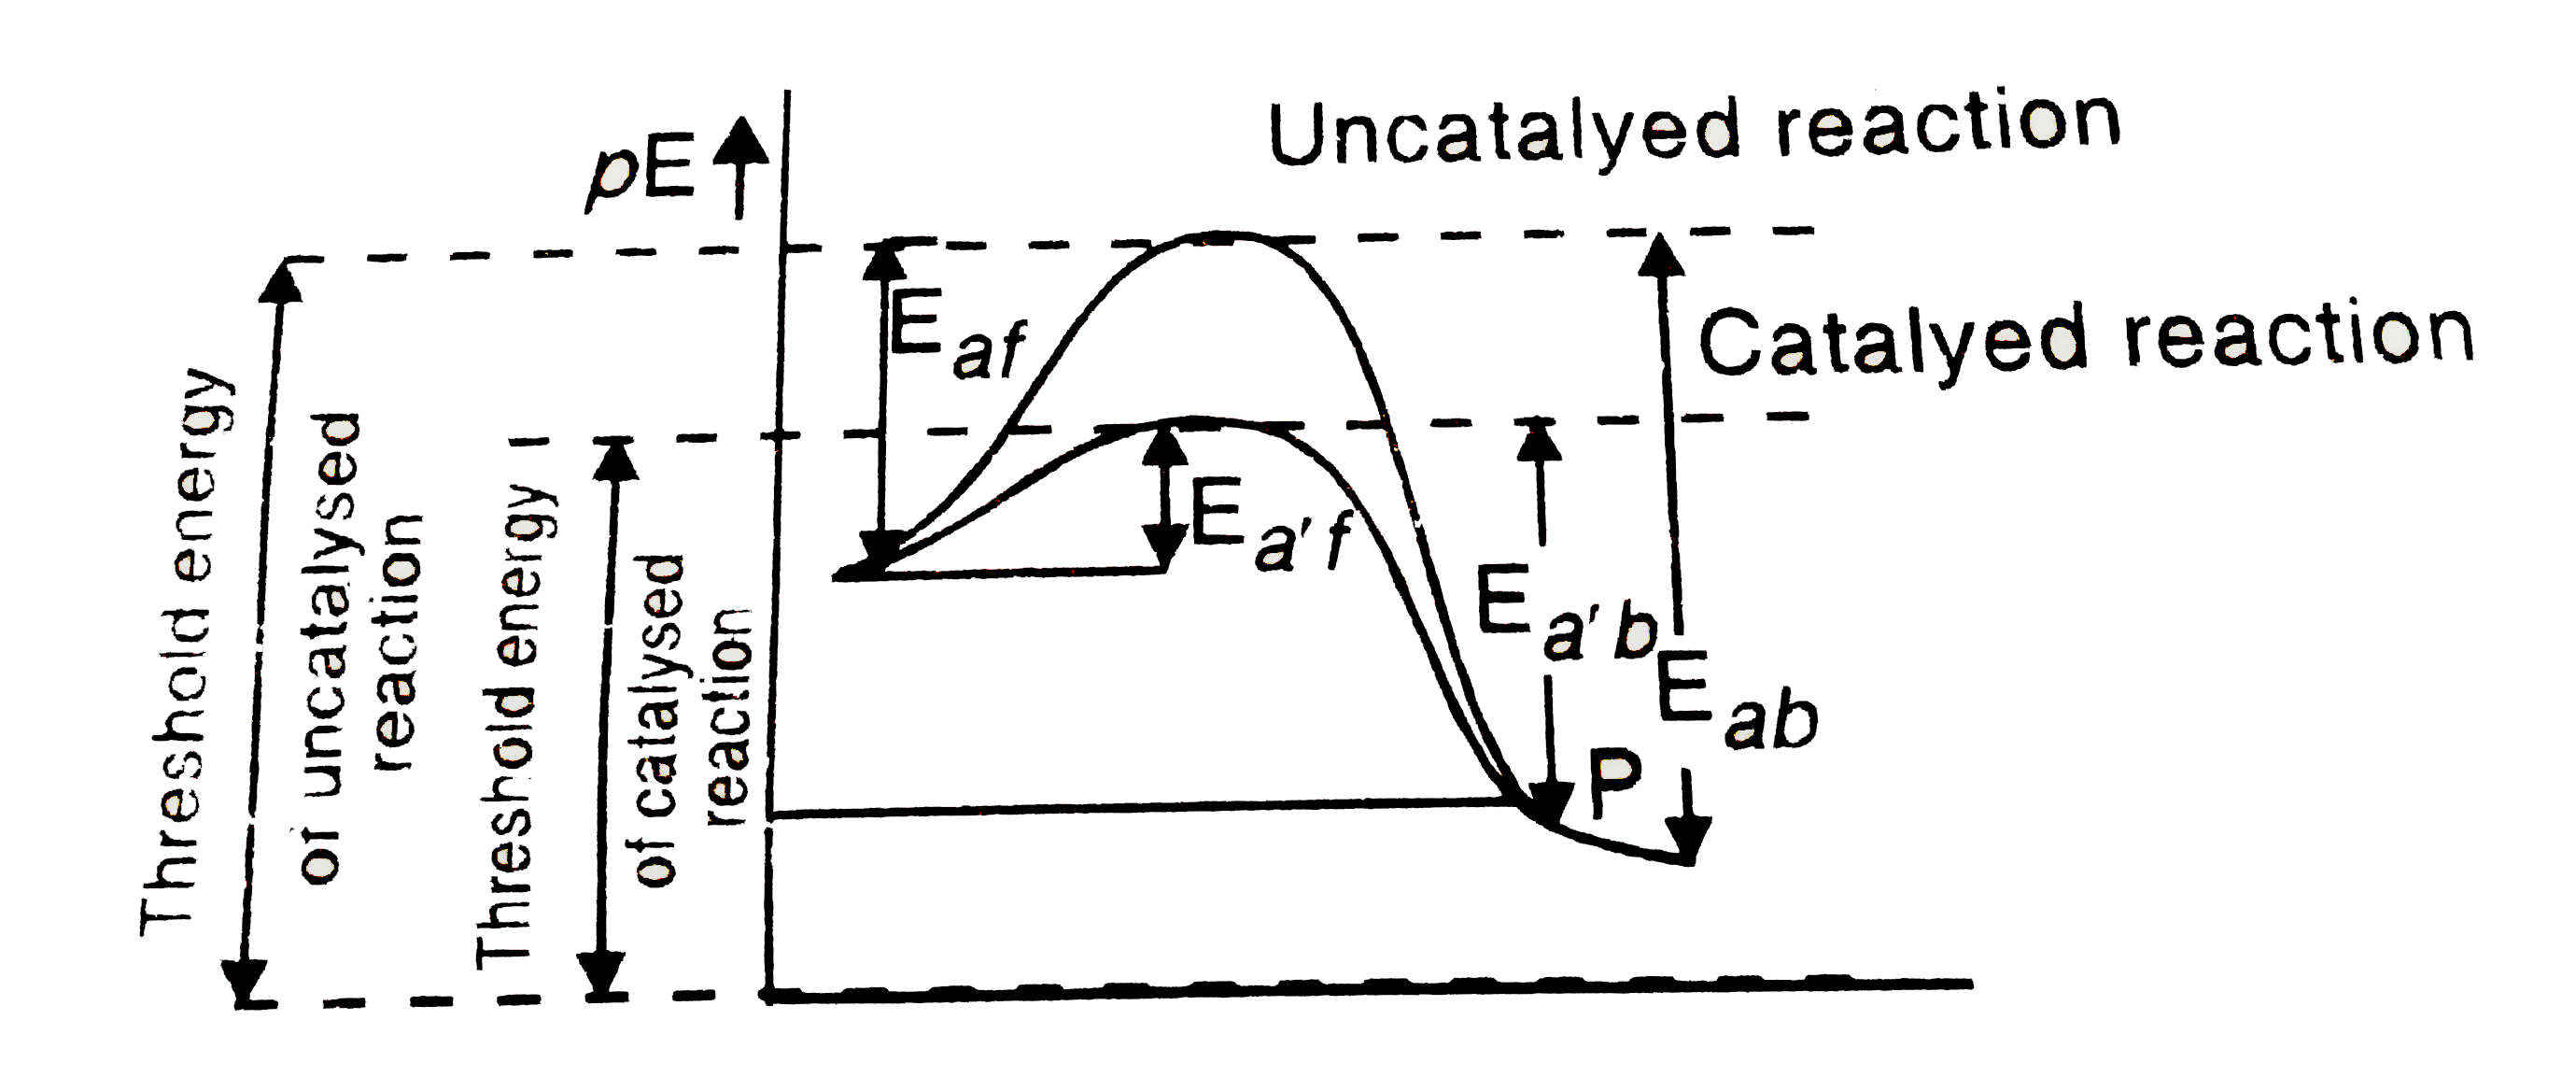
The graph of the lower energy barrier is the energy profile diagram for the catalysed reaction adn of the higher barrier is the energy profile diagram of uncatalysed reaction.
From the graph, it is clear that EafandEab are the activation energy of the respectively. EafandEab are the activation energy of the catalysed forward and backward reaction respectvely
The reaction which occurs by absorption of heat is known as endothermic reaction and by release of heat is known as exothermic reaction
For exothermic reaction, ΔH is negative and for endothermic reaction, ΔH is positive
From Arrhenius equation, we know that k=Ae−Ea/RT where k is rate constant which signifies effective number of collisions. A is known as Arrehnius constant, or maximum rate constant of frequency factor which signifies maximum number of collisions with proper orientation of reacting species per mole per second.
The catalysed reaction occurs at 500 K and the uncatalysed reaction occurs at 800 K in such way so that the rate of catalysed reaction and uncatalysed reaction becomes equal as well as the catalyst lower down the energy barrier by 60 J.
Answer the following questions on the basis of above paragraph
From the given above information what will be the threshold energy for the uncatalysed reaction, if the normal energy of the reactant is 40 J.
View SolutionThe energy profile diagrams are very important tool through which, we predict lot of things, like the amount of activation energy of the catalysed and uncatalysed reaction as well as for the backward reaction and forward reaction. Thershold energy of the catalysed and uncatalysed reaction. The graphs representing the energy profile diagram for catalysed and uncatalysed reactions are given below :
The graph of the lower energy barrier is the energy profile diagram for the catalysed reaction adn of the higher barrier is the energy profile diagram of uncatalysed reaction.
From the graph, it is clear that EafandEab are the activation energy of the respectively. EafandEab are the activation energy of the catalysed forward and backward reaction respectvely
The reaction which occurs by absorption of heat is known as endothermic reaction and by release of heat is known as exothermic reaction
For exothermic reaction, ΔH is negative and for endothermic reaction, ΔH is positive
From Arrhenius equation, we know that k=Ae−Ea/RT where k is rate constant which signifies effective number of collisions. A is known as Arrehnius constant, or maximum rate constant of frequency factor which signifies maximum number of collisions with proper orientation of reacting species per mole per second.
The catalysed reaction occurs at 500 K and the uncatalysed reaction occurs at 800 K in such way so that the rate of catalysed reaction and uncatalysed reaction becomes equal as well as the catalyst lower down the energy barrier by 60 J.
Answer the following questions on the basis of above paragraph
From the above information givenin comprehension as well as from question no. 4, what will be the value of activation energy of the calalysed backward reaction ?
View SolutionThe energy profile diagrams are very important tool through which, we predict lot of things, like the amount of activation energy of the catalysed and uncatalysed reaction as well as for the backward reaction and forward reaction. Thershold energy of the catalysed and uncatalysed reaction. The graphs representing the energy profile diagram for catalysed and uncatalysed reactions are given below :
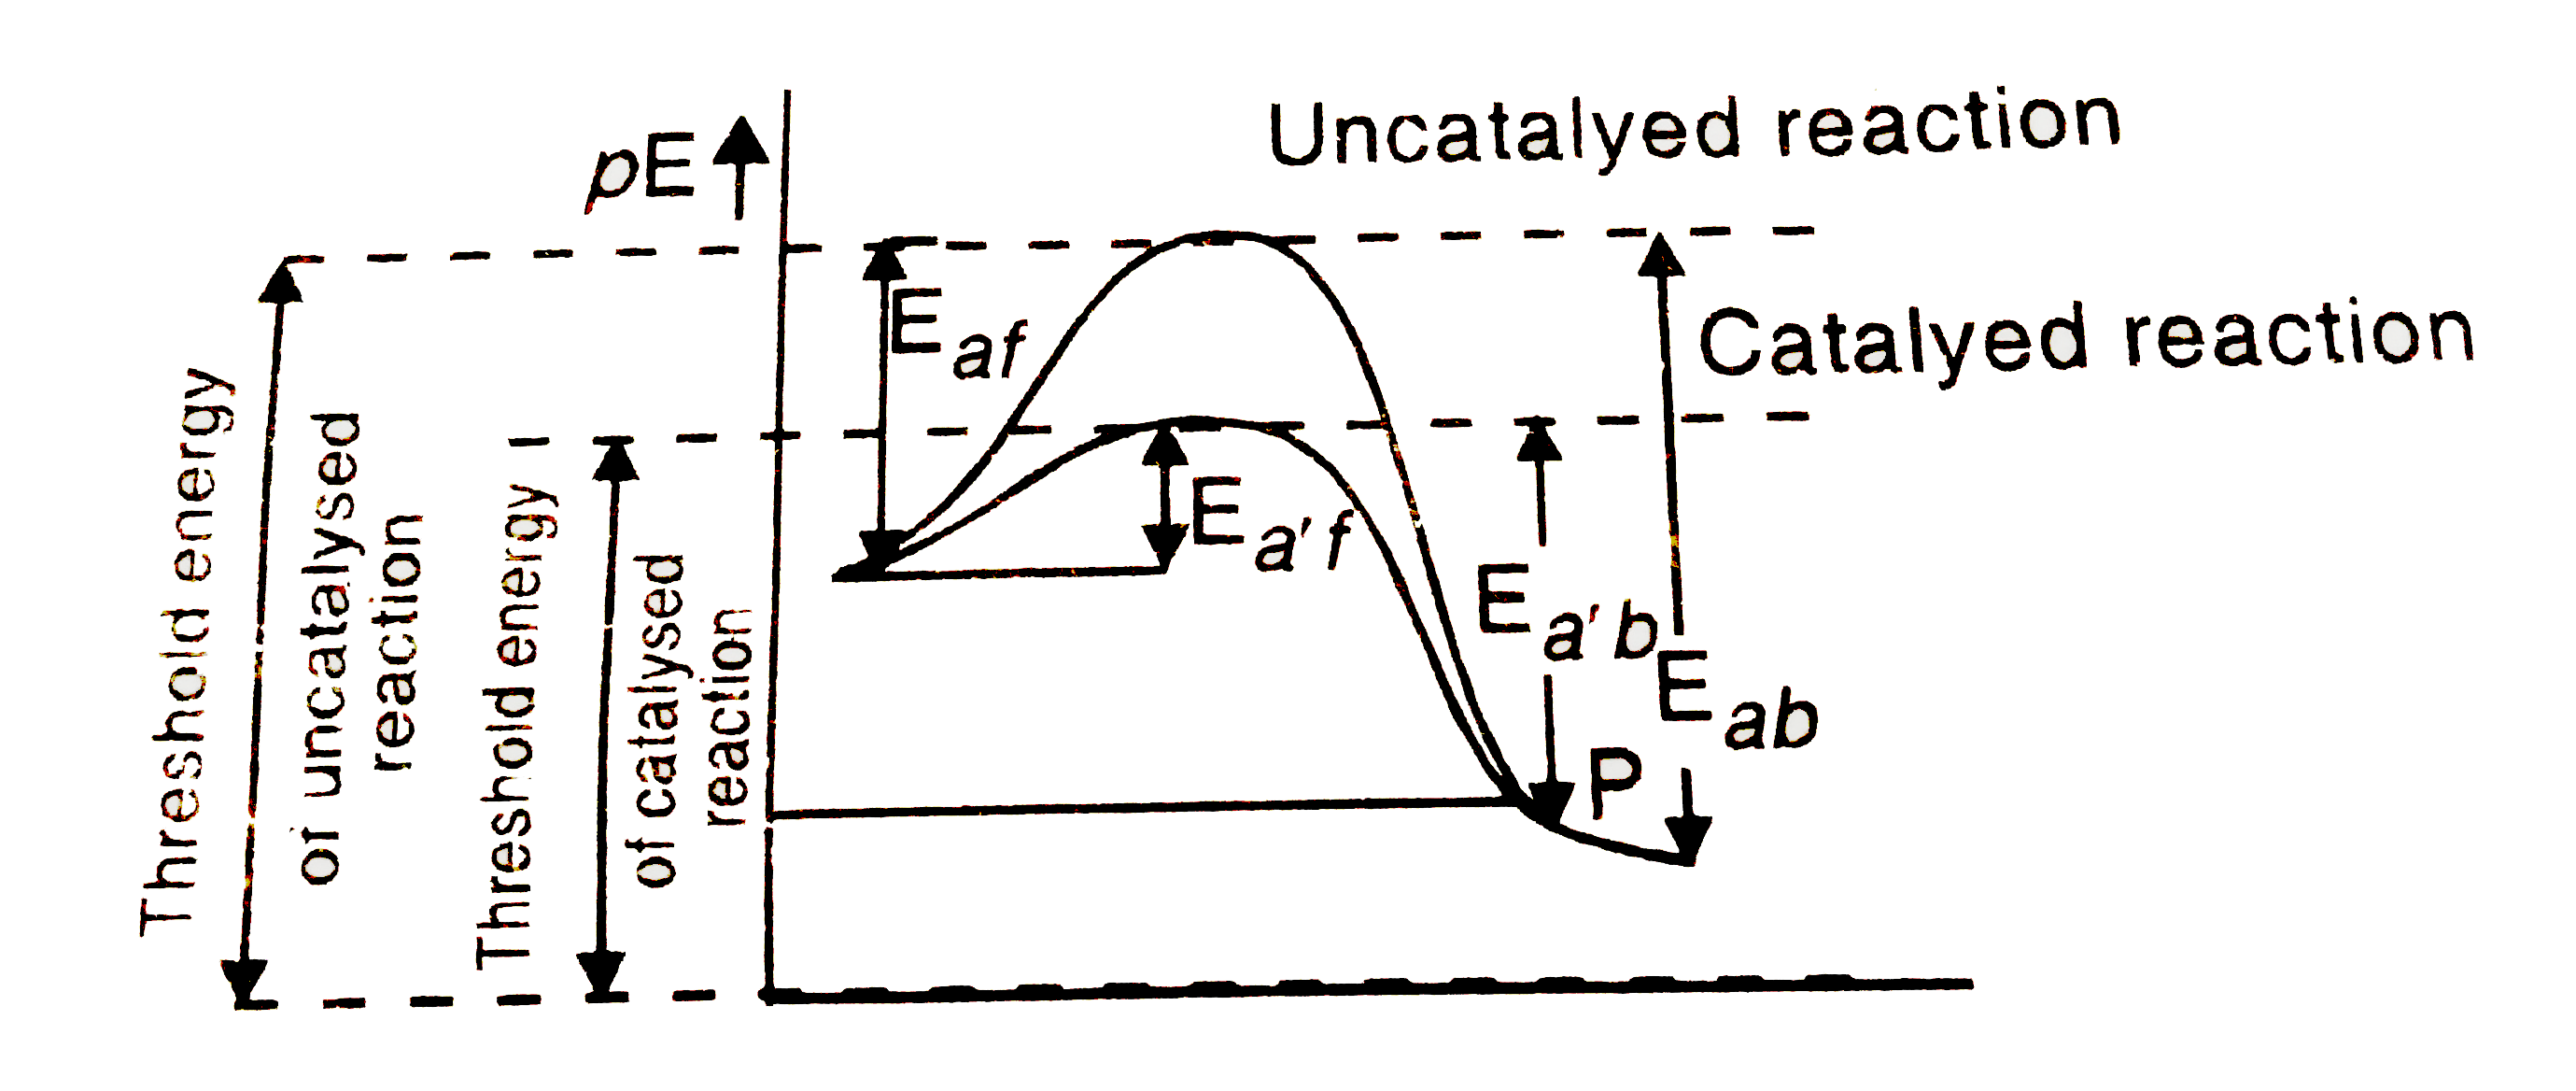
The graph of the lower energy barrier is the energy profile diagram for the catalysed reaction adn of the higher barrier is the energy profile diagram of uncatalysed reaction.
From the graph, it is clear that EafandEab are the activation energy of the respectively. EafandEab are the activation energy of the catalysed forward and backward reaction respectvely
The reaction which occurs by absorption of heat is known as endothermic reaction and by release of heat is known as exothermic reaction
For exothermic reaction, ΔH is negative and for endothermic reaction, ΔH is positive
From Arrhenius equation, we know that k=Ae−Ea/RT where k is rate constant which signifies effective number of collisions. A is known as Arrehnius constant, or maximum rate constant of frequency factor which signifies maximum number of collisions with proper orientation of reacting species per mole per second.
The catalysed reaction occurs at 500 K and the uncatalysed reaction occurs at 800 K in such way so that the rate of catalysed reaction and uncatalysed reaction becomes equal as well as the catalyst lower down the energy barrier by 60 J.
Answer the following questions on the basis of above paragraph
From the above information given inthe compreshension, if the normal energy of the reactant is 50 J and that of the product is 20 J. then what will be the activation energy of the uncatalysed backward reaction ?
View Solution
