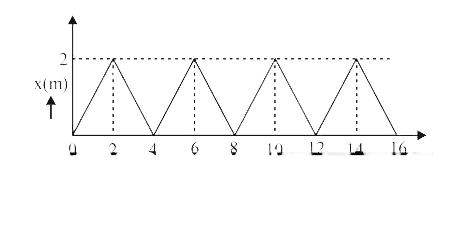
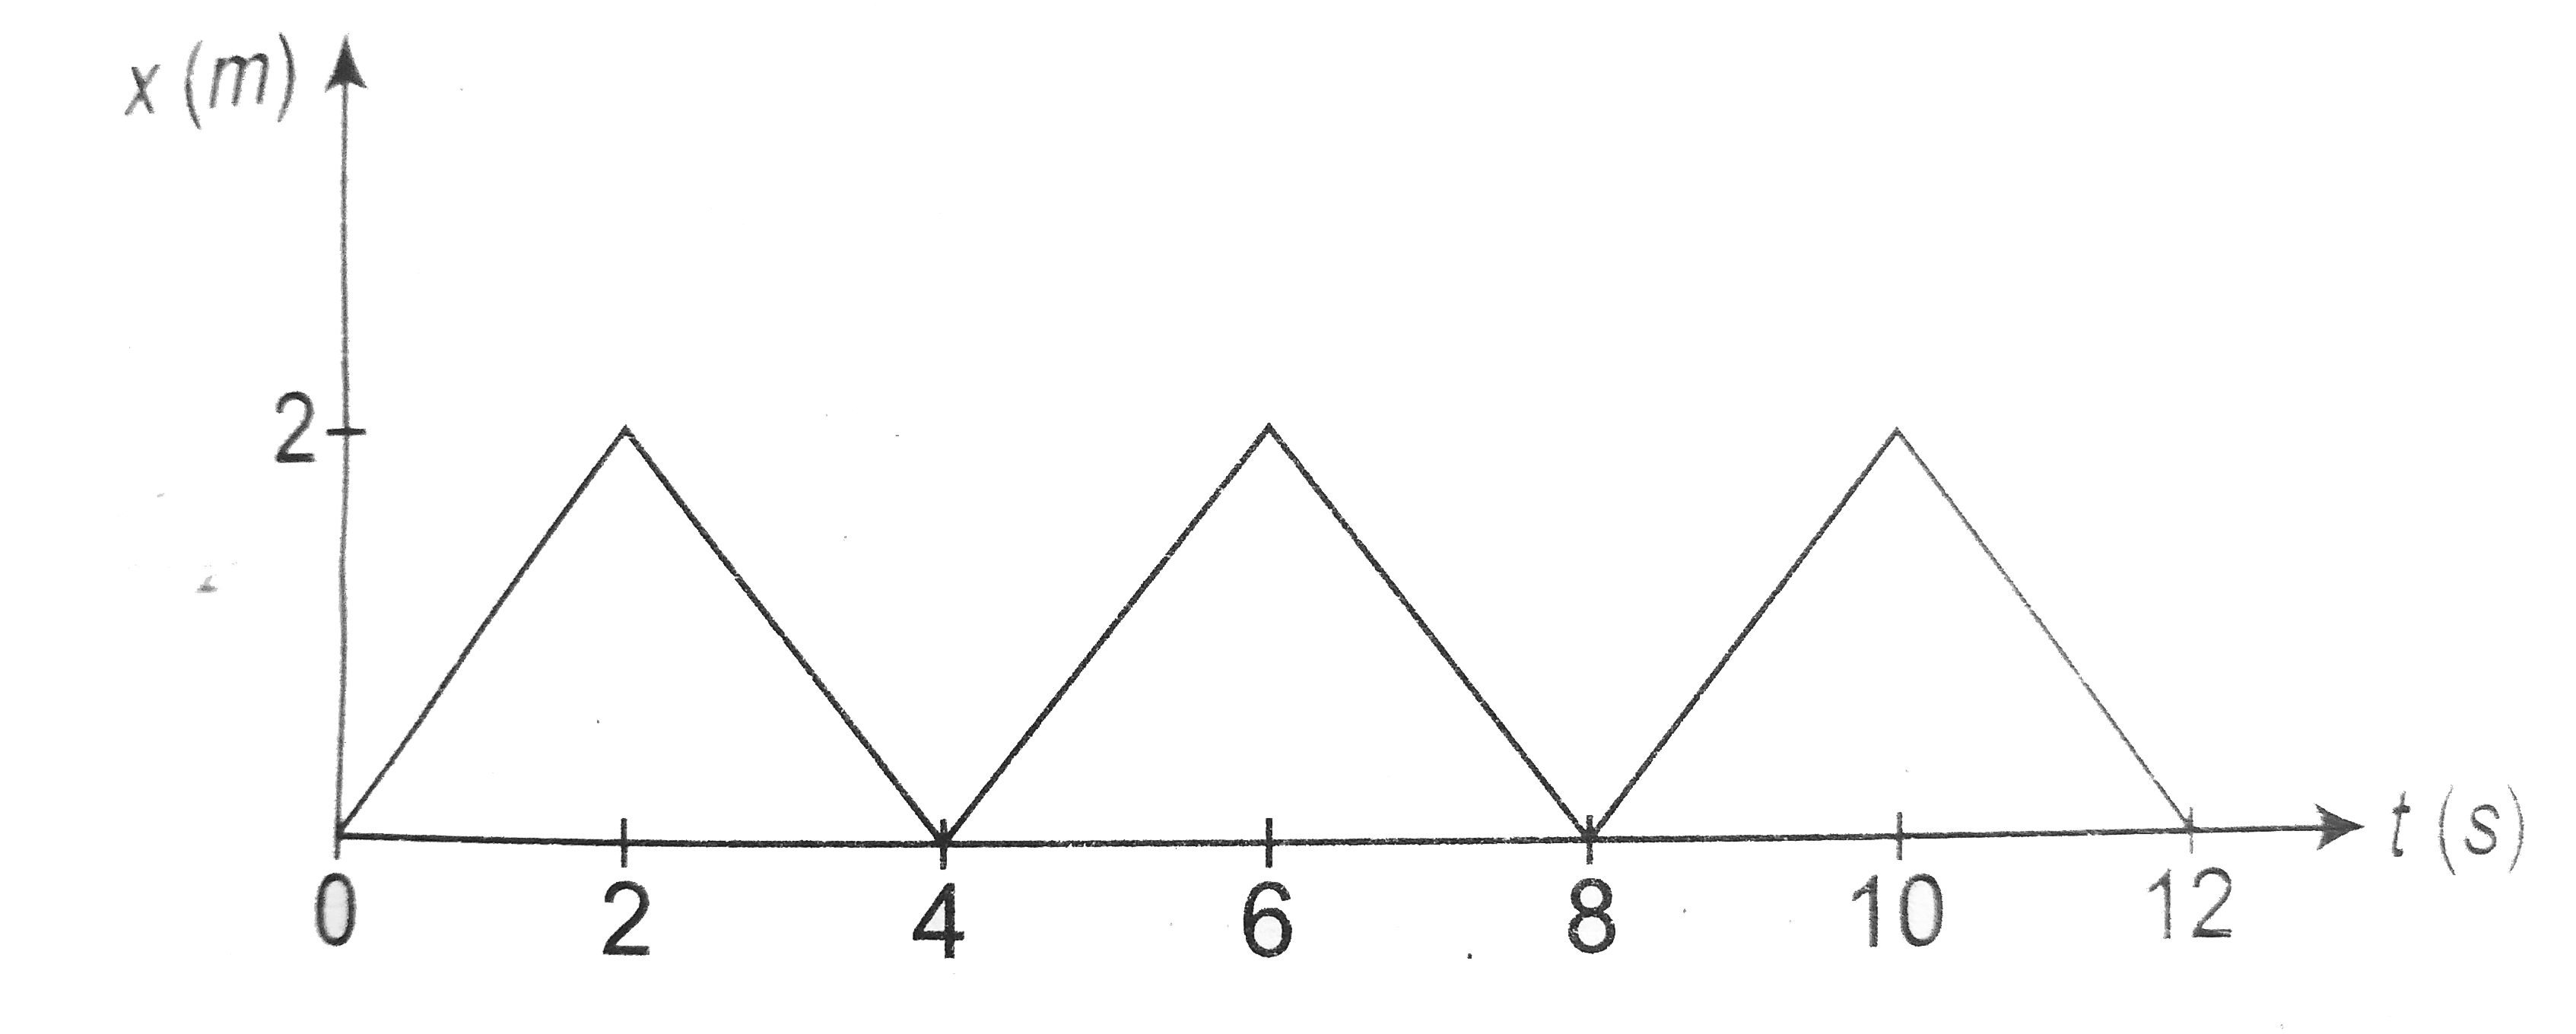
The figure shows the position – time (x – t) graph of one – dimensional motion of a body of mass 0.4 kg. The magnitude of each impulse is:
0.4 Ns
0.8 Ns
1.6 Ns
0.2 Ns
The correct Answer is:B
Here, mass of the body, m = 0.4 kg
Since position – time (x – t) graph is a straight line, so motion is uniform. Because of impulse direction of velocity change as it can be seen from the slopes of the graph.
From graph,
Initial velocity , u=(2−0)(2−0)=1ms−1 Final velocity,v=(0−2)(4−2)=−1ms−1
Initial momentum, Pi=mu=0.4×1=0.4Ns
Final momentum, Pf=mv=0.4(−1)=−0.8Ns
|Impulse | = 0.8 Ns.
Similar Questions
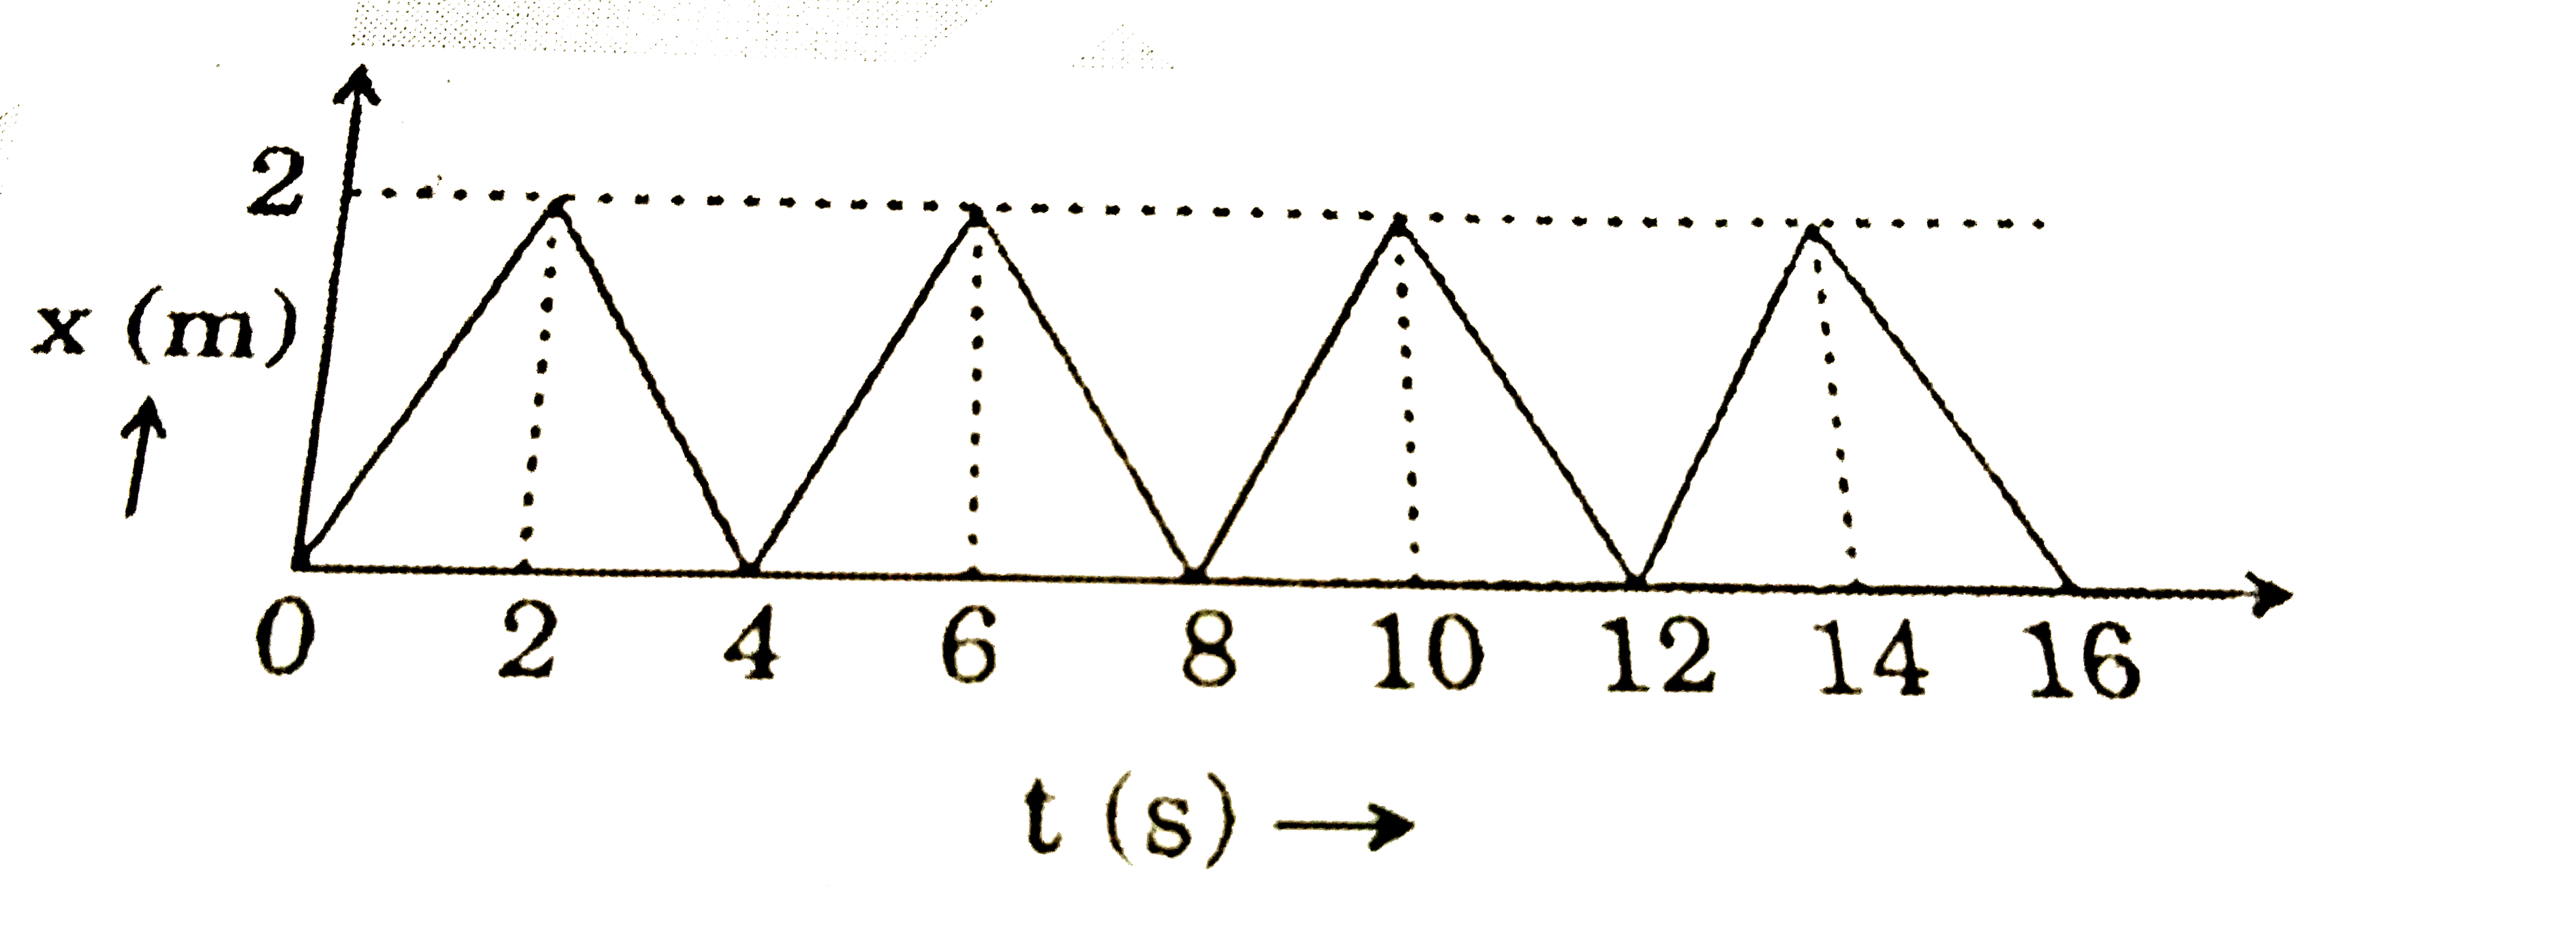
The figure shows the position - time (x - t) graph of one-dimensional motion of a body of mass 0.4 kg. The magnetic of each impulse is
 View Solution
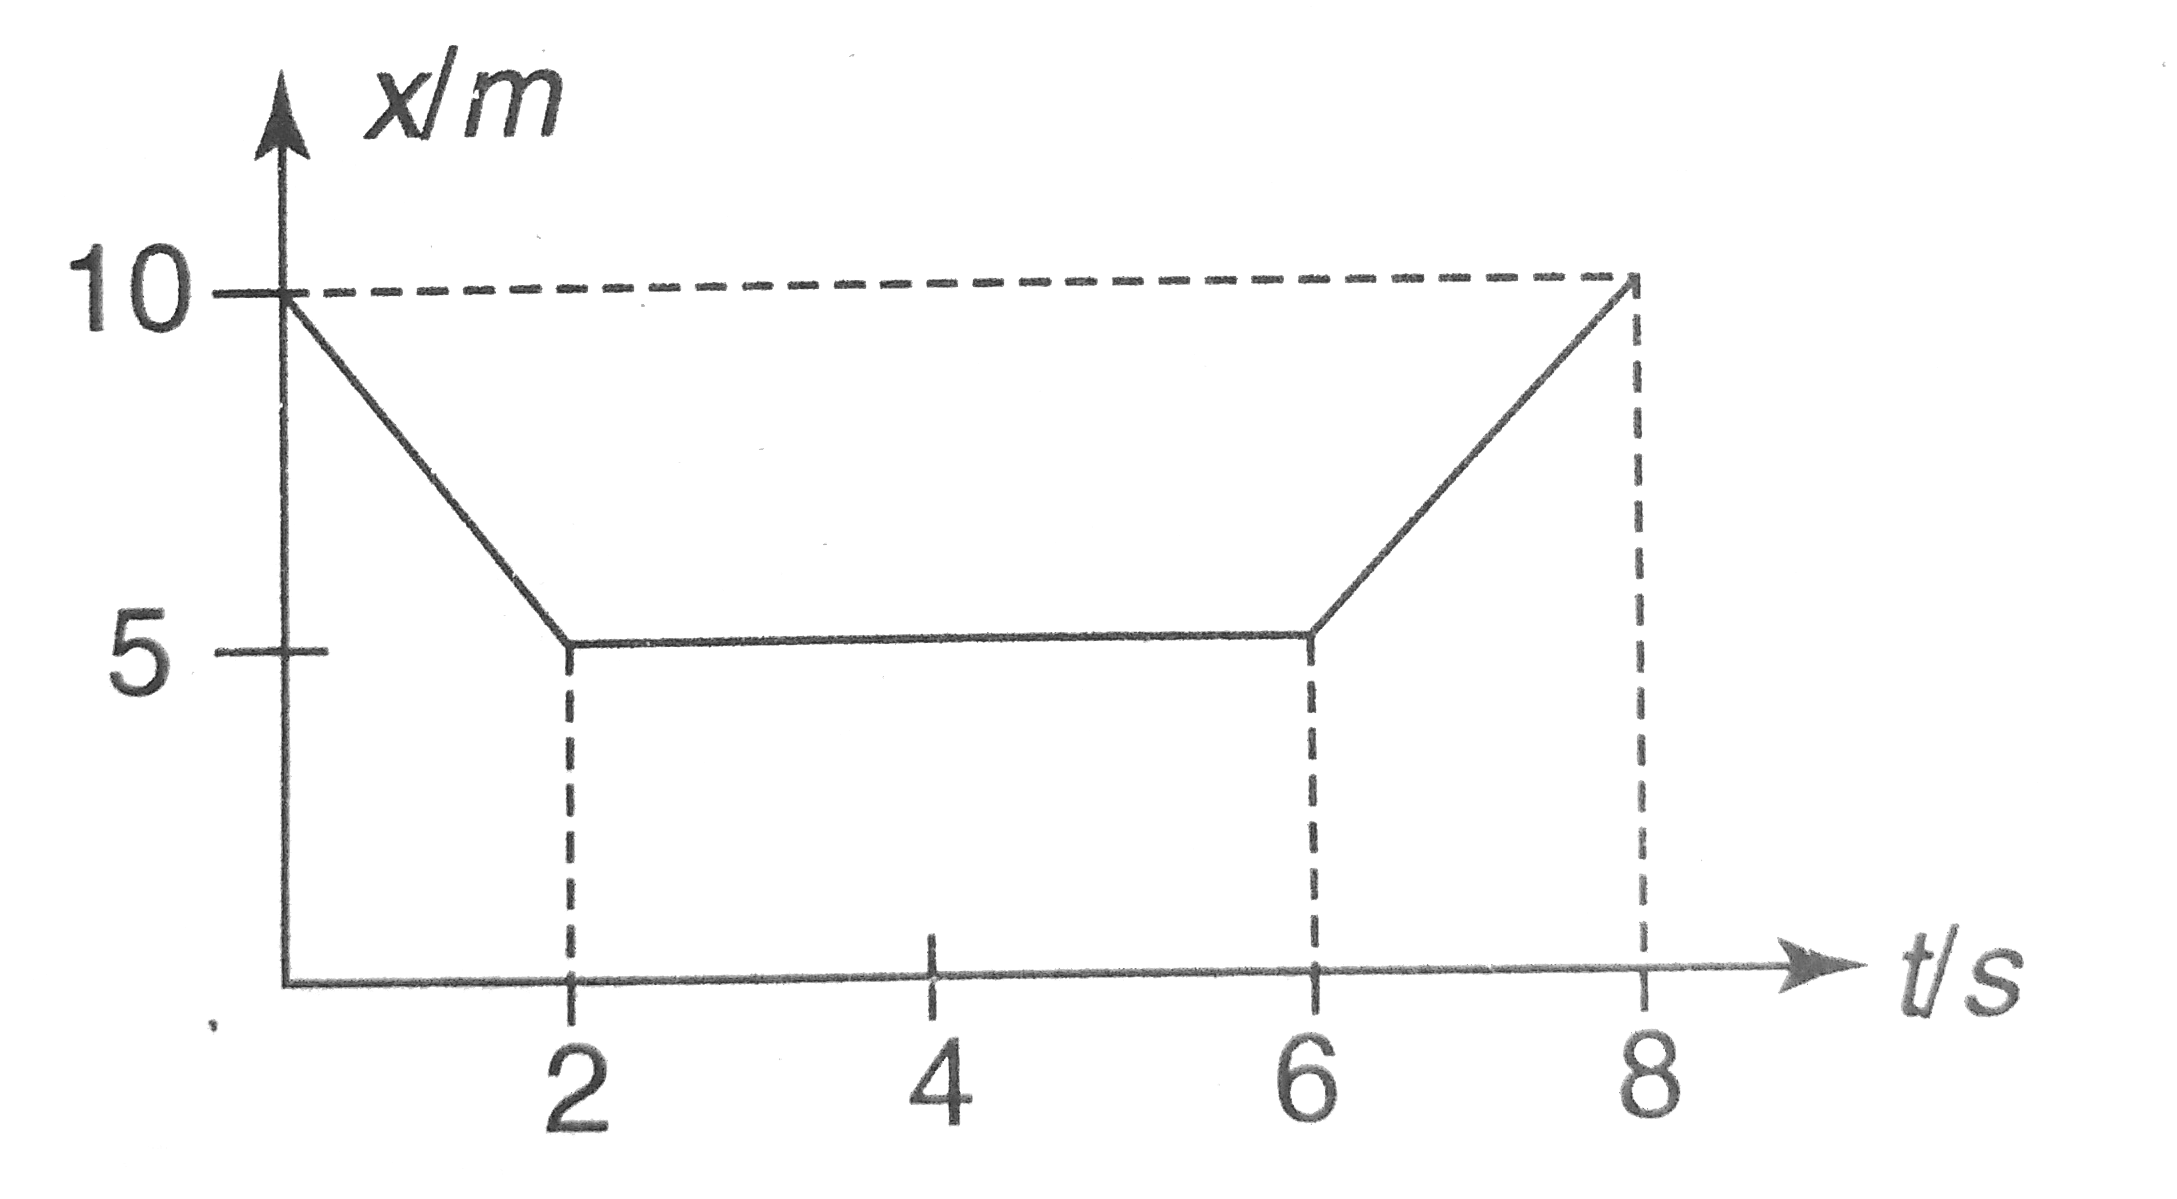
Figure shows the position time graph for a particle in one dimensional motion. What is the displacement of the particle in first 4 seconds ?
 View Solution
Knowledge Check
- Question 1 - Select One
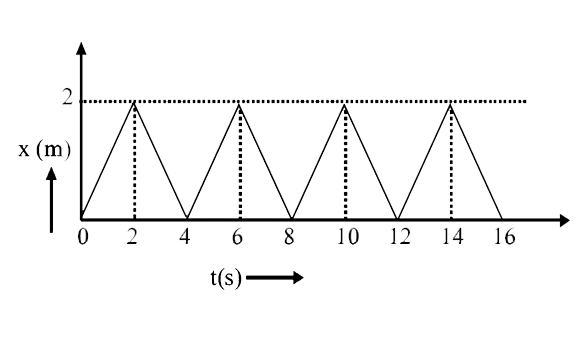
The figure shows the position-time (x-t) graph of one-dimensional motion of a body of mass 0.4kg. The magnitude of each impulse is
 A0.4NsB0.8NsC1.6NsD0.2Ns
 - Question 2 - Select One
Figure shows the position-time (x-t) graph of one dimensional motion of a mass 500g. What is the time interval between two consecutive impulses received by the body?
 A2sB4sC6sD8s
 - Question 3 - Select One or More
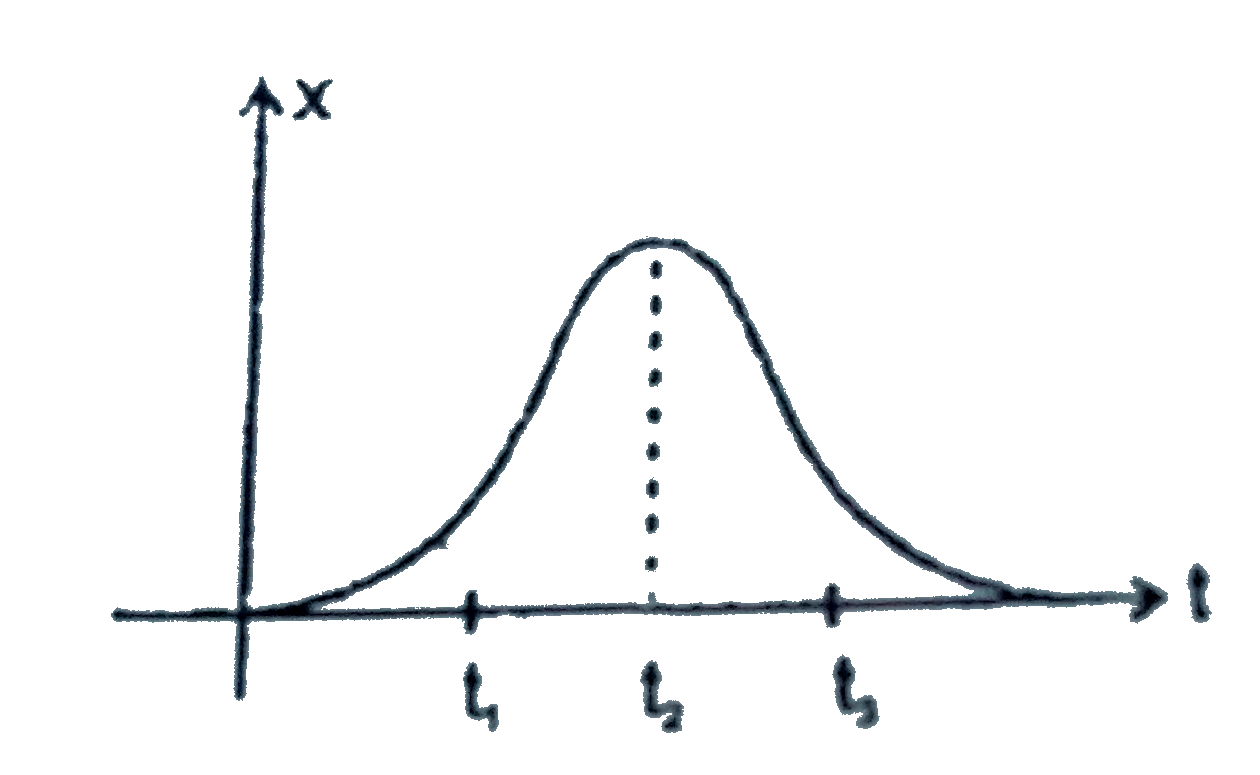
Given figure shows position-time curve during one dimentional motion of body. Select correct statements.AAt t1,vx and ax are in same direction.BAt t2,vx and ax are in same direction.CAt t1,vx and ax are in opposite direction.DAt t2,vx and ax are in opposite direction.
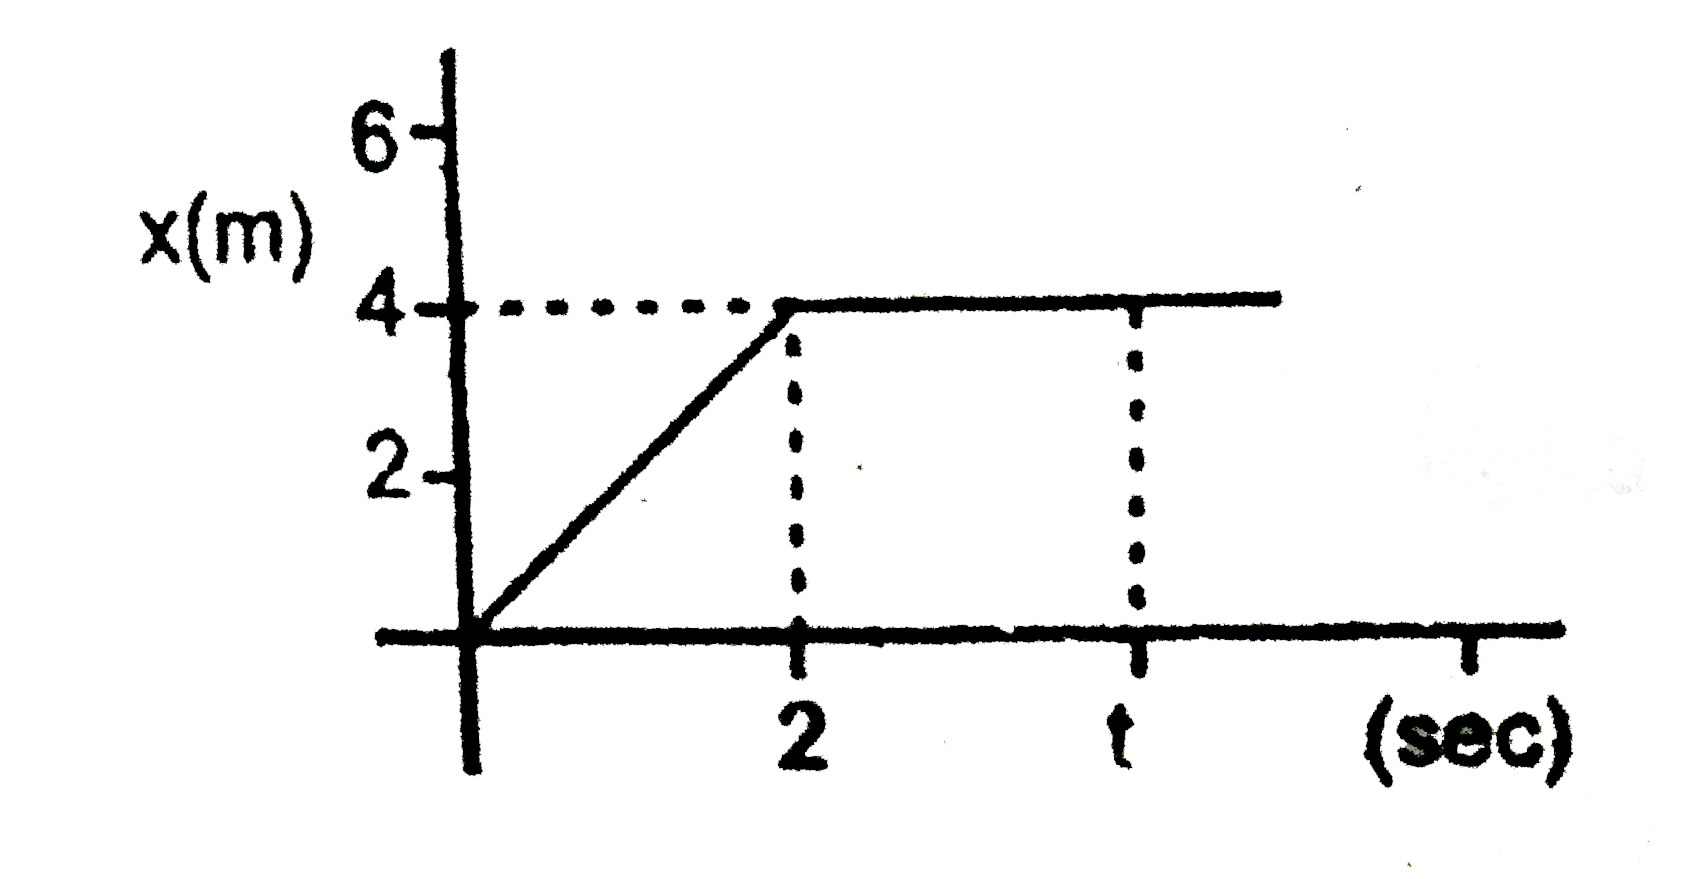
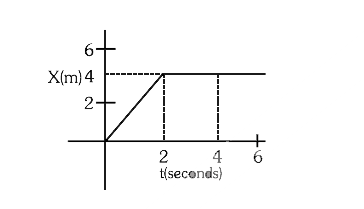
In the figure given below, the position time graph of a particle of mass 0.1kg is shown. The impulse at t=2 sec is
 View Solution
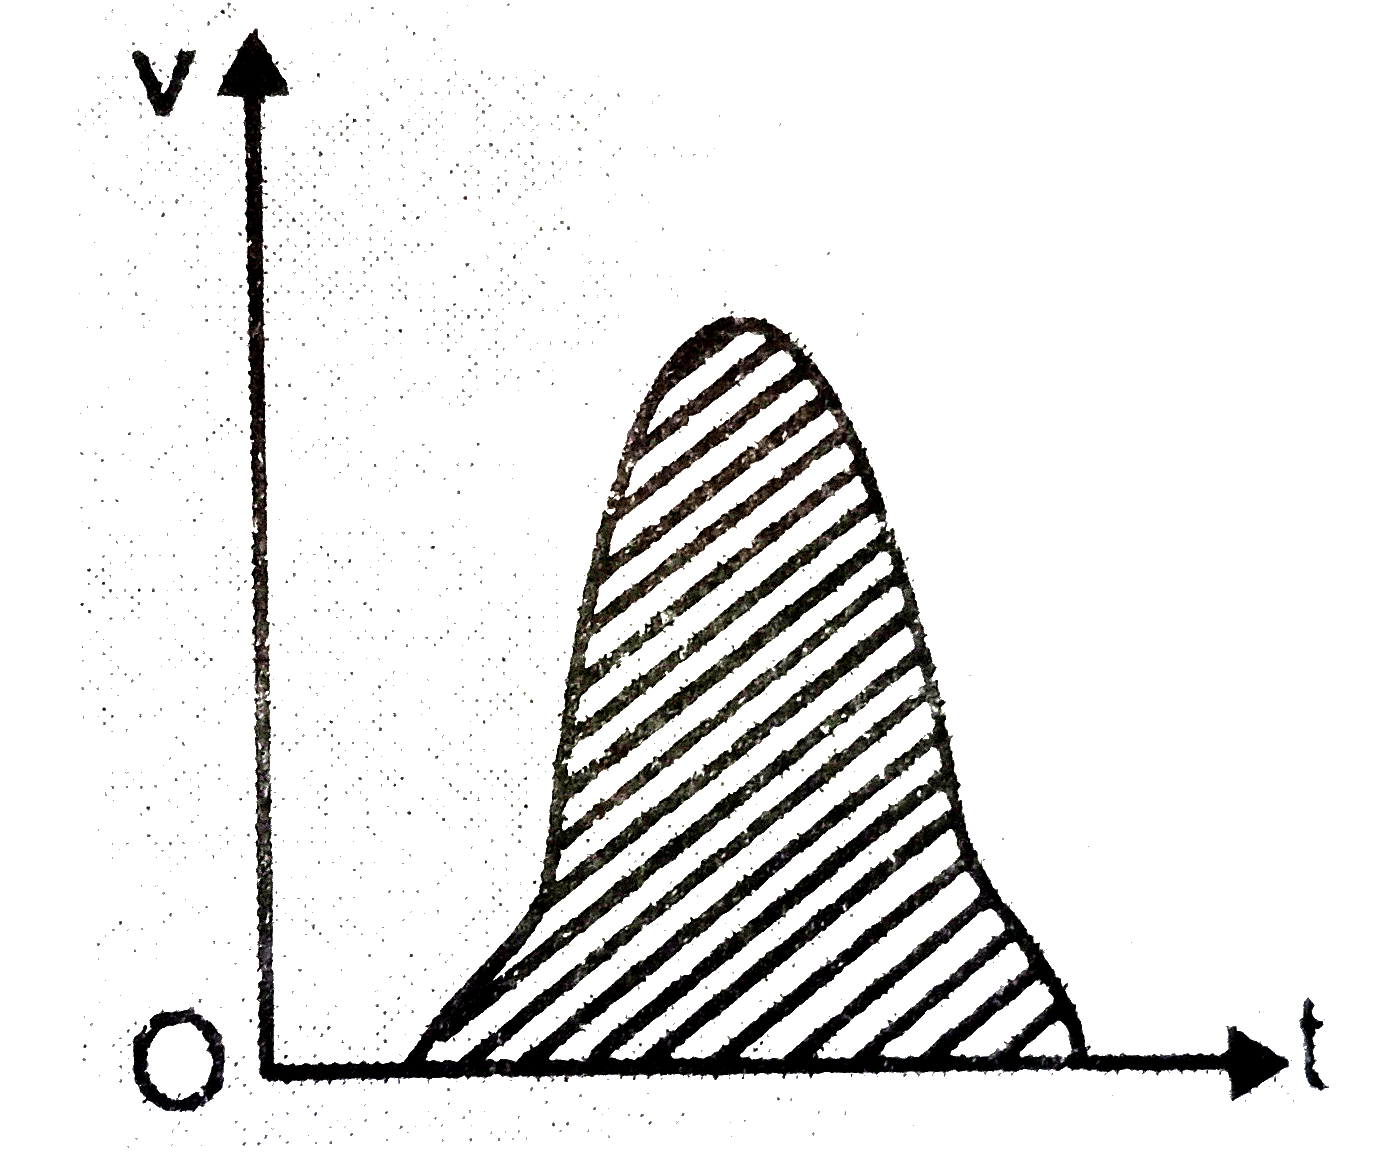
Figure below shows the velocity-time graph of a one dimensional motion. Which of the following characteristic of the particle is represented by the shaded area?
 View Solution
In the figure given below, the position–time graph of a particle of mass 0·1 kg is shown. The impulse at t=2sec is
 View Solution
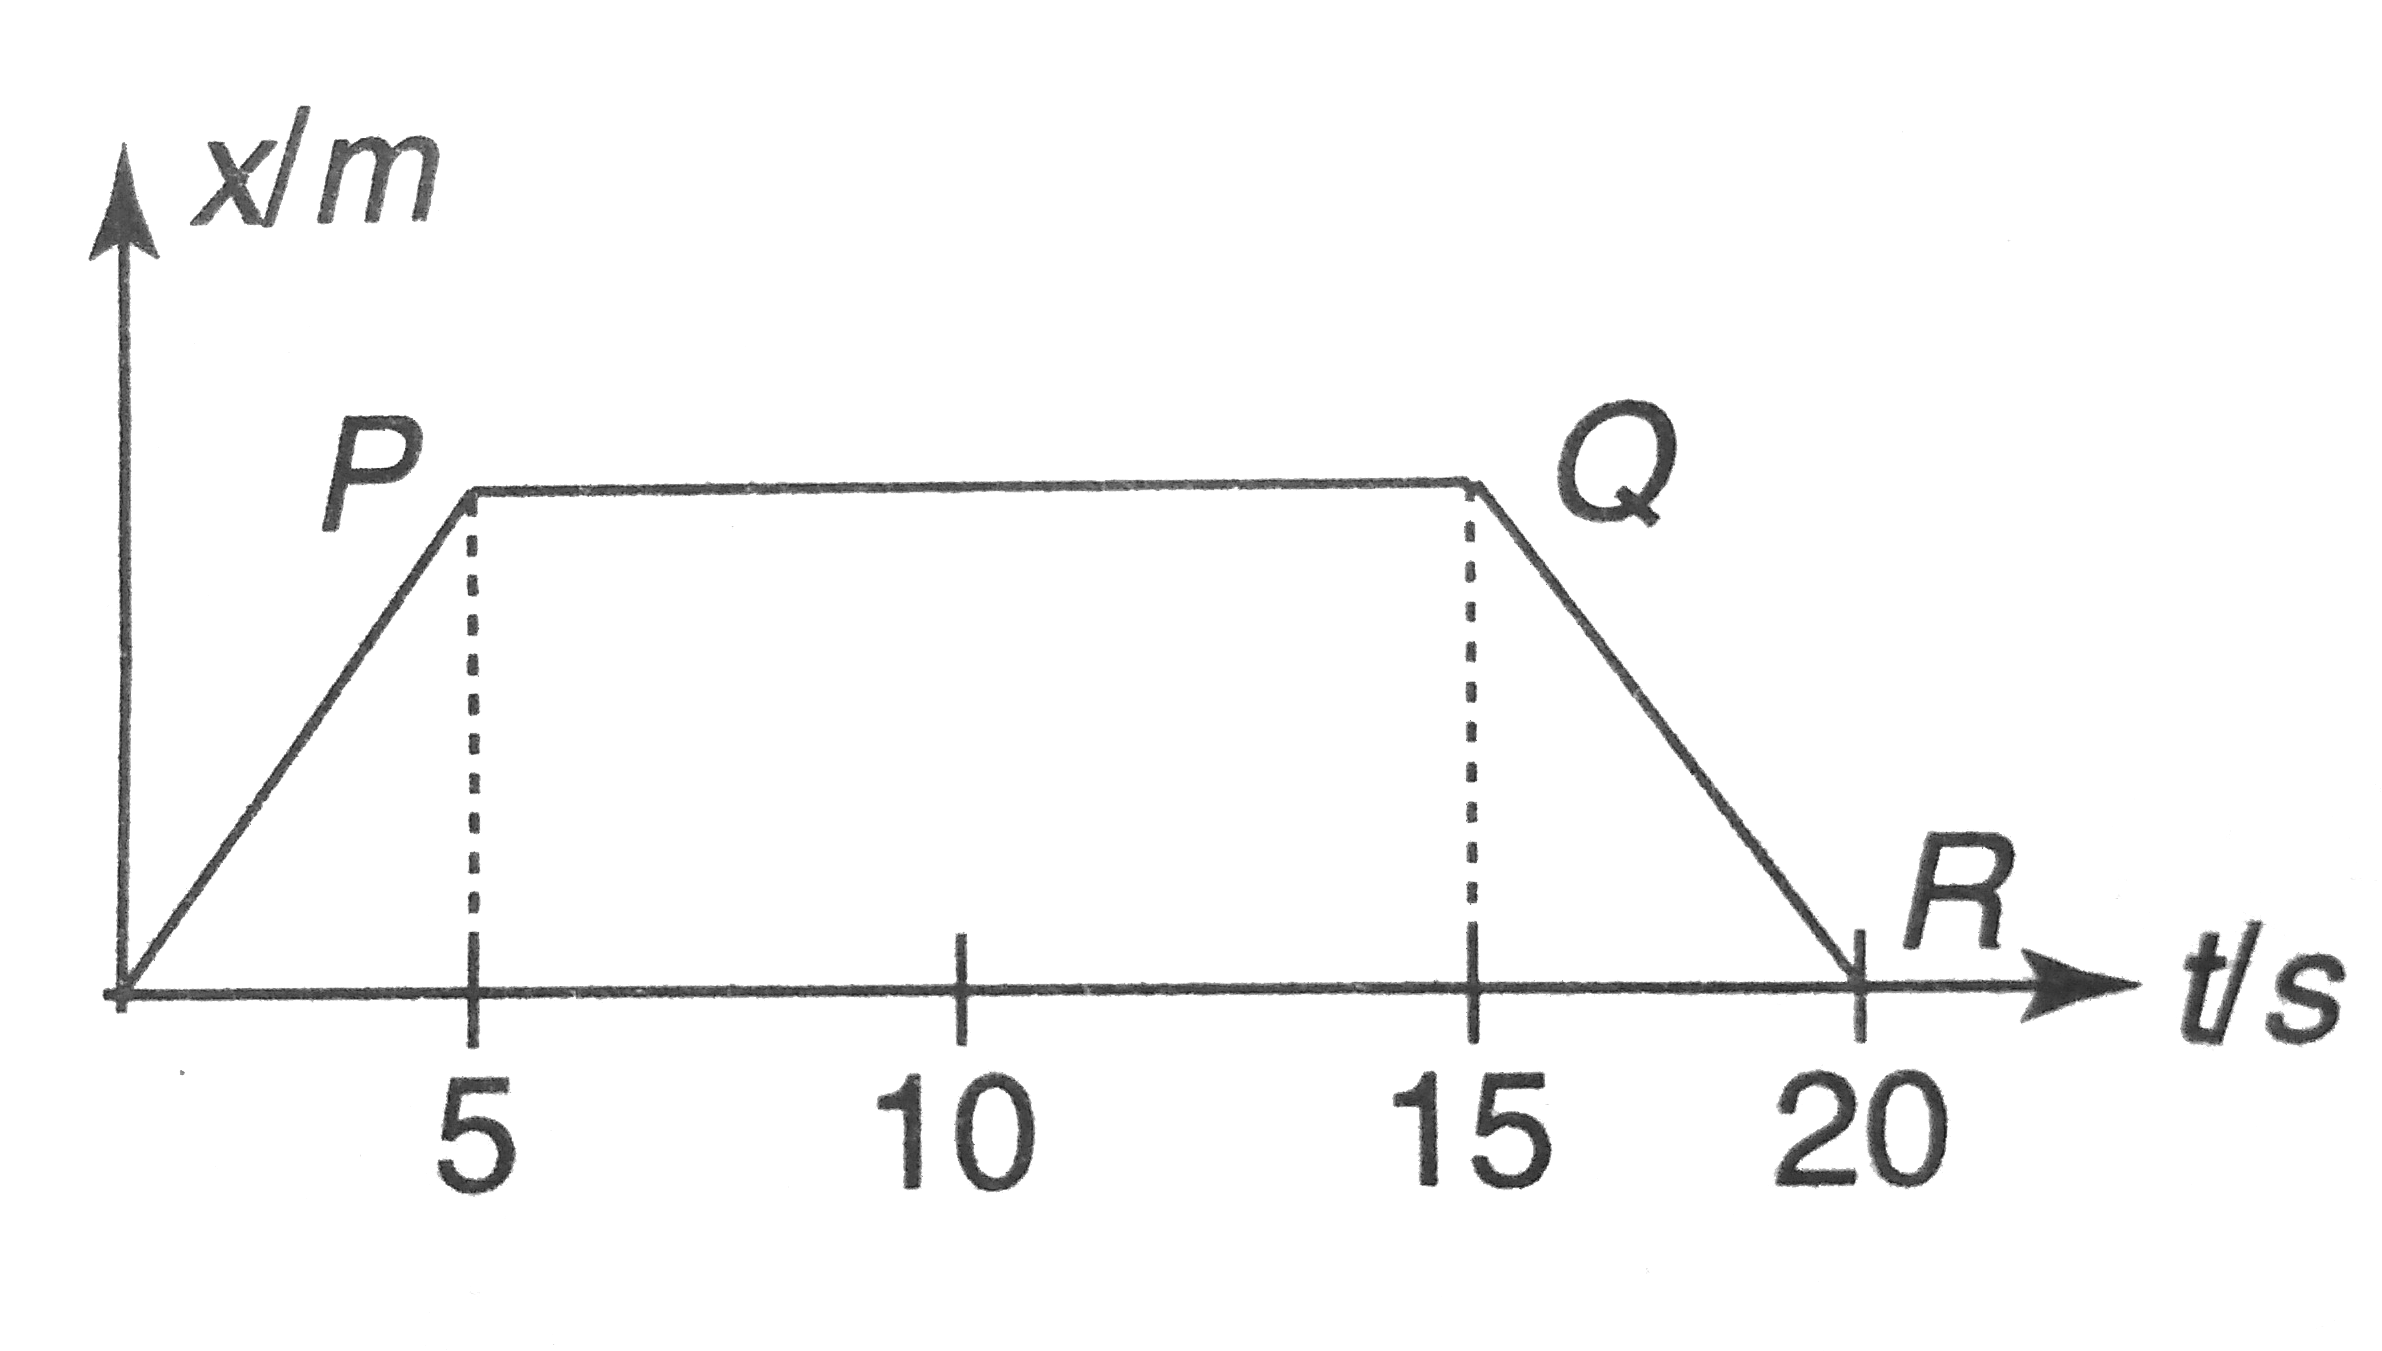
Figure shows the position the graph for a particle in one dimensional motion. Which of the graphs in fugure represent the variation in the velocity of the particle with time ?
 View Solution
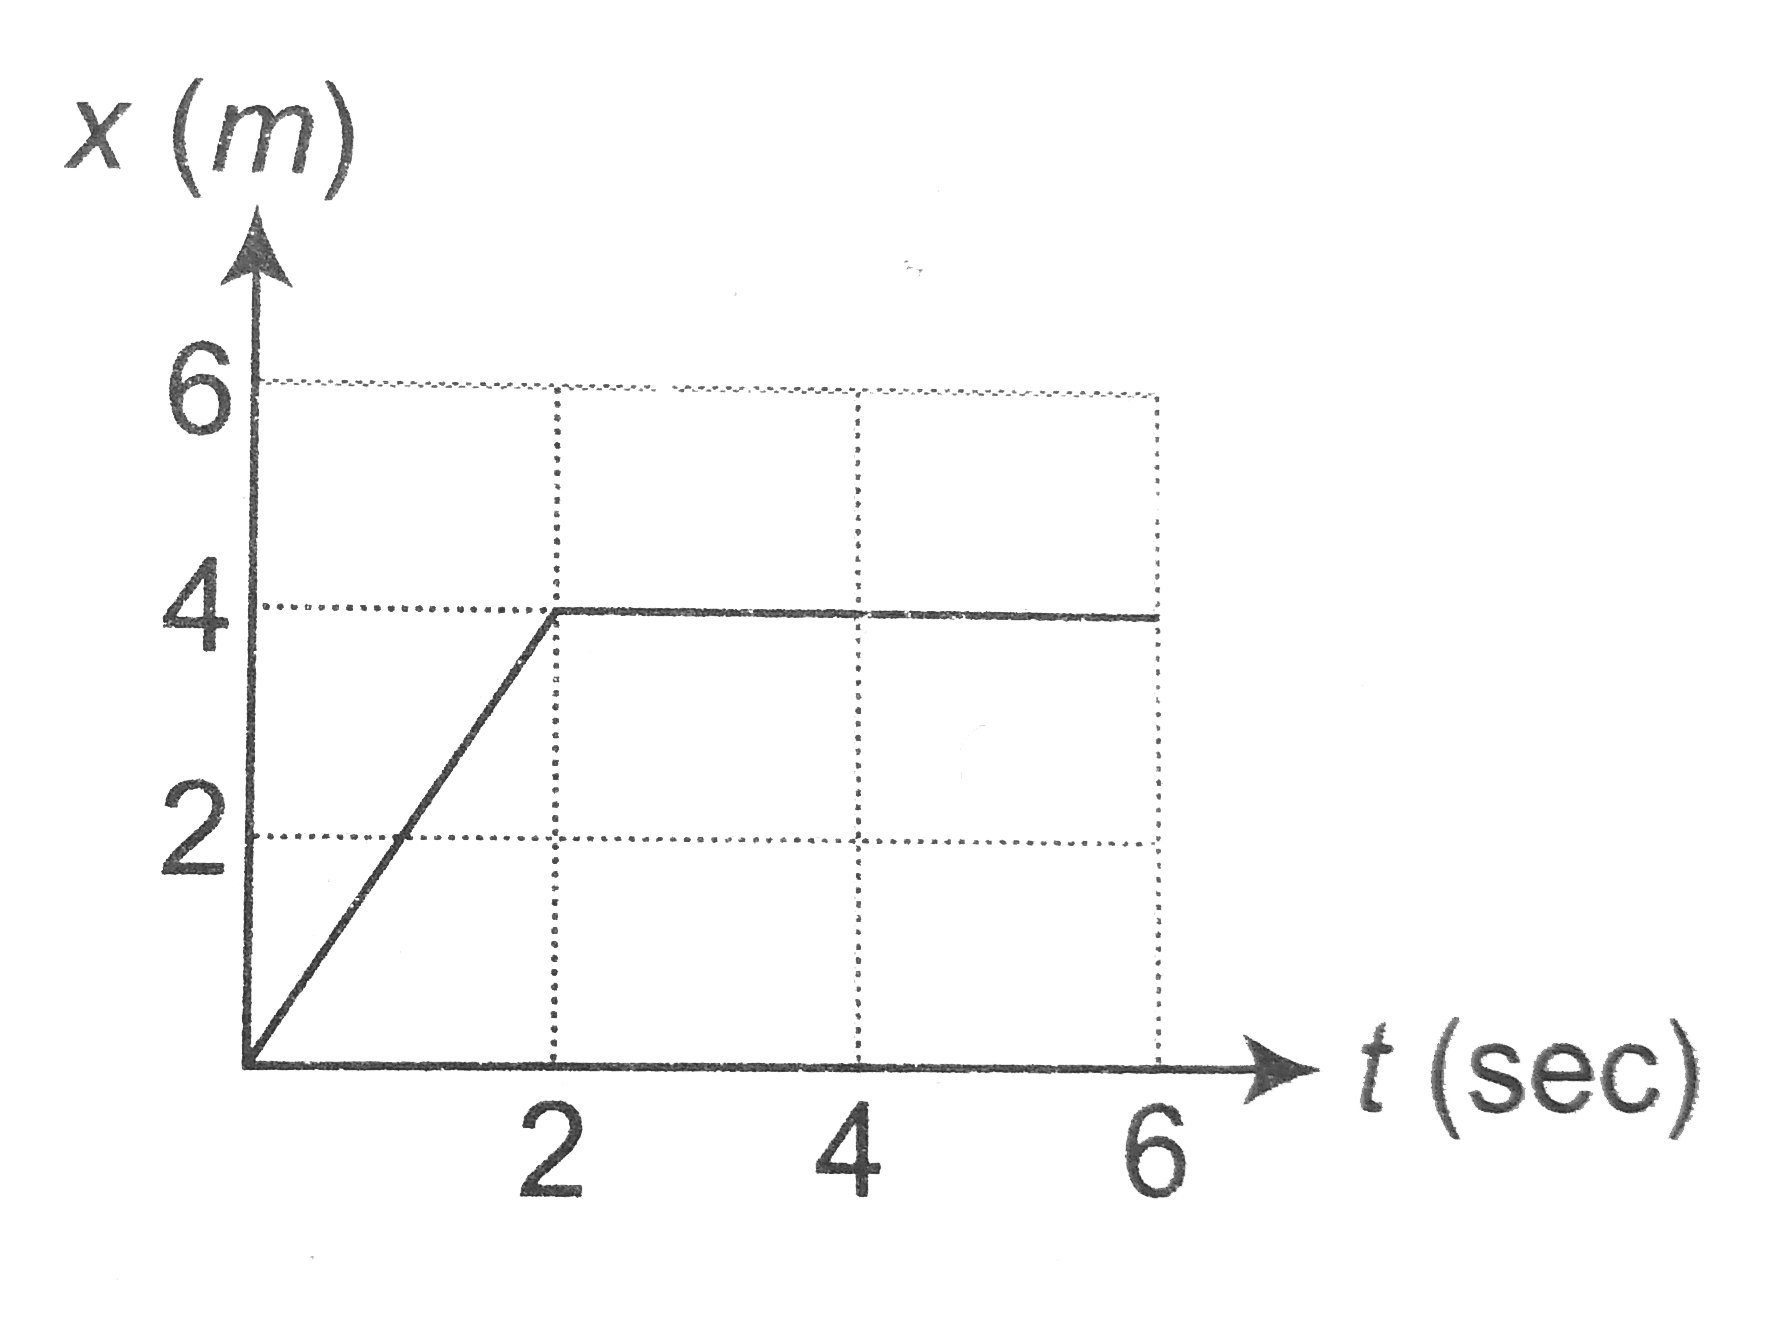
In the figure given below, the position-time graph of a particle of mass 0.1kg is shown. The impuslse at t=2 sec is
 View Solution
