Isotherms of carbon dioxide at various temperatures are represented in figure. Answer the following questions based on this figure.
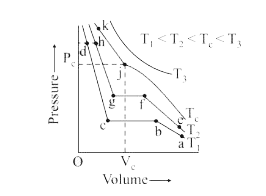
In which state will CO2 exist between the points a and b at temperature T1 ?
In gaseous state, CO2 will exist between the points a and b at temperature T1.
Similar Questions
Isotherms of carbon dioxide at various temperature are represented in Fig.
Answer the following questions bases of this figure.
(i) In which state will CO2 exist between the point a and b at temperature T1?
(ii) At what point will CO2 start liquefying when temperature is T1?
(iii) At what point will CO2 be completely liquified when temperature is T2.
(iv) Will condensation take places when the temperature is T3.
(v) What portion of the isotherm at T1 represents liquid and gaseous CO2 at equilibrium ?
 View Solution
Isotherms of carbon dioxide at various temperatures are represented in figure. Answer the following questions based on this figure.
At what point will CO2 start liquefying when temperature is T1?View Solution
Knowledge Check
- Question 1 - Select One
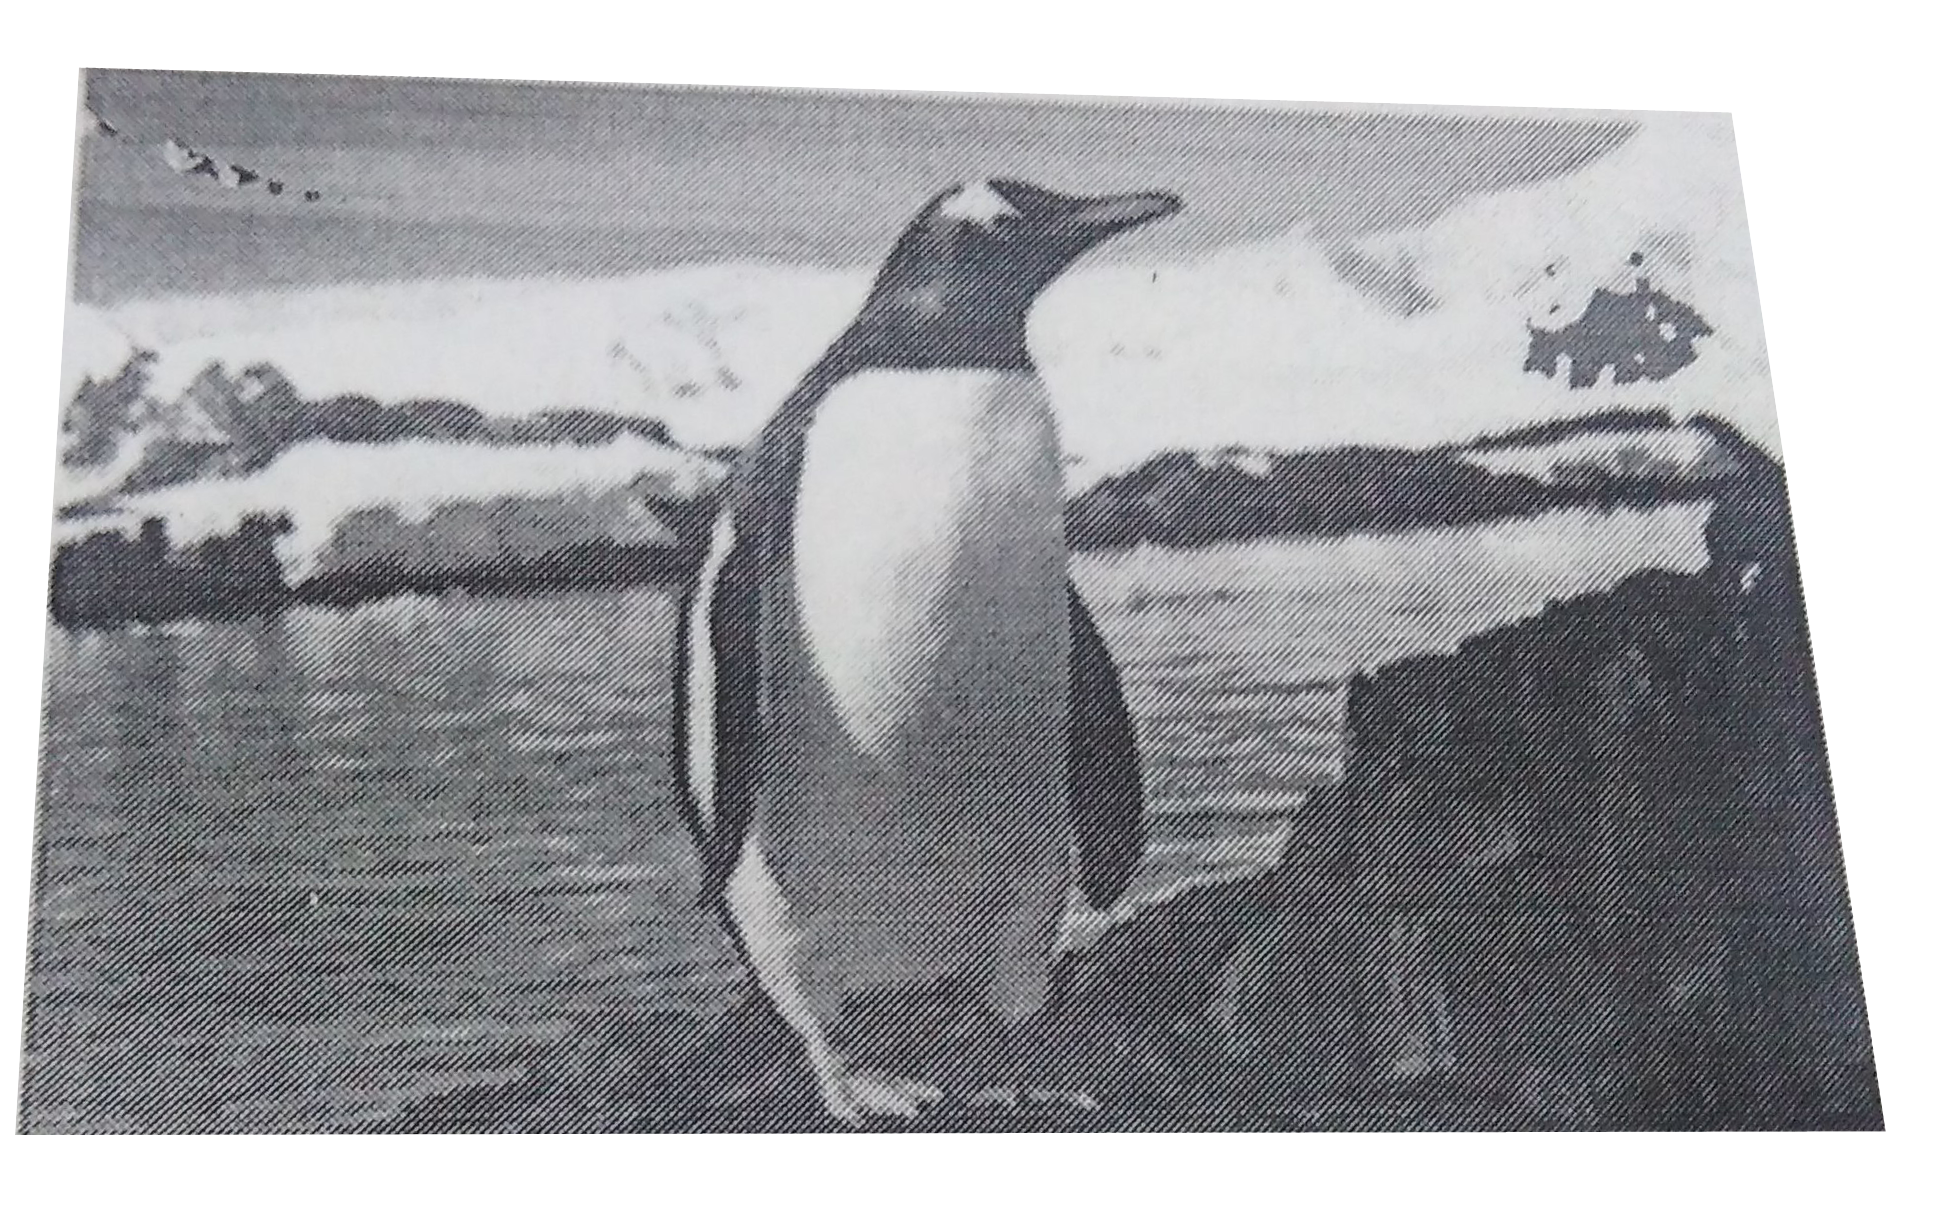
Answer the following questions based on the above figure.AIdentify the animal and its habitat.BMention the characteristic features for adaptation in the habitat.CMention any other animal which lives in the same habitat.DThe trees in these habitats are usually cone shaped. Give reason. - Question 2 - Select One
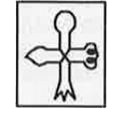
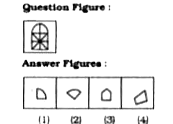
Which one of the answer figures is hidden in the following question figure ? Question Figure :
 A
A B
B C
C D
D
Isotherms of carbon dioxide at various temperatures are represented in figure. Answer the following questions based on this figure.
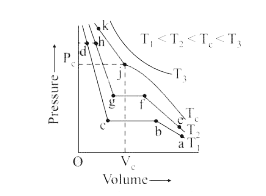
At what point will CO2 be completely liquefied when temperature is T2 ?View SolutionIsotherms of carbon dioxide at various temperatures are represented in figure. Answer the following questions based on this figure.
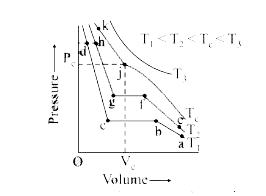
Will condensation take place when the temperature is T3?View SolutionIsotherms of carbon dioxide at various temperatures are represented in figure. Answer the following questions based on this figure.
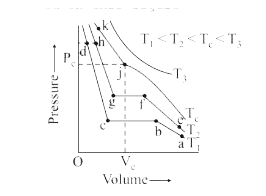
What portion of the isotherm at T1 represent liquid and gaseous CO2 at equilibrium?View SolutionWhich answer figure is the part of following question figure?
 View Solution
Observe Figure 10.1 carefully and answer the following questions.
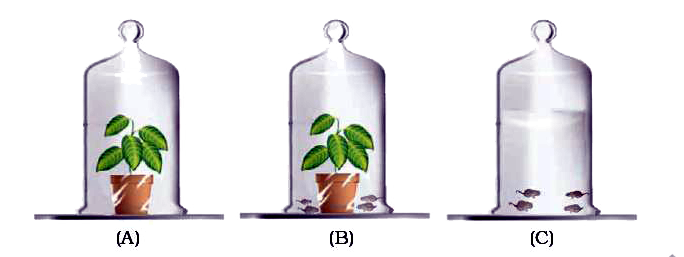
In which jar, will the amount of CO2 be the lowest and why?View SolutionWhich of the curves in figure represents the telation between Celsius and Fahrenheit temperatures? <br>
 View Solution

