The variation of vapour pressure of different liquids with temperature is shown in figure
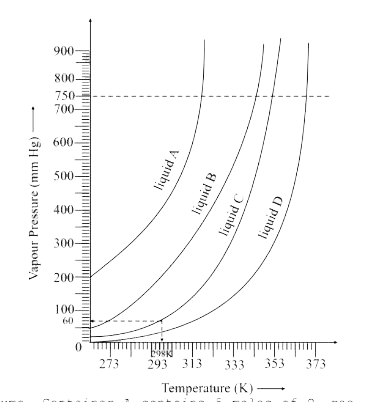
Calculate graphically boiling points of liquids A and B.
(i) Boiling point of A = approximately 315 K, B = approximately 345 K,
Similar Questions
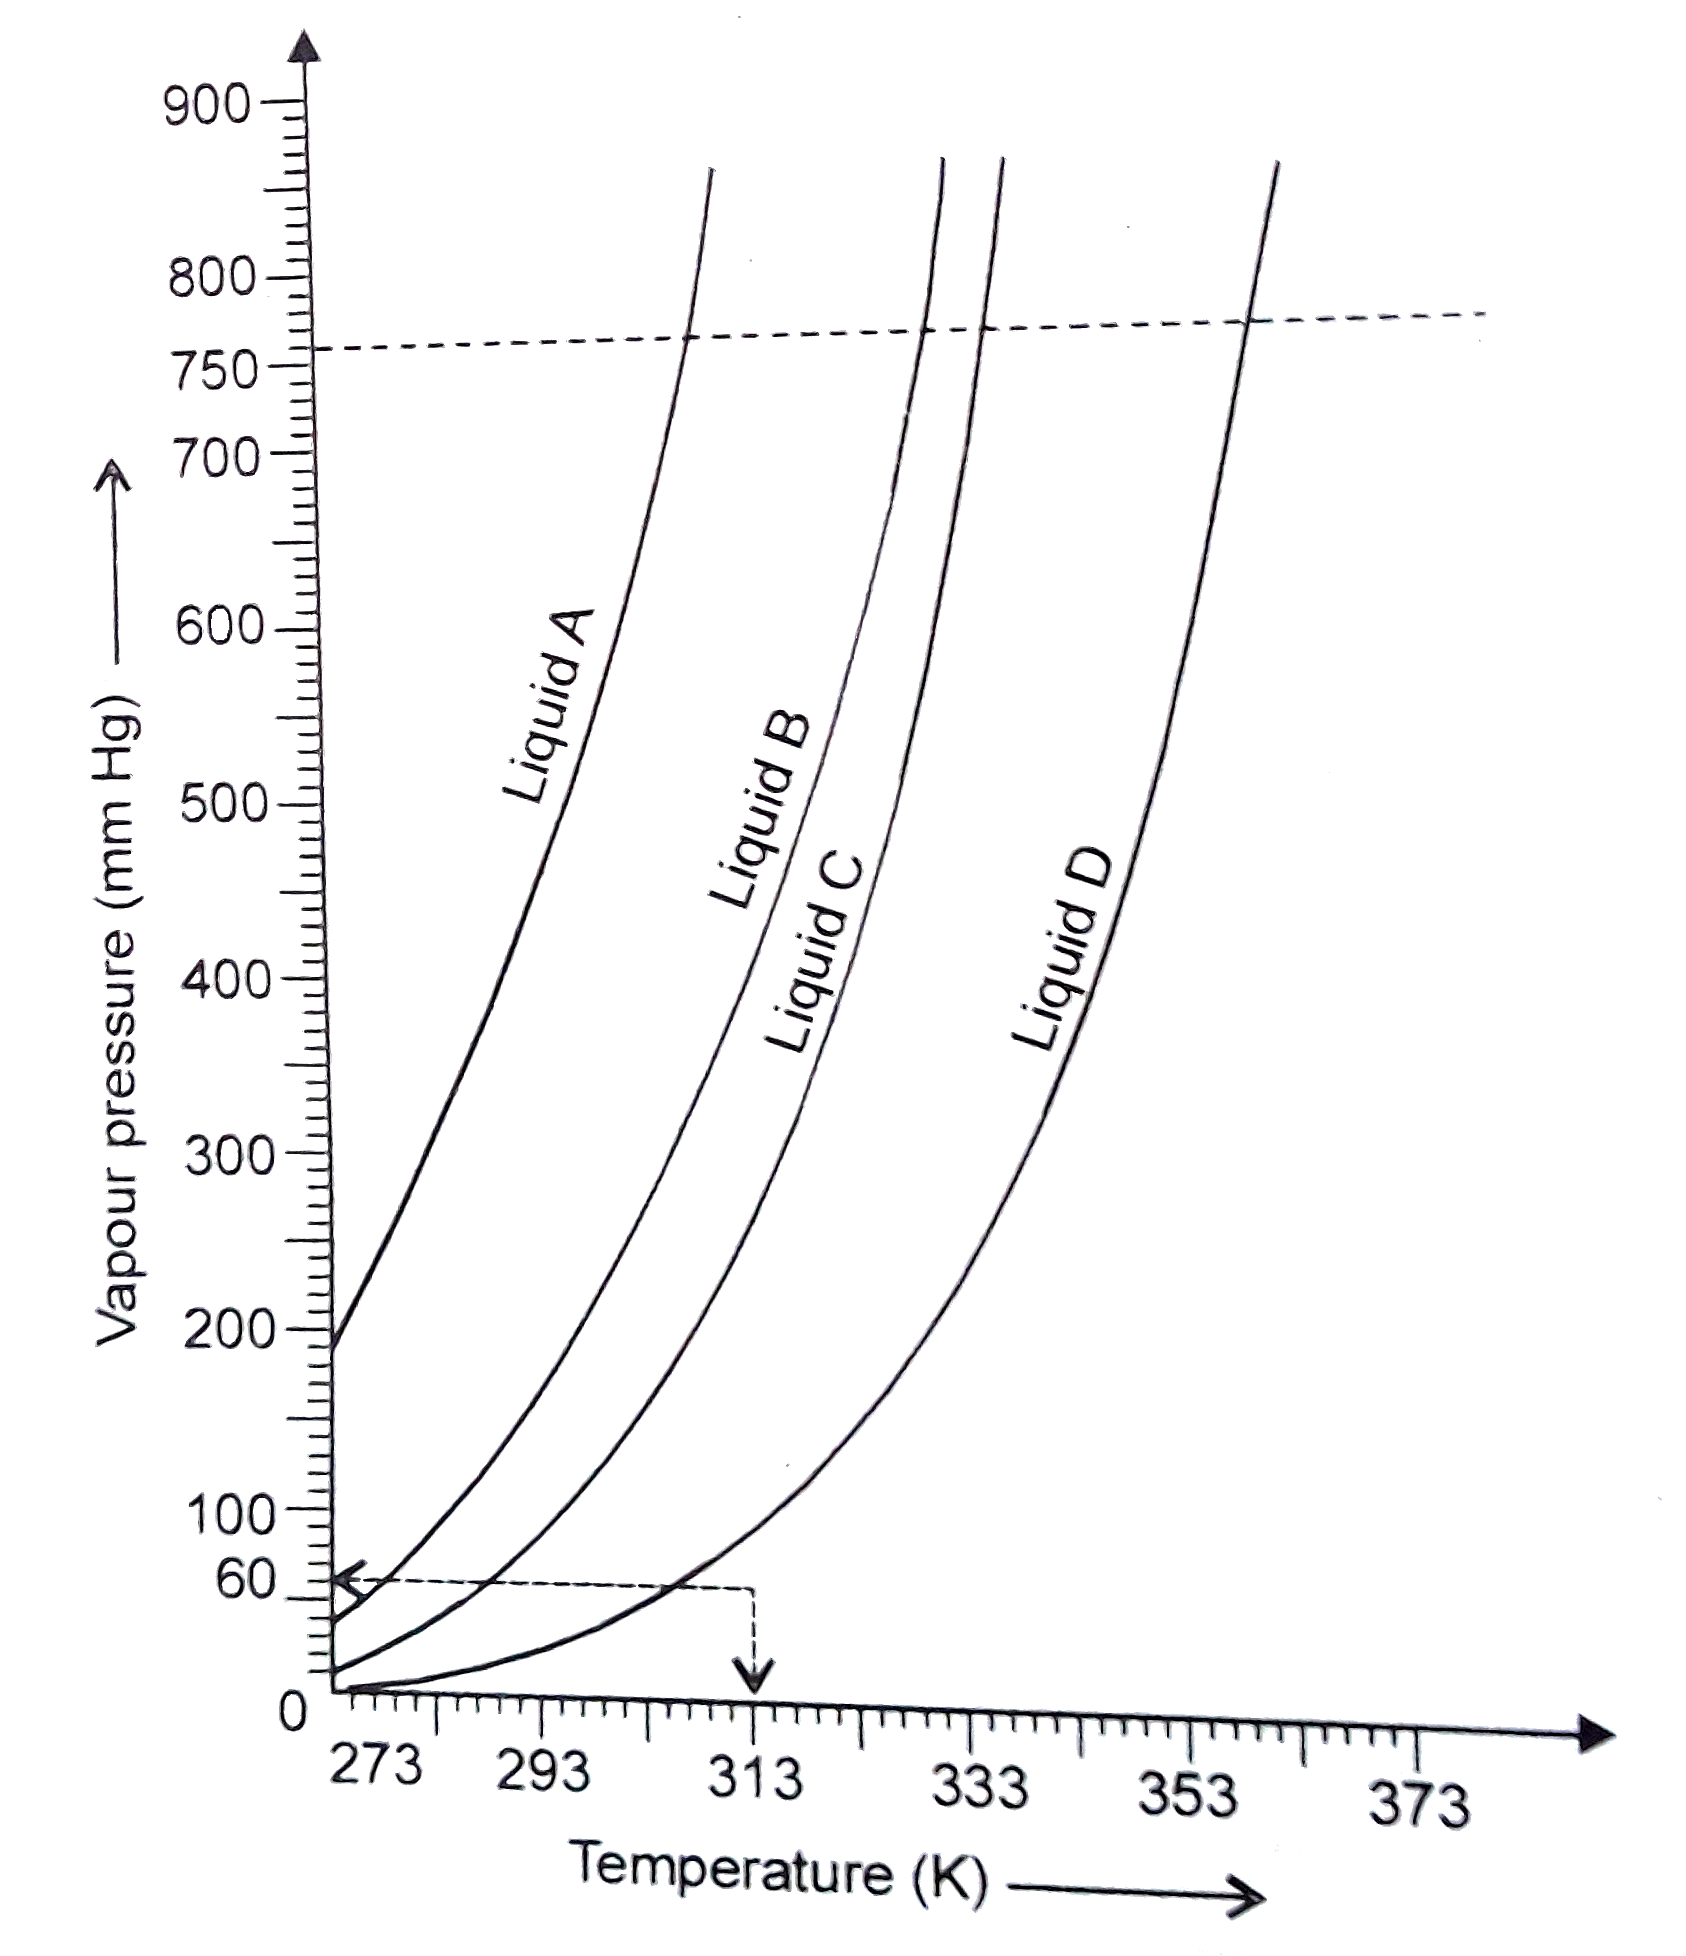
The variation of vapour pressure of different liquids with temperature is shown in the figure.
(i) Calculate graophically boiling points of liquids A and B.
(ii) If we take liquid C in a closed vessel and heat it continuosly, at what tempeature will it boil ?
(iii) At high altitude, atmosopheric pressure is low (say 60mmHg). At what temperature liquid D boils?
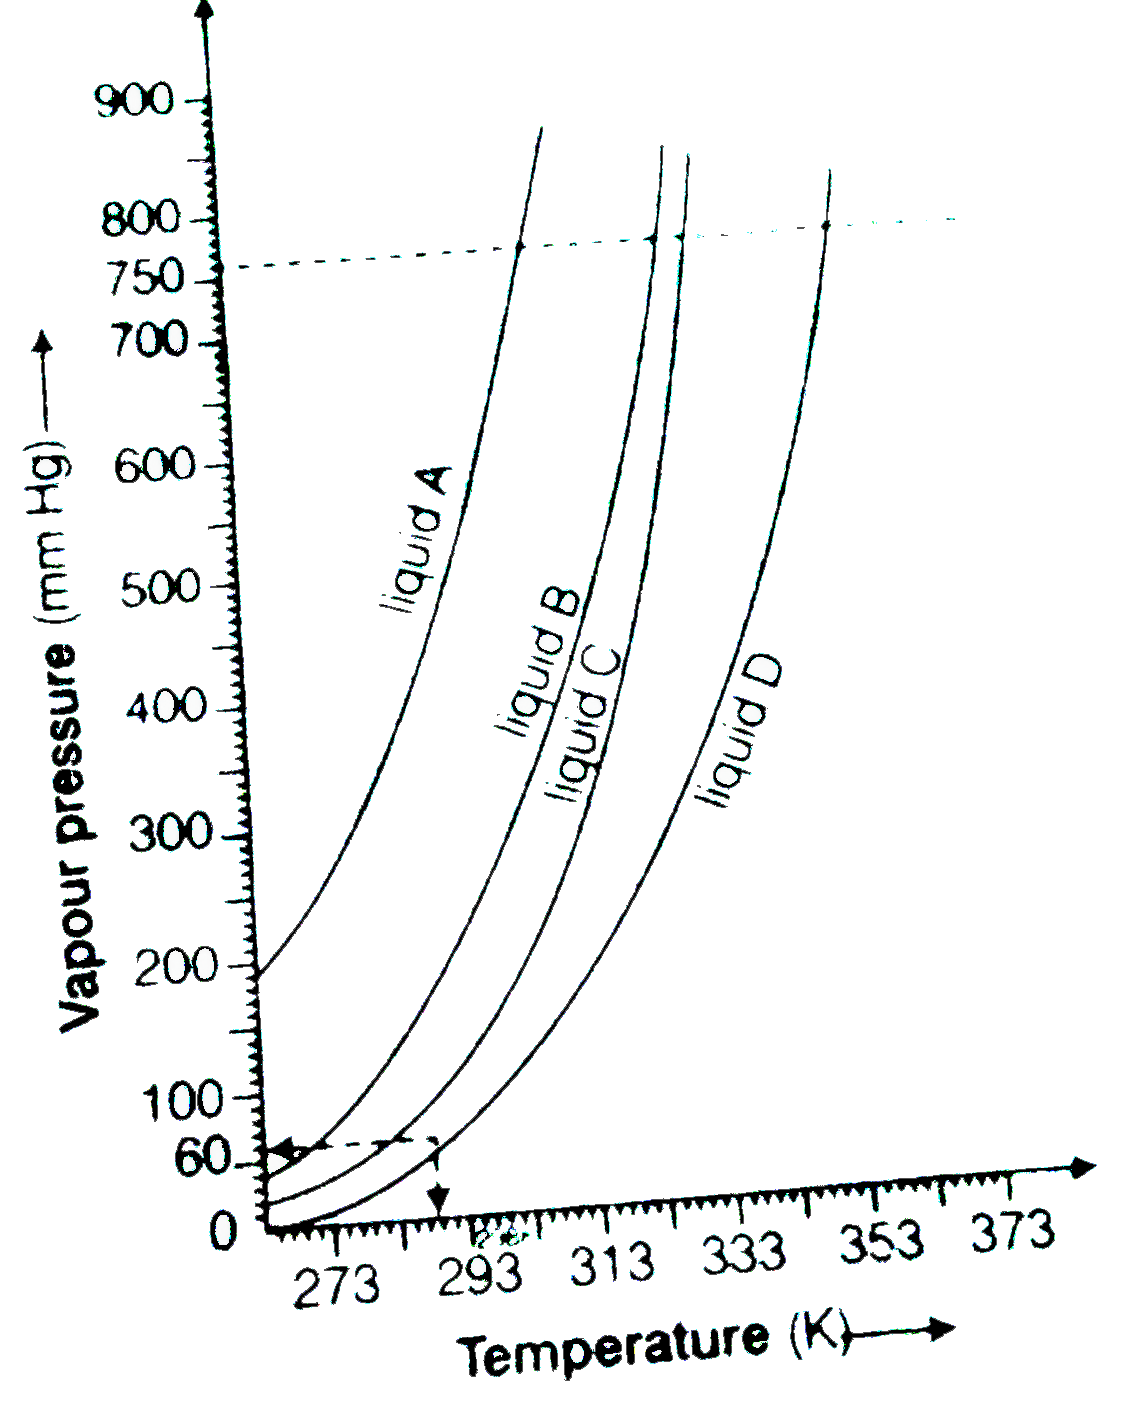
View SolutionThe variation of vapour of different liquids with temperature is shown in figure
(i) Calculate graphically boiling points of liquids A and B.
(ii) If we take liquid c in a closed vessel and heat it continuously. At what temperature will it boil ?
(iii) At high altitude, atmospheric pressure is low (say 60 mm Hg). At what temperature liquid D boils ?
(iv) Pressure cooker is used for cooking food at hill station. Explain in terms of vapour pressure why is it so ?
View Solution
Knowledge Check
Vapour pressure of a liquid depends on
AVolume of containerBAmount of liquidCSurface area of containerDTemperatureThe vapour pressure of any liquid shows following change with temperature :-
AExponential incraseBexponential decreaseCLinear increaseDLinear decreaseThe vapour pressure of a liquid varies with temperature as log P=−AT+I. The plot of
Alog P against T will be a straight lineBlog P against 1/T will be straight lineClog P against I will be a parabolaDNone of these
The variation of vapour pressure of different liquids with temperature is shown in figure
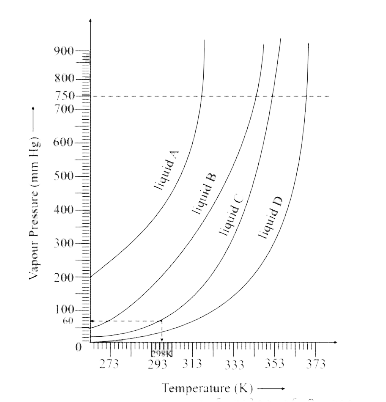
At high altitude, atmospheric pressure is low (say 60 mm Hg). At what temperature liquid D boils?
View SolutionThe variation of vapour pressure of different liquids with temperature is shown in figure
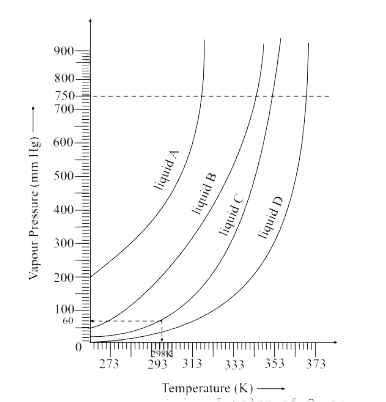
If we take liquid C in a closed vessel and heat it continuously. At what temperature will it boil?
View SolutionThe variation of vapour pressure of different liquids with temperature is shown in figure
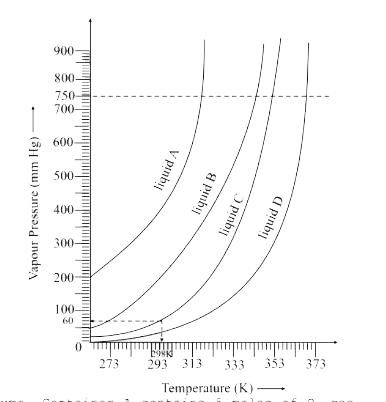
Pressure cooker is used for cooking food at hill station. Explain in terms of vapour pressure why is it so ?
View SolutionVariation of pressure in Liquid
View SolutionWhy is the vapour pressure of liquid constant at a constant temperature ?
View Solution
