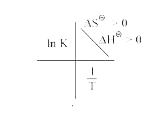
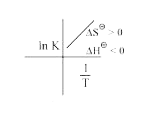
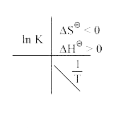
Which of the plots of ln K vs (1T) is/are correct?
A

B

C

D

Text Solution
The correct Answer is:A, B, C, D
ΔG∘=−RTlnKeq=ΔH∘−TΔS∘
ln Keq=−ΔH∘R.1T+ΔS∘R
Slope =−ΔH∘R,y1 in tercept t=ΔS∘R
|
Similar Questions
Knowledge Check
Which is the correct plot for In k vs 1/T?
A B
B C
C D
D
In the Arrhenius plot of ln k vs 1T , a linear plot is obtained with a slope of −2×10⁴ K . The energy of activation of the reaction (in kJ mole−1) is (R value is 8.3 JK−1mol−1)
A83B166C249D332The plot of log k vs 1/T helps to calculate
Aenergy of activationBrate constant of the reactionCorder of the reactionDenergy of activation as well as the frequency factor.
Draw the plot log V vs log T.
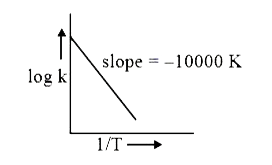
View SolutionFor the reaction aA+bB→cC+dD, the plot of log k vs 1T is given below,

The temperature at which the rate constant of the reaction is 10−4s−1 is _____K.
(Rouded -off the nerest integer)
[Given : The rate constant of the reaction is 10−5s−1 at 500 K.]
View SolutionIn a plot of log k vs 1/T, the slope is
View SolutionIn a plot of log k vs 1/T, the slope is
View SolutionIn a plot of log k vs 1/T, the slope is
View Solution
